The story of one speedometer problem, or How Chromium drives memory
A modern browser is an extremely complex project in which even innocuous-looking changes can lead to unexpected surprises. Therefore, there are many internal tests that should catch these changes before the release. There are never too many tests, therefore it is useful to use third-party public benchmarks as well.
My name is Andrey Logvinov, I work in the development group of the rendering engine Yandex. Browser in Nizhny Novgorod. Today I will tell Habr's readers how the memory management in the Chromium project is arranged using the example of one mysterious problem that led to a drop in performance in the Speedometer test . This post is based on my report from the Yandex event. Inside.

Once on our performance dashboard, we saw a speedometer performance deterioration. This test measures the aggregate browser performance on a real-world application — a to-do list where the test adds items to the list and then crosses them out. The test results are affected both by the performance of the V8 JS engine and the speed of page rendering in the Blink engine. The Speedometer test consists of several subtests, where the test application is written using one of the popular JS frameworks, such as jQuery or ReactJS. The overall test result is defined as the average for the results across all frameworks, but the test allows you to see the performance of each framework separately. It should be noted that the test does not aim to assess the performance of the frameworks, they are used only to to make the test less synthetic and more close to real web applications. Detailing by subtests showed that the deterioration is observed only for the version of the test application created using jQuery. And this is interesting, you see.
Investigation of such situations begins fairly standardly - we determine which particular commit to the code led to the problem. To do this, we store the Yandex. Browser assemblies for each (!) Commit over the past few years (it would be impractical to re-build since the assembly takes several hours). It takes a lot of server space, but usually it helps to quickly find the source of the problem. But this time quickly failed. It turned out that the deterioration of the test results coincided with a commit that integrates the next version of Chromium. The result is not encouraging, because the new version of Chromium brings a huge amount of changes at once.
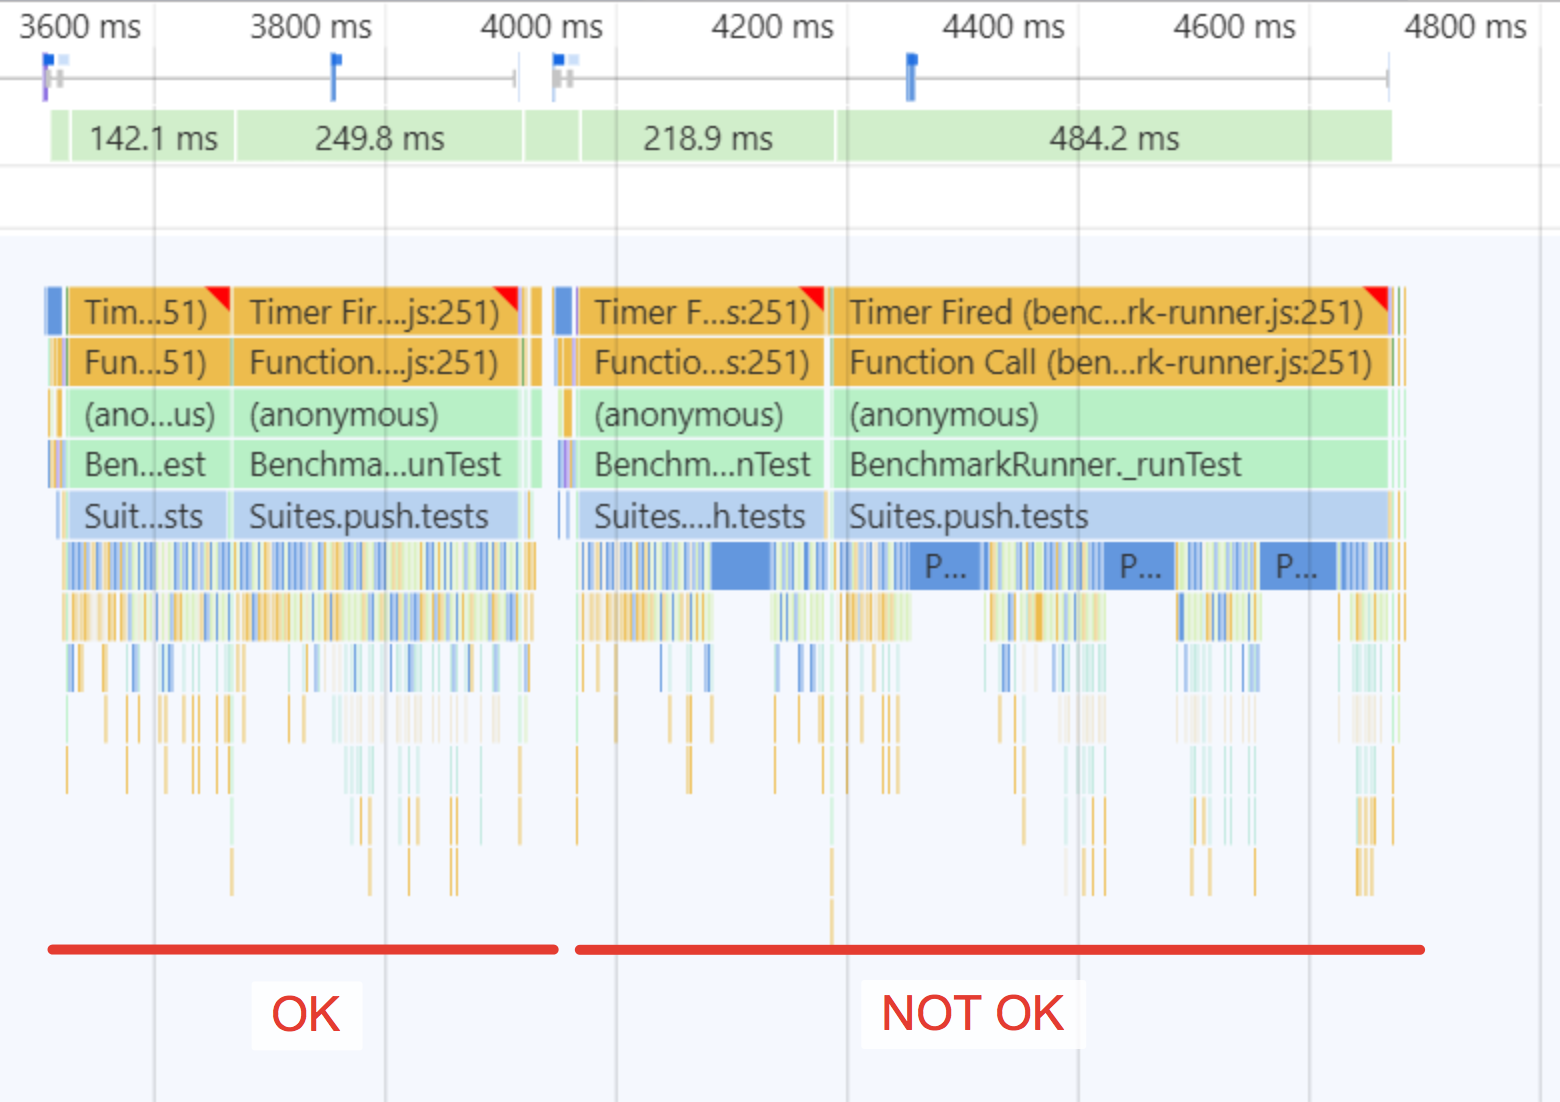
Since we did not receive information indicating a specific change, we had to study the problem essentially. To do this, we with the help of Developer Tools removed the test test. Noticed a strange feature - "torn" intervals of the execution of Javascript functions of the test.
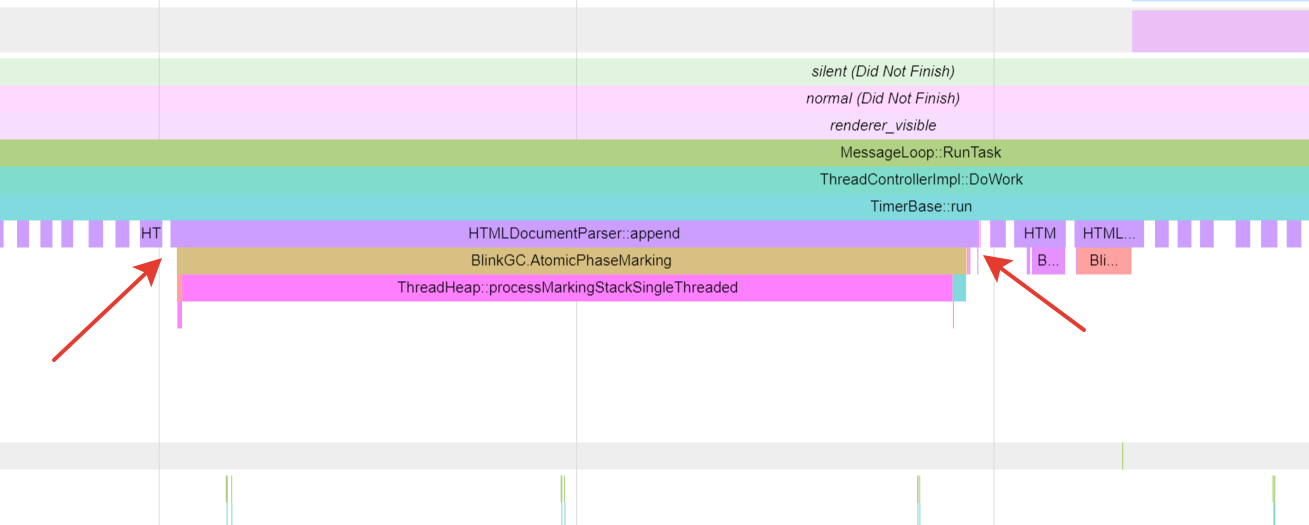
We remove a more technical trace with the help of about: tracing and see that this is a garbage collection (GC) in Blink.
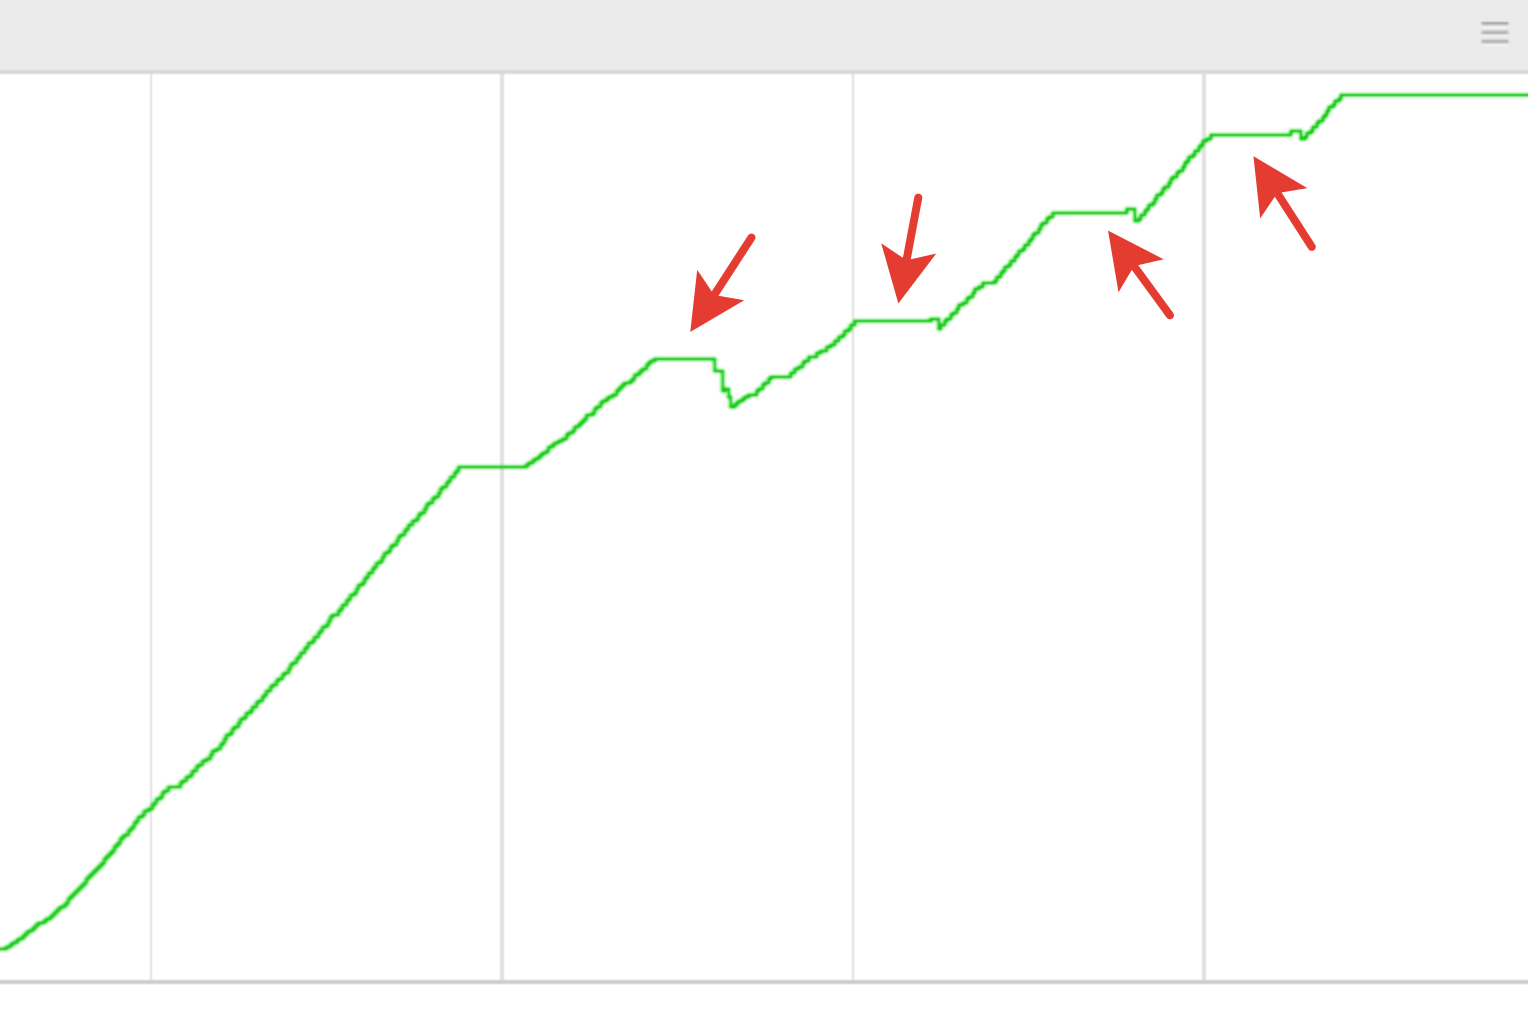
On the memory trace, it can be seen below that these GC-pauses not only take a lot of time, but also do not help to stop the growth of consumed memory.
But if we insert into the test an explicit call for GC, then we see a completely different picture - the memory is kept near zero and does not flow away. So, we don’t have memory leaks, and the problem is connected with the peculiarities of the work of the collector. We continue to dig. We start the debugger and see that the garbage collector has bypassed about 500 thousand objects! Such a number of objects could not affect the performance. But where did they come from?
And here we need a small flashback about the device garbage collector in Blink. It removes dead objects, but does not move living objects, which makes it possible to operate with “bare” pointers in local variables in C ++ code. This pattern is actively used in Blink. But it also has its price - when collecting garbage you have to scan the stackflow, and if there is something similar to a pointer to an object from the heap (heap), then consider the object and everything to which it refers, directly or indirectly, alive. This leads to the fact that some actually inaccessible and therefore "dead" objects are identified as living. Therefore, this form of garbage collection is also called conservative.
Check the connection with the stack scan and skip it. The problem has disappeared.
What could be such a stack that holds 500 thousand objects? Put a stopping point in the function of adding objects - among other things, we see there suspicious:
blink :: TraceTrait <blink :: HeapHashTableBacking <WTF :: HashTable <blink :: WeakMember ...
Reference to the hash table- probable suspect! We check the hypothesis by skipping the addition of this link. The problem has disappeared. Great, we are one step closer to the solution.
We recall another feature of the garbage collector in Blink: if he sees a pointer to the interior of a hash table, he considers this a sign of continuing iteration over the table, which means that he considers all references to this table to be useful and continues to bypass them. In our case, idle. But what function is the source of this link?
We move up a few frames of the stack above, take the current position of the scanner, look, what function does it fit into the stack frame. This is a function called ScheduleGCIfNeeded. It would seem that here it is the culprit, but ... we look at the source code of the function and see that there are no hash tables there and no mention. Moreover, it is already part of the garbage collector itself, and it simply does not need to refer to objects from the Blink heap. Where, then, did this “bad” link come from?
We set a breakpoint to change the memory cell in which we found the link to the hash table. We see that one of the internal functions called V8PerIsolateData :: AddActiveScriptWrappable is writing there. There is the addition of created HTML-elements of some types, including input, into a single hash table active_script_wrappables_. This table is needed to prevent deletion of elements that are no longer referenced from Javascript or the DOM tree, but which are associated with any external activity that, for example, can generate events.
The garbage collector during a normal table crawl takes into account the state of the elements contained in it and either marks them as alive or does not mark them, then they are deleted in the next stage of the assembly. However, in our case, a pointer to the internal storage of this table pops up when the stack is scanned, and all elements of the table are marked as live.
But how does the value from the stack of one function get onto the stack of another?
We recall about ScheduleGCIfNeeded. Recall that nothing useful was found in the source code of this function, but this only means that it is time to go down to a lower level and check the operation of the compiler . The disassembled prolog of the ScheduleGCIfNeeded function looks like this:
It is seen that the function moves esp down to 0B8h , and this place is not used further. But because of this, the stack scanner sees what was previously recorded by other functions. And by chance it is precisely in this “hole” that the pointer falls on the interior of the hash table, left by the AddActiveScriptWrappable function. As it turned out, the cause of the “hole” in this case was the VLOG debugging macro inside the function, which displays additional information in the log.
But why in the table active_script_wrappable_ were hundreds of thousands of elements? Why performance deterioration is observed only on the jQuery test? The answer to both questions is the same - in this particular test, for every change (like the checkbox), the entire UI is recreated completely. The test produces elements that almost immediately turn into garbage. The remaining tests in the Speedometer are more prudent and do not create unnecessary elements, so there is no deterioration in performance for them. If you are developing web services, then you should take this into account in order not to create extra work for the browser.
But why the problem arose only now, if the macro VLOG was before? There is no exact answer, but, most likely, during the update, the mutual arrangement of elements on the stack changed, because of which the pointer to the hash table was accidentally available to the scanner. In fact, we won the lottery. To quickly close the “hole” and restore performance, we removed the VLOG debugging macro. It is useless for users, and for our own diagnostic needs we can always turn it back on. We also told about our experience to other developers from Chromium. The answer confirmed our concerns: this is the fundamental problem of conservative garbage collection in Blink, which has no systemic solution.
1. If you are interested in learning about other unusual workdays of our group, then we recall the story of the black rectangle , which led to the acceleration of not only the Yandex Browser, but also the entire Chromium project.
2. And I also invite you to listen to other reports at the next Yandex event. Inside February 16, registration is open, there will also be a broadcast.
My name is Andrey Logvinov, I work in the development group of the rendering engine Yandex. Browser in Nizhny Novgorod. Today I will tell Habr's readers how the memory management in the Chromium project is arranged using the example of one mysterious problem that led to a drop in performance in the Speedometer test . This post is based on my report from the Yandex event. Inside.

Once on our performance dashboard, we saw a speedometer performance deterioration. This test measures the aggregate browser performance on a real-world application — a to-do list where the test adds items to the list and then crosses them out. The test results are affected both by the performance of the V8 JS engine and the speed of page rendering in the Blink engine. The Speedometer test consists of several subtests, where the test application is written using one of the popular JS frameworks, such as jQuery or ReactJS. The overall test result is defined as the average for the results across all frameworks, but the test allows you to see the performance of each framework separately. It should be noted that the test does not aim to assess the performance of the frameworks, they are used only to to make the test less synthetic and more close to real web applications. Detailing by subtests showed that the deterioration is observed only for the version of the test application created using jQuery. And this is interesting, you see.
Investigation of such situations begins fairly standardly - we determine which particular commit to the code led to the problem. To do this, we store the Yandex. Browser assemblies for each (!) Commit over the past few years (it would be impractical to re-build since the assembly takes several hours). It takes a lot of server space, but usually it helps to quickly find the source of the problem. But this time quickly failed. It turned out that the deterioration of the test results coincided with a commit that integrates the next version of Chromium. The result is not encouraging, because the new version of Chromium brings a huge amount of changes at once.
Since we did not receive information indicating a specific change, we had to study the problem essentially. To do this, we with the help of Developer Tools removed the test test. Noticed a strange feature - "torn" intervals of the execution of Javascript functions of the test.

We remove a more technical trace with the help of about: tracing and see that this is a garbage collection (GC) in Blink.

On the memory trace, it can be seen below that these GC-pauses not only take a lot of time, but also do not help to stop the growth of consumed memory.

But if we insert into the test an explicit call for GC, then we see a completely different picture - the memory is kept near zero and does not flow away. So, we don’t have memory leaks, and the problem is connected with the peculiarities of the work of the collector. We continue to dig. We start the debugger and see that the garbage collector has bypassed about 500 thousand objects! Such a number of objects could not affect the performance. But where did they come from?
And here we need a small flashback about the device garbage collector in Blink. It removes dead objects, but does not move living objects, which makes it possible to operate with “bare” pointers in local variables in C ++ code. This pattern is actively used in Blink. But it also has its price - when collecting garbage you have to scan the stackflow, and if there is something similar to a pointer to an object from the heap (heap), then consider the object and everything to which it refers, directly or indirectly, alive. This leads to the fact that some actually inaccessible and therefore "dead" objects are identified as living. Therefore, this form of garbage collection is also called conservative.
Check the connection with the stack scan and skip it. The problem has disappeared.
What could be such a stack that holds 500 thousand objects? Put a stopping point in the function of adding objects - among other things, we see there suspicious:
blink :: TraceTrait <blink :: HeapHashTableBacking <WTF :: HashTable <blink :: WeakMember ...
Reference to the hash table- probable suspect! We check the hypothesis by skipping the addition of this link. The problem has disappeared. Great, we are one step closer to the solution.
We recall another feature of the garbage collector in Blink: if he sees a pointer to the interior of a hash table, he considers this a sign of continuing iteration over the table, which means that he considers all references to this table to be useful and continues to bypass them. In our case, idle. But what function is the source of this link?
We move up a few frames of the stack above, take the current position of the scanner, look, what function does it fit into the stack frame. This is a function called ScheduleGCIfNeeded. It would seem that here it is the culprit, but ... we look at the source code of the function and see that there are no hash tables there and no mention. Moreover, it is already part of the garbage collector itself, and it simply does not need to refer to objects from the Blink heap. Where, then, did this “bad” link come from?
We set a breakpoint to change the memory cell in which we found the link to the hash table. We see that one of the internal functions called V8PerIsolateData :: AddActiveScriptWrappable is writing there. There is the addition of created HTML-elements of some types, including input, into a single hash table active_script_wrappables_. This table is needed to prevent deletion of elements that are no longer referenced from Javascript or the DOM tree, but which are associated with any external activity that, for example, can generate events.
The garbage collector during a normal table crawl takes into account the state of the elements contained in it and either marks them as alive or does not mark them, then they are deleted in the next stage of the assembly. However, in our case, a pointer to the internal storage of this table pops up when the stack is scanned, and all elements of the table are marked as live.
But how does the value from the stack of one function get onto the stack of another?
We recall about ScheduleGCIfNeeded. Recall that nothing useful was found in the source code of this function, but this only means that it is time to go down to a lower level and check the operation of the compiler . The disassembled prolog of the ScheduleGCIfNeeded function looks like this:
0FCDD13A  push        ebp
0FCDD13B  mov         ebp,esp
0FCDD13D  push        edi
0FCDD13E  push        esi
0FCDD13F  and         esp,0FFFFFFF8h
0FCDD142  sub         esp,0B8h
0FCDD148  mov         eax,dword ptr [__security_cookie (13DD3888h)]
0FCDD14D  mov         esi,ecx
0FCDD14F  xor         eax,ebp
0FCDD151  mov         dword ptr [esp+0B4h],eax
It is seen that the function moves esp down to 0B8h , and this place is not used further. But because of this, the stack scanner sees what was previously recorded by other functions. And by chance it is precisely in this “hole” that the pointer falls on the interior of the hash table, left by the AddActiveScriptWrappable function. As it turned out, the cause of the “hole” in this case was the VLOG debugging macro inside the function, which displays additional information in the log.
But why in the table active_script_wrappable_ were hundreds of thousands of elements? Why performance deterioration is observed only on the jQuery test? The answer to both questions is the same - in this particular test, for every change (like the checkbox), the entire UI is recreated completely. The test produces elements that almost immediately turn into garbage. The remaining tests in the Speedometer are more prudent and do not create unnecessary elements, so there is no deterioration in performance for them. If you are developing web services, then you should take this into account in order not to create extra work for the browser.
But why the problem arose only now, if the macro VLOG was before? There is no exact answer, but, most likely, during the update, the mutual arrangement of elements on the stack changed, because of which the pointer to the hash table was accidentally available to the scanner. In fact, we won the lottery. To quickly close the “hole” and restore performance, we removed the VLOG debugging macro. It is useless for users, and for our own diagnostic needs we can always turn it back on. We also told about our experience to other developers from Chromium. The answer confirmed our concerns: this is the fundamental problem of conservative garbage collection in Blink, which has no systemic solution.
Interesting links
1. If you are interested in learning about other unusual workdays of our group, then we recall the story of the black rectangle , which led to the acceleration of not only the Yandex Browser, but also the entire Chromium project.
2. And I also invite you to listen to other reports at the next Yandex event. Inside February 16, registration is open, there will also be a broadcast.
