Cross-platform weather station development for the Raspberry Pi
As you know, whatever you do under the Raspberry Pi, you get either a media player or a weather station. This fate also befell me - when after another shower the weather station’s sensor was flooded, it was time to either buy a new one or do it yourself.
The following functions were needed from the weather station:
Of the purchased ones, by the combination of “design-price-function”, not one was liked - either there is not one, or the other, or it is too bulky and expensive. As a result, it was decided to use the Raspberry Pi with a TFT-screen, and make those functions that are needed.
It turned out like this:
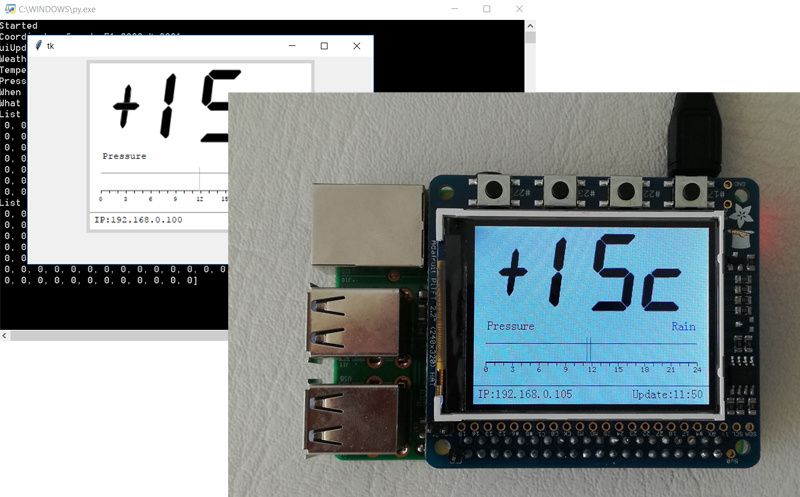
Implementation details and a finished project under the cut.
The first thing to decide was getting weather data. There are 2 options here, either use your sensors or take weather from the Internet. The first is more interesting, but there are several “buts”:
An alternative was to buy a ready-made weather module with sensors for the Raspberry Pi.
Alas, the search showed that there are only 2 options for sale:
- Raspberry Pi sense hat The
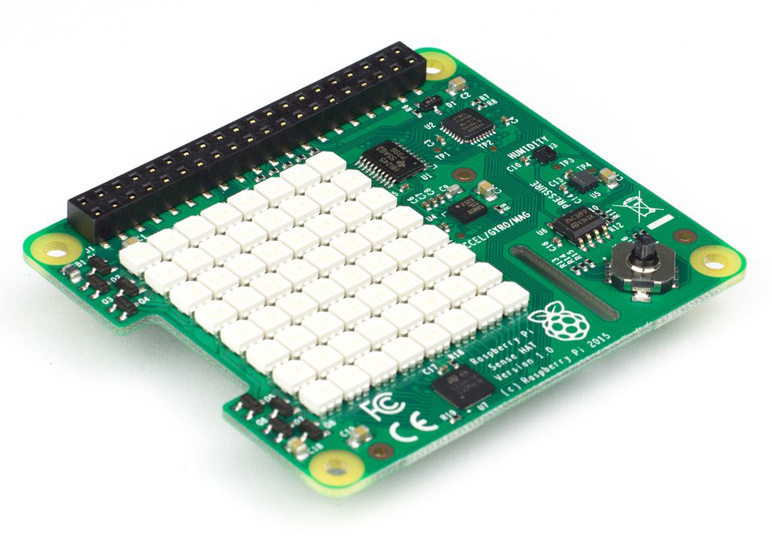
board has a thermometer, a barometer, a humidity sensor, a gyroscope and an accelerometer “on board” - but it’s not clear what the developers thought when setting up such a “screen” of 8x8 LEDs distinct on it can not be deduced. I wish the developers of this module the whole life of the UI to write an 8x8 matrix :)
- Raspberry Pi weather hat
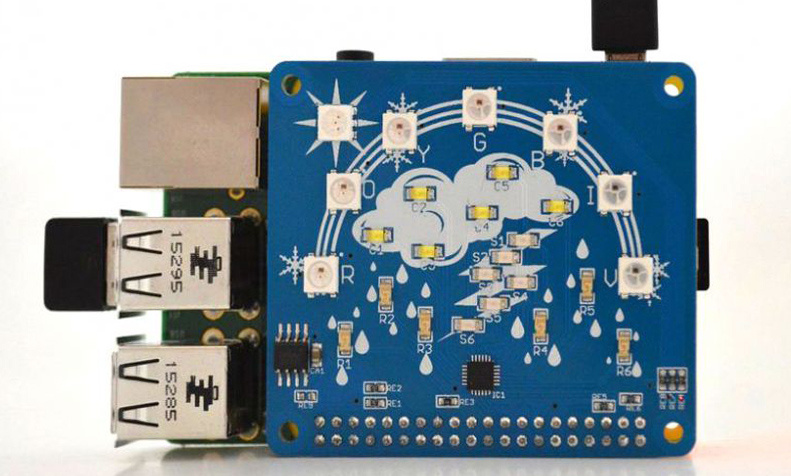
There is nothing but LEDs here at all.
In general, oddly enough, no one did a normal ready-made shield for a weather station with a good screen and a good set of sensors. Crowdsourcers, ay - the market niche disappears :)
As a result, we do not take a steam bath and do it in a simple way - we take the weather from the Internet and display it on a regular TFT. As Google suggested, the most developed API is now at https://openweathermap.org/api , and we will use it.
In the comments there was a question about the accuracy of Internet data. As can be seen in the code below, a request for obtaining current (current weather data) rather than forecasted data is used to display temperature and atmospheric pressure . Their accuracy can be considered quite sufficient for domestic purposes, moreover, most likely it is even higher than the accuracy of a street thermometer / sensor located outside a window or on a balcony.
To get weather data from openweathermap, you need a key, you can get it for free by registering on the above site. The key looks something like “dadef5765xxxxxxxxxxxxxxxx6dc8”. Most of the functions are available for free, we do not need paid APIs. For free functions there is a limit of 60 requests per minute , this is enough for us.
Reading data is very easy thanks to the pyowm library.
Getting the weather at the moment (Python):
Getting a weather forecast to display precipitation:
At the output, we get an array of data with a list of rains and their intensity. Despite the name of the function three_hours_forecast_at_coords, the rains are registered 2-3 days in advance.
You can use GET requests directly, for example like this . This can come in handy, for example, when porting code to MicroPython under ESP.
As can be seen above, latitude and longitude are needed to obtain data. Obtaining coordinates is also quite simple, and is done in 3 lines of code:
Actually, the hardest part. The Raspberry Pi uses an Adafruit TFT display that supports the ILI9340 command system. It’s easy to find libraries for it, but debugging code on the Raspberry Pi is not very convenient. As a result, it was decided to write a high-level set of controls, which needed only 3 - images, text and lines. When launched on Raspberry Pi, the control will draw itself on TFT, when launched on the desktop, the tkinter library built into Python will be used. As a result, the code will work everywhere - both on the Raspberry Pi, and on Windows, and on OSX.
The code for one control looks something like this:
The FakeTFT class creates a regular program window:
The LCDTFT class uses a “real” display (code snippet):
During initialization, the desired display is automatically selected, depending on where the program starts:
All this allows us to completely disengage from the hardware, and write code like this:
Actually, the UI looks like this:
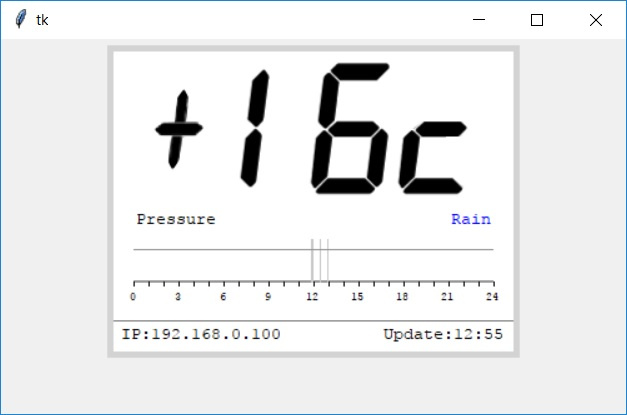
The current temperature is displayed on the screen, the atmospheric pressure graph for today (in the next version the temperature graph will be added), also in case of a rain forecast, its time is marked on the graph by a vertical blue line (there is no rain in this picture). The time of the last data update and IP address are also displayed if you need to connect to the device.
Those who want to get acquainted with the source in more detail can see it on guthub .
For those who do not want to bother with the above, a short installation guide under the spoiler.
In terms of adding something else useful, for example, displaying a cloud map, there is an API on openweathermap for this.
To be continued.
The following functions were needed from the weather station:
- temperature display
- bar graph display
- rain forecast
- time synchronization (in the case of a normal weather station, according to DCF77, if there is a clock on the device, they should show the exact time)
Of the purchased ones, by the combination of “design-price-function”, not one was liked - either there is not one, or the other, or it is too bulky and expensive. As a result, it was decided to use the Raspberry Pi with a TFT-screen, and make those functions that are needed.
It turned out like this:
Implementation details and a finished project under the cut.
Getting weather data
The first thing to decide was getting weather data. There are 2 options here, either use your sensors or take weather from the Internet. The first is more interesting, but there are several “buts”:
- Making the sensor “anyhow” is not difficult, but making the sensor is good, so that for example it works for a year on one set of batteries, the task is not so trivial. Of course, there are now low-consuming proces and radio modules, but it would be too lazy to spend a month on this.
- It is necessary to bother with the case, moisture protection and other trifles (I do not have a 3D printer).
- The balcony faces the sunny side, so the error in measuring the temperature in the first half of the day would be too large.
An alternative was to buy a ready-made weather module with sensors for the Raspberry Pi.
Alas, the search showed that there are only 2 options for sale:
- Raspberry Pi sense hat The
board has a thermometer, a barometer, a humidity sensor, a gyroscope and an accelerometer “on board” - but it’s not clear what the developers thought when setting up such a “screen” of 8x8 LEDs distinct on it can not be deduced. I wish the developers of this module the whole life of the UI to write an 8x8 matrix :)
- Raspberry Pi weather hat
There is nothing but LEDs here at all.
In general, oddly enough, no one did a normal ready-made shield for a weather station with a good screen and a good set of sensors. Crowdsourcers, ay - the market niche disappears :)
As a result, we do not take a steam bath and do it in a simple way - we take the weather from the Internet and display it on a regular TFT. As Google suggested, the most developed API is now at https://openweathermap.org/api , and we will use it.
In the comments there was a question about the accuracy of Internet data. As can be seen in the code below, a request for obtaining current (current weather data) rather than forecasted data is used to display temperature and atmospheric pressure . Their accuracy can be considered quite sufficient for domestic purposes, moreover, most likely it is even higher than the accuracy of a street thermometer / sensor located outside a window or on a balcony.
registration
To get weather data from openweathermap, you need a key, you can get it for free by registering on the above site. The key looks something like “dadef5765xxxxxxxxxxxxxxxx6dc8”. Most of the functions are available for free, we do not need paid APIs. For free functions there is a limit of 60 requests per minute , this is enough for us.
Reading data
Reading data is very easy thanks to the pyowm library.
Getting the weather at the moment (Python):
import pyowm
owm = pyowm.OWM(apiKey)
observation = owm.weather_at_coords(lat, lon)
w = observation.get_weather()
dtRef = w.get_reference_time(timeformat='date')
t = w.get_temperature('celsius')
temperatureVal = int(t['temp'])
p = w.get_pressure()
pVal = int(p['press'])
Getting a weather forecast to display precipitation:
fc = owm.three_hours_forecast_at_coords(lat, lon)
rain = fc.will_have_rain()
snow = fc.will_have_snow()
rains = fc.when_rain()
At the output, we get an array of data with a list of rains and their intensity. Despite the name of the function three_hours_forecast_at_coords, the rains are registered 2-3 days in advance.
You can use GET requests directly, for example like this . This can come in handy, for example, when porting code to MicroPython under ESP.
Getting user coordinates
As can be seen above, latitude and longitude are needed to obtain data. Obtaining coordinates is also quite simple, and is done in 3 lines of code:
import geocoder
g = geocoder.ip('me')
lat = g.latlng[0]
lon = g.latlng[1]
UI
Actually, the hardest part. The Raspberry Pi uses an Adafruit TFT display that supports the ILI9340 command system. It’s easy to find libraries for it, but debugging code on the Raspberry Pi is not very convenient. As a result, it was decided to write a high-level set of controls, which needed only 3 - images, text and lines. When launched on Raspberry Pi, the control will draw itself on TFT, when launched on the desktop, the tkinter library built into Python will be used. As a result, the code will work everywhere - both on the Raspberry Pi, and on Windows, and on OSX.
The code for one control looks something like this:
class UIImage:
  def __init__(self, image = None, x = 0, y = 0, cId = 0):
    self.x = x
    self.y = y
    self.width = 0
    self.height = 0
    self.cId = cId
    self.tkID = None
    self.tftImage = None
    self.tkImage = None
    self.useTk = utils.isRaspberryPi() is False
    if image is not None:
        self.setImage(image)
  def setImage(self, image):
    width, height = image.size
    if self.useTk:
        self.tkImage = ImageTk.PhotoImage(image)
    self.tftImage = image
    self.width  = width
    self.height = height
  def draw(self, canvas = None, tft = None):
    if tft != None:
        tft.draw_img(self.tftImage, self.x, self.y, self.width, self.height)
    elif canvas != None and self.tkImage != None:
        if self.tkID == None or len(canvas.find_withtag(self.tkID)) == 0:
            self.tkID = canvas.create_image(self.x, self.y, image=self.tkImage , anchor=tkinter.NW)
        else:
            canvas.itemconfigure(self.tkID, image=self.tkImage)
The FakeTFT class creates a regular program window:
class FakeTFT:
    def __init__(self):
        self.tkRoot = tkinter.Tk()
        self.tkRoot.geometry("500x300")
        self.screenFrame = tkinter.Frame(self.tkRoot, width=330, height=250, bg="lightgray")
        self.screenFrame.place(x=250 - 330 / 2, y=5)
        self.tkScreenCanvas = tkinter.Canvas(self.tkRoot, bg = 'white', width = 320, height = 240, highlightthickness=0)
        self.tkScreenCanvas.focus_set()
        self.tkScreenCanvas.place(x=250 - 320 / 2, y=10)
        self.controls = []
    def draw(self):
          for c in self.controls:
              c.draw(self.tkScreenCanvas)
The LCDTFT class uses a “real” display (code snippet):
class LCDTFT:
    def __init__(self, spidev, dc_pin, rst_pin=0, led_pin=0, spi_speed=16000000):
        # CE is 0 or 1 for RPI, but is actual CE pin for virtGPIO
        # RST pin.  0  means soft reset (but reset pin still needs holding high (3V)
        # LED pin, may be tied to 3V (abt 14mA) or used on a 3V logic pin (abt 7mA)
        # and this object needs to be told the GPIO and SPIDEV objects to talk to
        global GPIO
        self.SPI = spidev
        self.SPI.open(0, 0)
        self.SPI.max_speed_hz = spi_speed
        self.RST = rst_pin
        self.DC = dc_pin
        self.LED = led_pin
        self.controls = []
    def draw(self):
          for c in self.controls:
              c.draw(tft = self)
During initialization, the desired display is automatically selected, depending on where the program starts:
def lcdInit():
  if utils.isRaspberryPi():
      GPIO.setwarnings(False)
      GPIO.setmode(GPIO.BCM)
      DC =  25
      LED = 18
      RST = 0
      return LCDTFT(spidev.SpiDev(), DC, RST, LED)
  else:
      return FakeTFT()
All this allows us to completely disengage from the hardware, and write code like this:
self.labelPressure = libTFT.UILabel("Pressure", 18,126, textColor=self.tft.BLACK, backColor=self.tft.WHITE, fontS = 7)
self.tft.controls.append(self.labelPressure)
self.labelRain = libTFT.UILabel("Rain", 270,126, textColor=self.tft.BLUE, backColor=self.tft.WHITE, fontS = 7)
self.tft.controls.append(self.labelRain)
Actually, the UI looks like this:
The current temperature is displayed on the screen, the atmospheric pressure graph for today (in the next version the temperature graph will be added), also in case of a rain forecast, its time is marked on the graph by a vertical blue line (there is no rain in this picture). The time of the last data update and IP address are also displayed if you need to connect to the device.
Those who want to get acquainted with the source in more detail can see it on guthub .
Install on Raspberry Pi
For those who do not want to bother with the above, a short installation guide under the spoiler.
Instruction manual
- Download the source from github:
git clone github.com/dmitryelj/RPi-Weather-Station.git
- If Python3 is not installed, put:
sudo apt-get install python3
- We install additional libraries (they are needed to work with the display):
sudo pip3 install numpy pillow spidev
- Add
python3 /home/pi/Documents/RPi-Weather-Station/weather.py &
- try to start
python3 weather.py
if everything works, then reboot ( sudo nano /etc/rc.local) sudo reboot) and use it.
In terms of adding something else useful, for example, displaying a cloud map, there is an API on openweathermap for this.
To be continued.