Genetics of the Romanesco variety: a fractal mathematical model of gene expression

What do snowflakes, Romanesco cabbage, starfish, lightning, and trees have in common? You can't tell right away, but from a mathematical point of view, all these objects have a common feature - fractality. In the eyes of mathematics, everything in our world is subject to the laws of the "queen of sciences." Any phenomenon, process or object can be expressed in mathematical form, which allows it to be analyzed from a new angle, so to speak. For many years, scientists have been trying to create an ideal mathematical representation of genes, their interconnections, and the processes in which they participate. Today we will talk about how fractals helped to lay the foundation for a completely new mathematical model of human genes from the perspective of cancer. What is a fractal, why is it so important for geneticists and mathematicians, and how can a new mathematical model help modern medicine? We will look for answers in the report of the research group. Go.
Theoretical retreat
To begin with, it is worthwhile to briefly figure out what a fractal is and what it is eaten with.
A fractal is a set with properties of self-similarity. Simply put, when something consists of several mini-copies of itself.
Fractals are found in various physical phenomena: from diffusion to turbulence. This can be called the natural manifestations of fractals. People also found the use of fractals: in computer graphics, radio engineering, network technologies, etc.
The fractals are very colorful in the film “Doctor Strange” (2016), when the Elder sends the main character on a tour of parallel measurements.

A slightly unpleasant sight, but clearly demonstrating the fractality.
Even on the shelves of the supermarket you can find manifestations of fractality, namely with the example of Romanesco cabbage or cauliflower.
If we take into account that there are quite a few types of sets with fractal properties, it can be argued that almost everything around us is in one way or another connected with fractals. And the human body, especially its genes, is no exception. Since fractals can be mathematically explained by laying out the components, the application of such a model on human genes can significantly help in understanding the various processes occurring in our body, including various diseases, pathologies and other unpleasant things.
One of the most important processes in our body is gene expression (image 1a) when the genetic information of the genes is converted into a functional product. In other words, our cells control their structure and function through gene expression. Our genes are a database from which all the cells of the body derive information, performing the necessary functions later. Because we do not grow hair in the mouth, the immune system fights infections, blood cells transport oxygen, etc. All these processes take place precisely by programming the cells to perform specific tasks, which in turn is possible through protein synthesis from the activation of a specific gene.
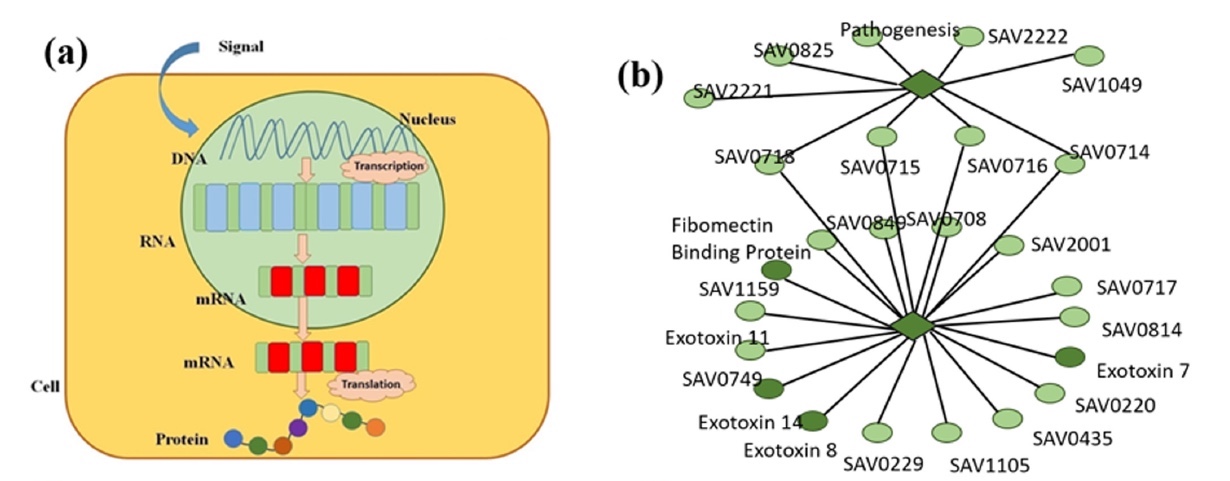
Image number 1
Regulation of gene expression indicates when, how long and how long certain proteins should be produced. Therefore, the study of this process is of great importance for a complete understanding of how certain mechanisms of control of organisms work.
This complex process is important for scientists because, given the opportunity to manage it, they will be able to create certain synthetic cells endowed with clear functions, in particular, delivering a cure for cancer to the very heart of the disease for more effective treatment.
In order to improve the methods of treatment of such diseases, it is necessary to learn more about the genetic aspect. To do this, scientists propose to present the human body as a program where genes act as lines of code that can be changed if the program works with a crash. To do this, you first need to create a mathematical model of the gene. At the moment, such models already exist, but they cannot be representative due to the fact that they were aimed at studying the dynamics in the network of genes. In this study, which applied the concept of fractals, the scientists decided to focus on the process of expression of a specific gene, and then apply a mutual correlation between pairs of gene FT * ( 1b ).
The transcription factor (FT) * is a protein controlling the synthesis of mRNA, containing information about the primary structure of proteins on the DNA matrix by linking to specific sections of DNA.Simply put, scientists decided to dig a little deeper, having considered not the whole “wall”, but separate “bricks”.
Results of the study
The fungus Saccharomyces cerevisiae (baker's yeast) and the bacterium Escherichia coli (Escherichia coli) acted as test subjects in this study.
By analyzing the statistical data on the genetic expression of the experimental subjects, the Hurst coefficient was calculated * .
Hurst coefficient * is a measure of time series analysis.
Time series * - a set of statistical data collected in different time intervals, about any indicator.
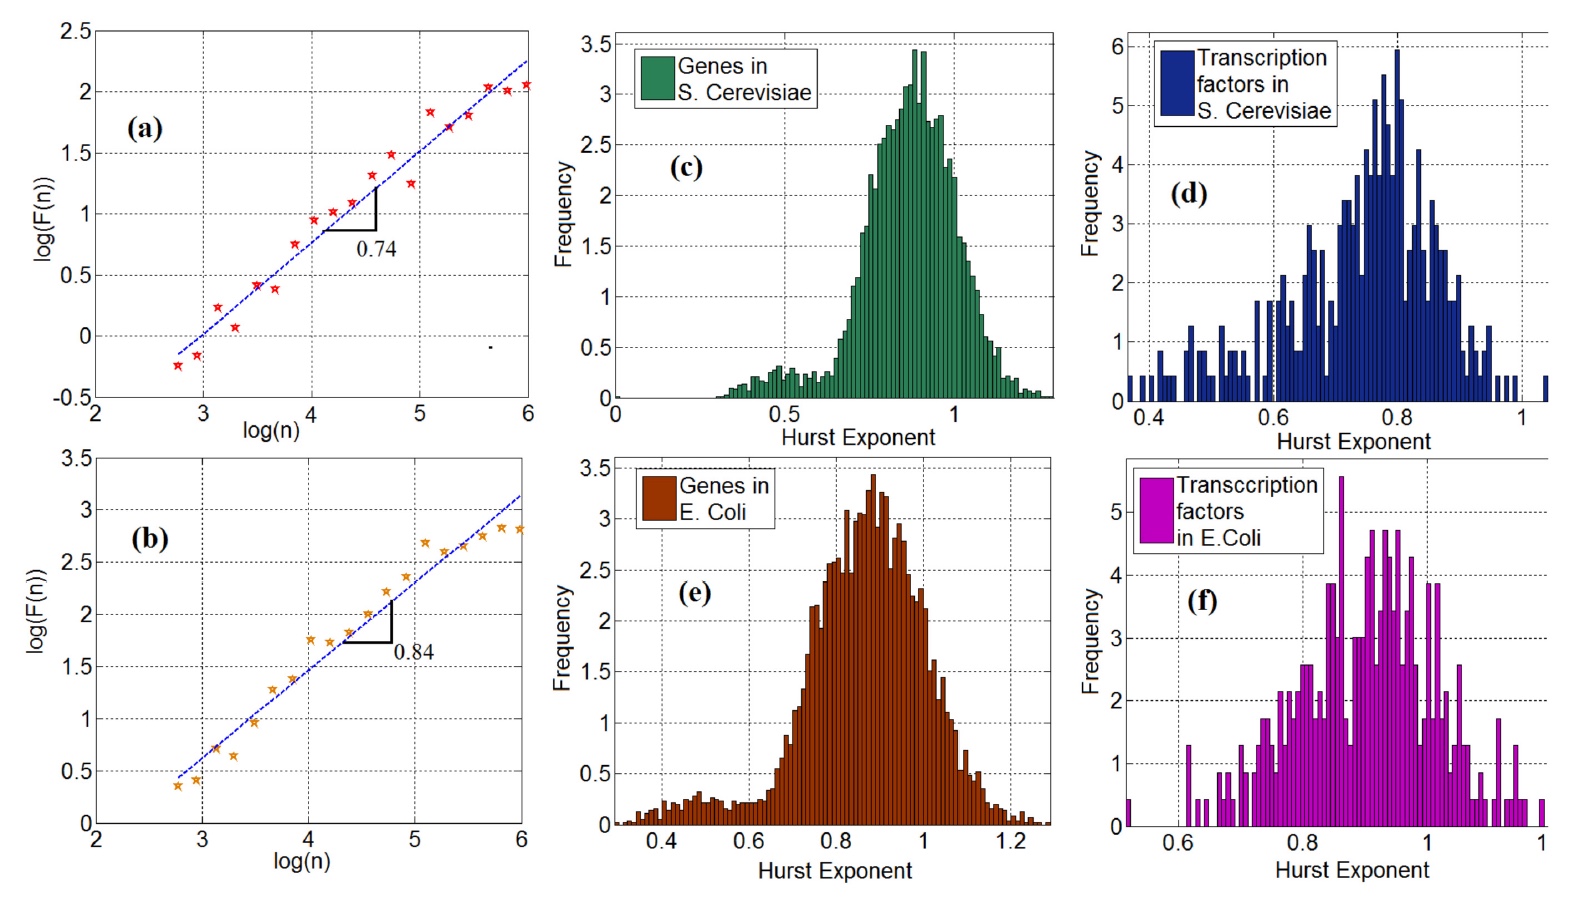
Image No. 2
On images 2a (yeast) and 2b (Escherichia coli) there are shown log-logarithmic * fluctuations, as a function of the scale of time series FT.
The bilogarithmic graph * is a two-dimensional graph of data using a logarithmic scale on both axes (vertical and horizontal).The slope of the curve in these graphs corresponds to the Hurst coefficient. It is worth noting that 95% (yeast) and 98% (bacillus) gene time series showed a long-term dependence * .
Long-term dependence * is an indicator in the analysis of time series, denoting the slow attenuation of the statistical dependence of two points with an increase in the time interval between them. It is determined by the Hurst coefficient indicator - from 0 to 1. If the indicator is above 0.5, then we have a strong long-term dependence, below 0.5 - the opposite effect.The Hurst coefficient of long-term dependence in this particular case was 0.5, which indicates its absence, in theory. However, further analysis of the data showed that this indicator exceeds the value of 0.5, which indicates the presence of a long-term dependence of the time series in genetic expression ( 2c and 2e ). This suggests that the time series of gene-FT cannot be considered as random, therefore they should be modeled on the basis of a Markov chain, when there is a series of events, the randomness of each of which depends solely on the previous event.
Like genes, transcription factors also showed a long-term dependence: in 97% for yeast and for sticks (graphs 2d and 2f ).
And now add a pinch of fractal analysis to the common cup. To begin with, scientists draw our attention to the bimodality of the distribution of the Hirst coefficient. This is best seen in graphs 2c and 2e. Scientists explain this observation by the fact that there are diffusion processes in gene expression that have several diffusion potentials. Therefore, bimodality can be explained by non-equilibrium Brownian motion with different potentials. But this statement requires additional evidence, which scientists will look for in the following studies.
And now we will return to the multifractality. Scientists used multifractal analysis of detrend fluctuations to determine the presence / absence of multifractal characteristics in time series of gene expression. This analysis showed the presence of such as genes, and in FT.
The scientists also applied the bootstrap method * to accurately determine (more precisely, to confirm) the presence of a long-term dependence, given the limited lengths of the experimental time series.
Bootstrap * - a technique for analyzing statistics of probability distributions.For each time series of gene expression, 10 random sub-intervals were prepared, each of which contained 90% of the ordered fragment of the original time series. Further, for all options, the Hirst coefficient was calculated. Thus, the difference between the experimental time series and random versions was obtained. For E. coli, the difference was only 0.006%, and for Baker's yeast, even less - 0.0001%. Thus, the presence of long-term dependence in both samples was confirmed.
After examining the characteristics of the gene and FT separately, the scientists began to analyze gene-FT pairs as a single object. The calculation of the cross-correlation indicator showed that 98% of the gene-TF pairs (in both samples) have the properties of a long-term dependence ( 3a ).
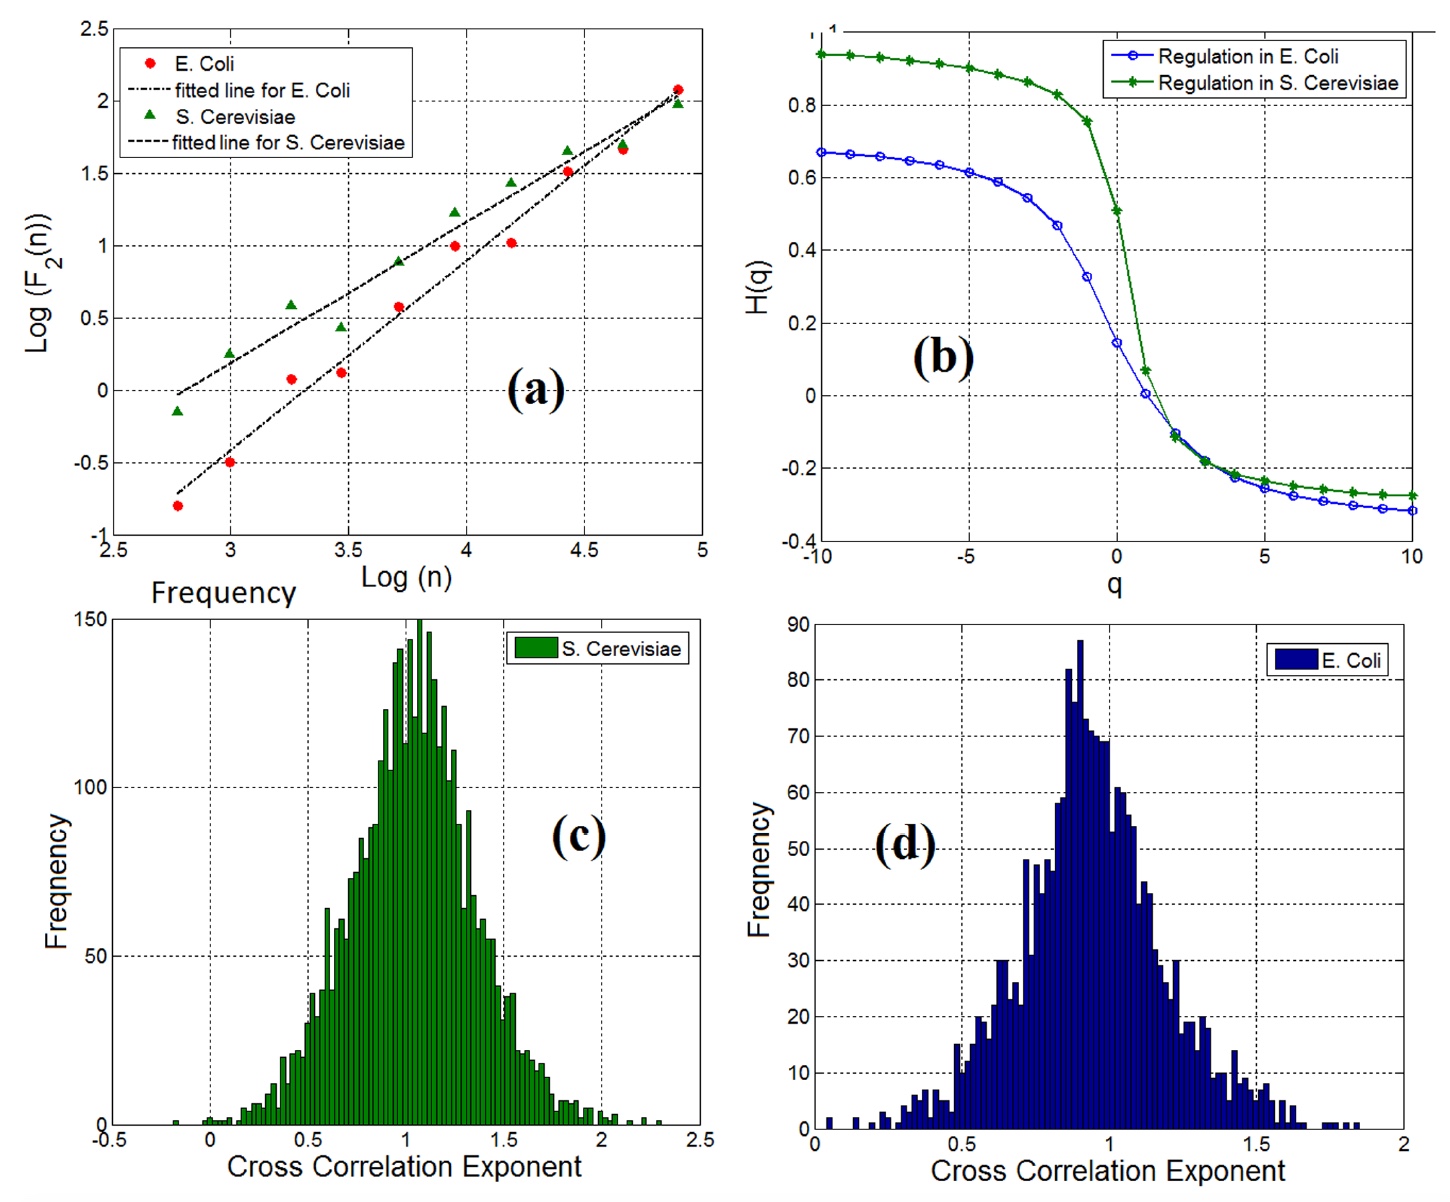
Image No. 3
Multifractal analysis of detrend fluctuations confirmed the presence of multifractal features in gene-TF pairs (graph 3b ).
It is worth noting that regardless of the fact that both fractal and long-term mutual correlation in pairs of genes and transcription factors were observed in gene regulation networks, the mutual correlation was not the same for all pairs. The 3c (yeast) and 3d (Escherichia coli) plots show the cross-correlation index of gene-FT pairs.
Scientists used these graphs to measure informational entropy and, as a result, the informational content of the gene regulation network for various cell types for quantitative analysis and specification of gene regulation networks. The entropy indices were: 4.18 - yeast, 5.29 - E. coli. This suggests that the network of gene expression in Baker's yeast is much larger and shows a more complex dynamics than the network of gene expression in Escherichia coli.
And now the most interesting is the creation of a mathematical model. Scientists have chosen two versions of the model: the Mandelbrot set and the set in the form of wavelet dyadic trees.
Using the previously obtained indicators of the Hölder coefficient in the multifractal spectrum, scientists found that only 0.04 of all gene-TF pairs in the Baker's yeast gene regulation network can be modeled using multiple Mandelbrot. And in E. coli in general, not a single pair can be modeled by this method.
If we consider those pairs that we managed to model, we observed a huge discrepancy in the data between the model and the experimental observations. As a conclusion - the simulation method due to the Mandelbrot set does not fit.
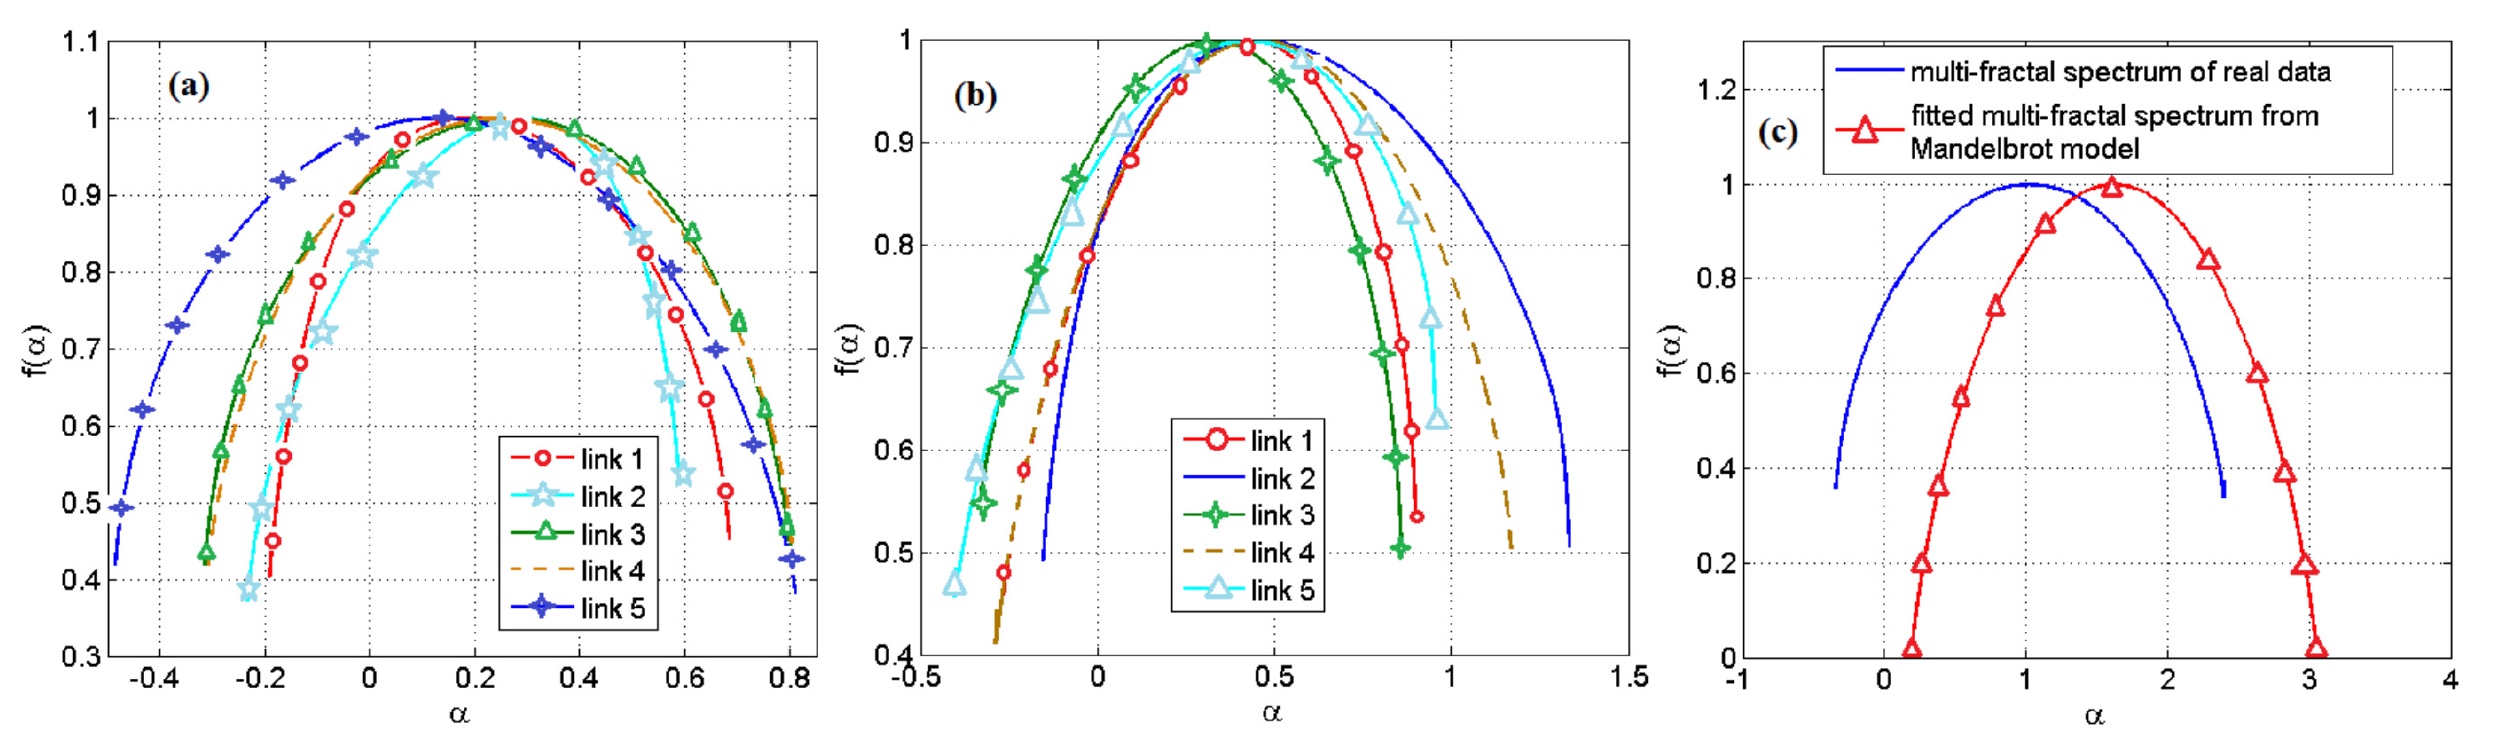
Image No. 4
The results of using the model based on the Mandelbrot set are shown in the graphs above. The brightest is 4c , where we can see how much the data diverges.
The scientists also compared the observed multifractality of interdependencies in the gene regulation network and the multifractal model of random cascades on wavelet-dyadic trees.
The researchers decided to check whether the logarithmic model of the W-cascade is suitable for the representation of gene-FT pairs in gene regulation networks. On the basis of the empirical spectrum and the spectrum of singularities, the parameters of this model were calculated. Next, calculations were made of the intersection regions of the calculated and empirical multifractal spectra, the ratio of which became the main criterion for accepting or rejecting this mathematical multifractal model.
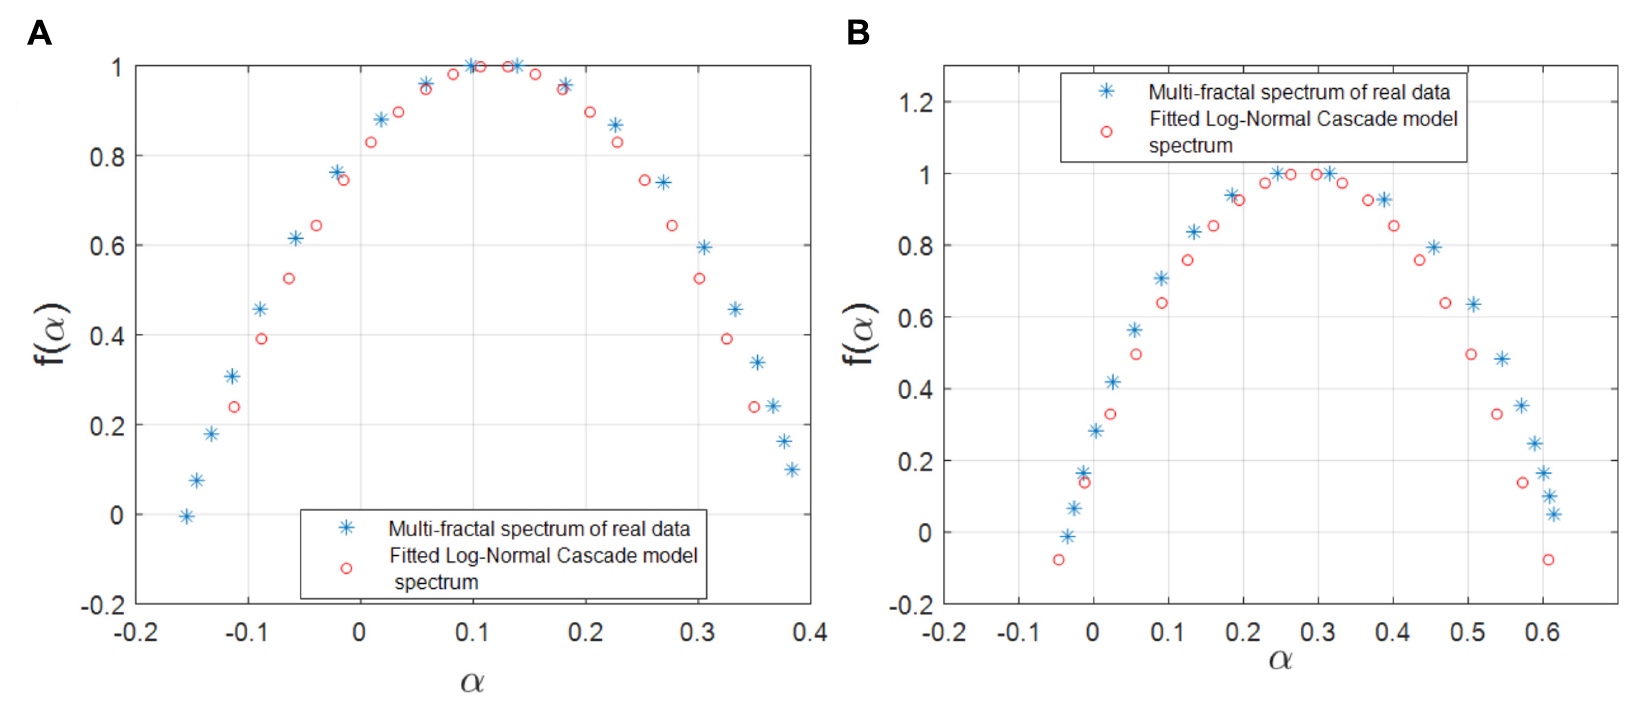
Image number 5
As can be seen from the graphs above, demonstrating simulated and empirical multifractal spectra, this model is almost completely correlated with the data of observations and calculations carried out earlier.
For more detailed acquaintance with the nuances of the study I recommend to look into the report of the research group at this link .
Epilogue
This research, being largely theoretical, has great potential for practical application, since it helped mathematically simulate a network of regulation of gene expression — one of the most important processes in any living organism. Complex processes are difficult to understand, however strange it may sound. In order to facilitate the task, it is necessary to divide the process into components, draw up their "maps", and follow the desired route, noting all the important features and characteristics. Mathematical modeling like nothing else is great for this. Having studied the mathematical model of an object or process, we can understand what we are dealing with before embarking on the investigation of an actual object or process.
This study once again confirmed that not only physics and chemistry rule the world, but mathematics is not the last place on the Olympus of Sciences.
Thank you for your attention, remain curious and have a great work week for you guys.
Thank you for staying with us. Do you like our articles? Want to see more interesting materials? Support us by placing an order or recommending to friends, 30% discount for Habr users on a unique analogue of the entry-level servers that we invented for you: The whole truth about VPS (KVM) E5-2650 v4 (6 Cores) 10GB DDR4 240GB SSD 1Gbps from $ 20 or how to share the server? (Options are available with RAID1 and RAID10, up to 24 cores and up to 40GB DDR4).
VPS (KVM) E5-2650 v4 (6 Cores) 10GB DDR4 240GB SSD 1Gbps until January 1 for free if you pay for a period of six months, you can order here .
Dell R730xd 2 times cheaper? Only we have 2 x Intel Dodeca-Core Xeon E5-2650v4 128GB DDR4 6x480GB SSD 1Gbps 100 TV from $ 249 in the Netherlands and the USA! Read about How to build an infrastructure building. class c using servers Dell R730xd E5-2650 v4 worth 9000 euros for a penny?