Debugging React Applications in VS Code
- Transfer

Gone are the days when, in the development process, I had to spend time switching between the terminal, browser and editor. Now everything is done differently - faster and more convenient. Today I’ll talk about optimizing the daily activities of a React developer. Namely, we will talk about how to connect Visual Studio Code and Google Chrome. This will make it possible to debug browser code in the editor. Facebook Code Debugging Tools VS jest
Test project setup
Before we begin to master React debugging in VS Code, we will create a training application with which we will experiment. I often use create-react-app , because I really don’t like manually creating empty projects. Therefore, I propose to use it in this guide. Alternatively, if you already have an application, you can use it.
So, create a test project. To do this, do the following:
- Install
create-react-appglobally by running the commandnpm i -g create-react-app. - After installation, create the project with the command
create-react-app vscode-tutorial.
As a result, you should have a new folder with the React application.
Configure VS Code
Now install the VS Code extension, which will allow the editor to interact with Chrome. VS Code connects to Chome using the remote debugging protocol . This is the same protocol that Chrome Developer Tools use. But thanks to this approach, instead of working with standard Chrome tools, you can use VS Code to debug browser code.
Installing the Debugger for Chrome Extension
So, in order to establish the interaction of VS Code and Chrome, you need to install the extension, which is called
Debugger for Chrome. To install it, go to the extensions panel and search for the name of the extension. The result should look something like this: 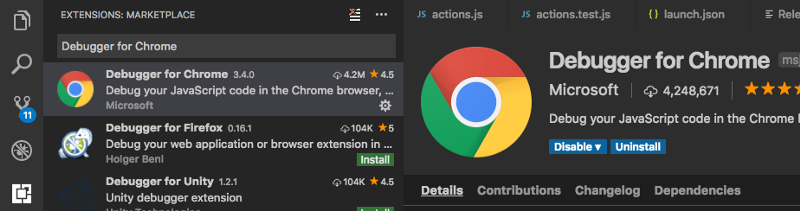
Search for the Debugger for Chrome extension
Connect VS Code to Chrome
Next, you need to configure VS Code to connect to Chrome. It is done like this:
- Click on the debug icon.
- Open the drop-down menu (near the button
Play) and select the itemAdd Configuration…. - In the drop-down list,
Select EnvironmentselectChrome.
If you are confused - this is how it all looks
Configuring VS Code and Chrome communication
A folder will be automatically added to the project root
.vscode. It will contain the file launch.jsonthat is used to configure the VS Code debugger for the current project. Each time you create a new project, you need to perform the same sequence of actions to configure remote debugging (you can still just copy the folder .vscodefrom one project to another). Modify the property in this file
urlso that it points to the server used during development. For create-react-appthat http://localhost:3000. As a result, your launch.jsonshould look like this (thanks to Kenneth Auchenberg from the VS Code team for advice on working with this file):{
"version": "0.2.0",
"configurations": [
{
"name": "Chrome",
"type": "chrome",
"request": "launch",
"url": "http://localhost:3000",
"webRoot": "${workspaceRoot}"
}
]
}A complete list of configuration options can be found here .
Using a debugger
Now almost everything is ready to go. The next step is to use a test project in order to test the debugger.
Debugger launch
You can start the debugger by doing one of the following:
- To click
F5. - Click the green button
Playon the debug panel. - Select a menu command
Debug → Start Debugger.
If the debugger starts up successfully, you will see how a small toolbar appears at the top of the VS Code window:
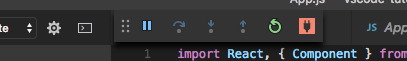
Toolbar that appears when you turn on the debugger
Setting a breakpoint
Breakpoints are used to tell the debugger that it needs to pause code execution at a specific location. This allows the programmer to examine the variables, the call stack and make changes to the code during the execution of the application.
Set a breakpoint in the test application. Open the file
src/App.jsand click on the field to the left of the line 11. A red dot should appear here, which indicates that a breakpoint has been added. Here, to make it clear, an animated version of this instruction:
Setting a breakpoint
Development Server Launch
And finally, in order to see how all this works, you need to start the development server by running a command
npm startin the terminal. This command will start a new server, available at http://localhost:3000/.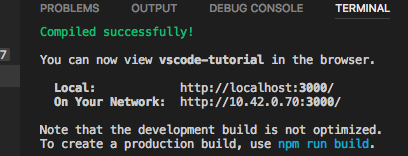
Starting the server
Go to the address
http://localhost:3000/and you will see how the page "freezes". This is due to the breakpoint being triggered. If you switch to VS Code, you will notice that the line 11will be highlighted, and the call stack information will appear in the debug panel.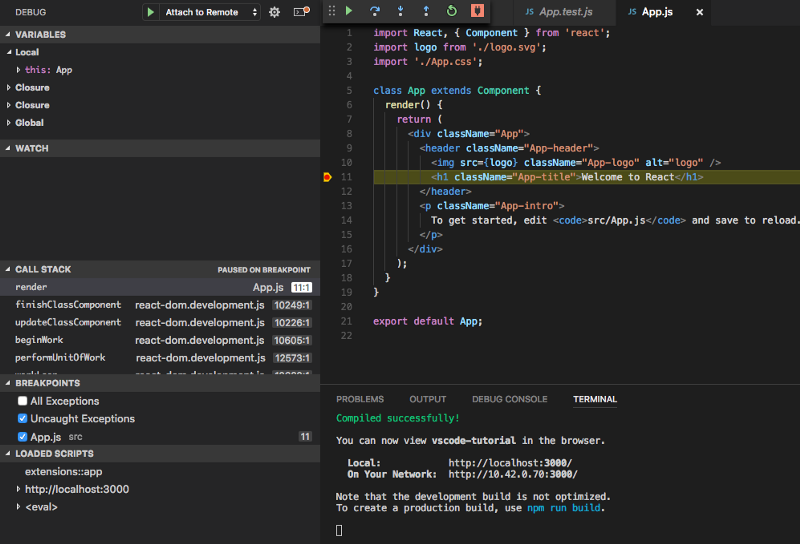
Breakpoint triggered
If everything worked for you - congratulations! You just learned how to configure remote debugging in VS Code. If you want to know more about the debugging process in VS Code, read this .
Continuous testing with jest
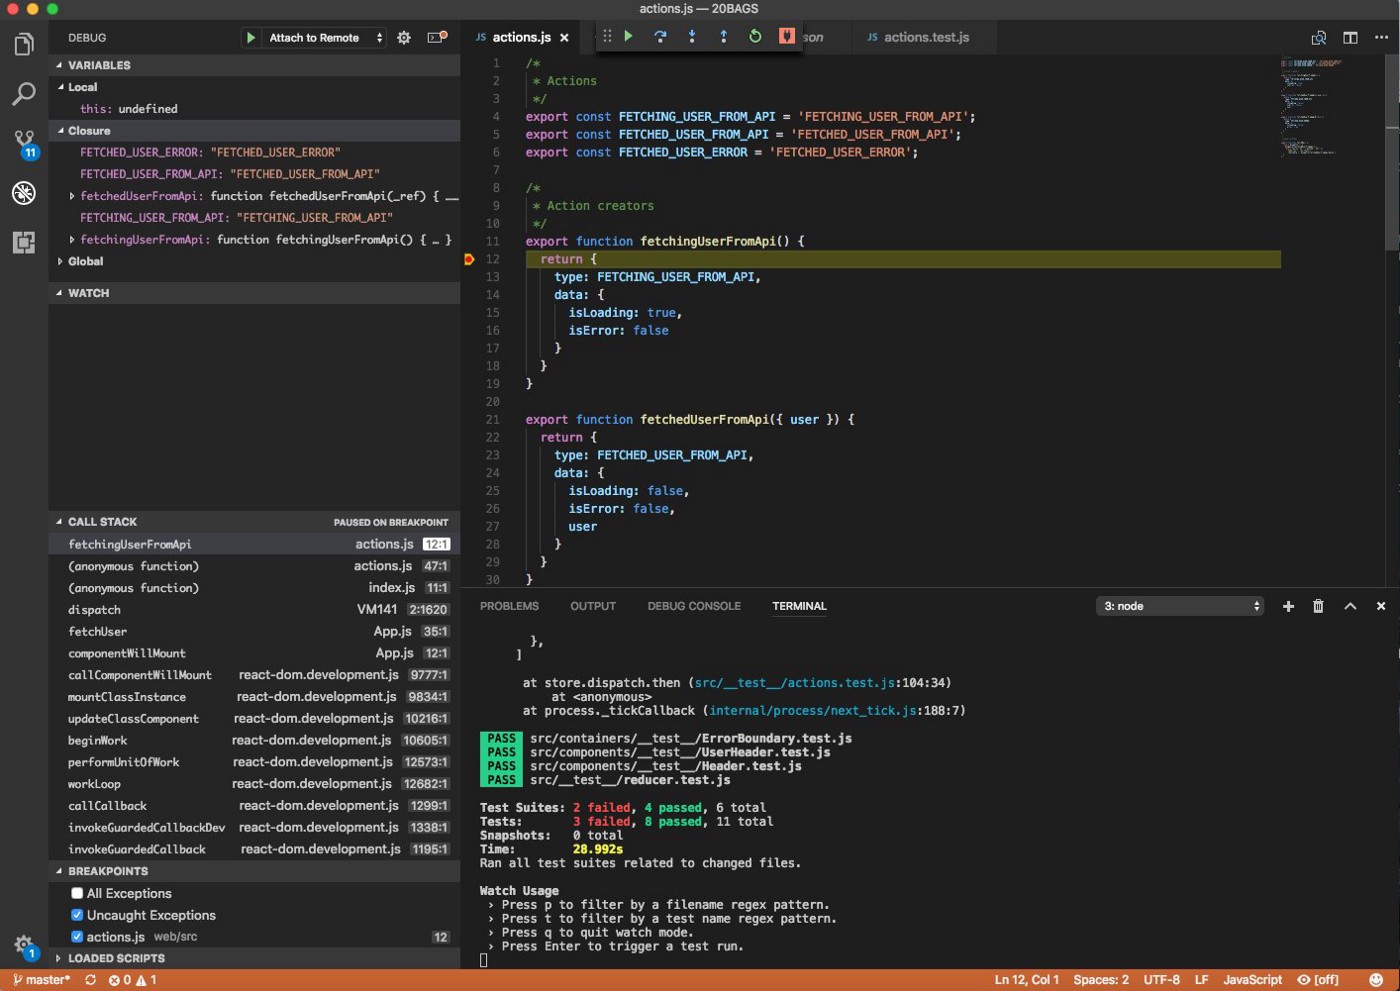
It’s convenient for me to run unit tests while working on the code. Namely, that they are called whenever I make changes to the program. Thanks to
create-react-appeverything you need to implement such a scenario, it is configured automatically. In order to start jest, just enter the command in the terminal npm test. Thanks to this, the system will monitor the files and automatically run tests when they are saved. It looks something like this: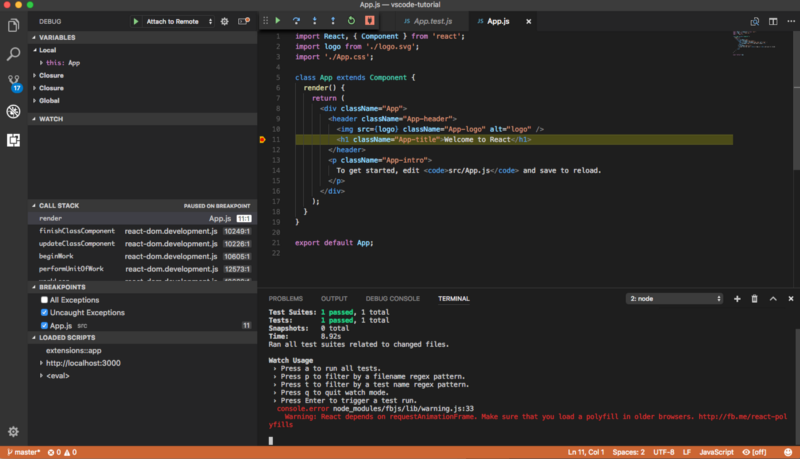
Continuous testing in VS Code
Summary
In this article, we talked about how to configure the interaction of VS Code and Chrome for organizing remote debugging of React applications. We hope this simple technique will save you a little time, if earlier you had to constantly switch between the editor, browser and terminal.
Dear readers! Do you use any useful little things that increase productivity when developing web applications?