Lower bones? Easy
Good afternoon, I am developing a demand forecasting service based on Microsoft Azure, Spark Apache in an IT company. In a series of articles I will talk about real business cases from Russian realities that an IT company is faced with. Basically, the articles will be about business: there is a client, there are his tasks, you need to find a way to solve them and prove to the management of the adequacy of the calculations, then the introduction.
This article is informative in nature: I will not describe in detail the calculation algorithms and our models, however, I will tell the logic on which the entire mathematical part is based.
The company wants to understand how much loss it has (very cool when the company immediately knows what it wants), and how to reduce them.

The goal is set. Now a little about the company: Federal network of 400 retail stores. We agreed to carry out a pilot version of the project with one product category - 20 sku, the average shelf life of the product is 15 days.
The structure of the operation is as follows:
Everything seems to be simple. You need to understand that optimization can be implemented in business processes (changing the delivery schedule, accounting for traffic jams ...) and an IT solution based on the introduction of new technologies that give business value. In the latter case, the company does not need to make major changes, such as retraining personnel, changing the structure of work, updating the infrastructure. In this article I will talk only about IT solutions.
For example, the delay in the unit of each sku per day does not seem significant when analyzing a small group of 20 sku. However, let's calculate the monthly net loss:
31 (days) * 400 (stores) * 20 (number of sku) * 1 = 240,000 units.
Let the average purchase price be 30 rubles, that is, 7.2 million rubles per month in net losses. It would seem that only 1 unit of goods per day, a unit of millions saves.
At the first stage of the analysis of the company, we will take into account under-sales of the company and expired goods under losses. It remains to understand how to count them. In this project, we were very lucky, because the client had statistics on expired goods, otherwise they would have to be artificially modeled.
Under the underselling, we will consider the situation when OOS (out of stock) is observed, that is, we have to simulate the situation in the spirit of "what would happen if the company had enough balances to satisfy customer demand." The customer data has balances in the context of Shop-Sku-Day, which is good. It is worth noting that the balances are considered at the end of the working day.
Given the above logic, you need to find days, taking into account the goods on the way, in which the balances were zero, and replace the sale on this day with the average for the last week. Note that if there were no sales in fact on such a day, then we consider under-sale the average sale over the last 7 days, otherwise under-sale = weekly average - the fact of sale.
In fact, sales data tell us about the part of the demand that we managed to satisfy, but this is not the initial demand of customers.
Purification from OOS and some other procedures that purify data, for example, from such a situation: if there is no Coca-Cola on the shelf, some buyers will buy Pepsi; allow you to get real demand from the buyer.
Super! We got the dynamics of undersales in the context of Shop-Sku-Day and real demand from the buyer. The only thing left is small: to translate everything into money - multiply undersales by margin, and late payments by purchase price. I will say that in this company the total losses were 6.6 million rubles per month — about 8% of the turnover of this sku group. All calculations were carried out on real customer data, the results are completely true. In Russia, unfortunately, few people pay close attention to the analysis of losses, so losses account for such a large percentage of the turnover in many companies.
The first steps are completed. You can report to the management that you have a loss of 6.6 million! To which we get a very logical answer - So what? Offer a solution and justify its economy!

OK, you need to figure out how to lower the bones. One of our IT solutions to such problems is a cloud-based sales forecasting service based on Microsoft Azure. This solution does not require significant costs for its implementation and integration into the business. In addition, the service uses cloud technology, which allows not to load the client’s power.
The company predicted sales based on a moving average + safety stock, and the service has more serious forecasting methods (more about them later). I note that the company had an average forecasting accuracy of about 50%, and our service on the three-year customer data shows an accuracy of 70%.
Daily accuracy is calculated by the following formula:
If you need to aggregate, then consider it as a weighted average.
The most important part of the project is to show the real profit from our product. I note that, of course, the accuracy of the forecast gives benefits, however, each company is different. This is due to their business processes, for example, the delivery schedule does not allow you to place an order today, the order multiplicity - the number of yoghurts must be a multiple of 24, or the minimum order must be 100 pieces. Therefore, it is necessary to simulate the entire system from the inside: we take the customer’s supply schedule, order conditions, delivery shoulders and the necessary traffic load. And already in this environment, we model losses at different accuracy to show the real business value.
We must simulate customer balances, product deliveries, sales, expired products, laying down different forecast accuracy.
So, we built a model in which the following prerequisites were laid:
Dependence of losses on forecasting accuracy:
Now it is clearly visible that with an accuracy of about 70%, savings will be approximately 1.2 million rubles per month, which is not bad, given that the pilot version was built on a group of 20 sku.
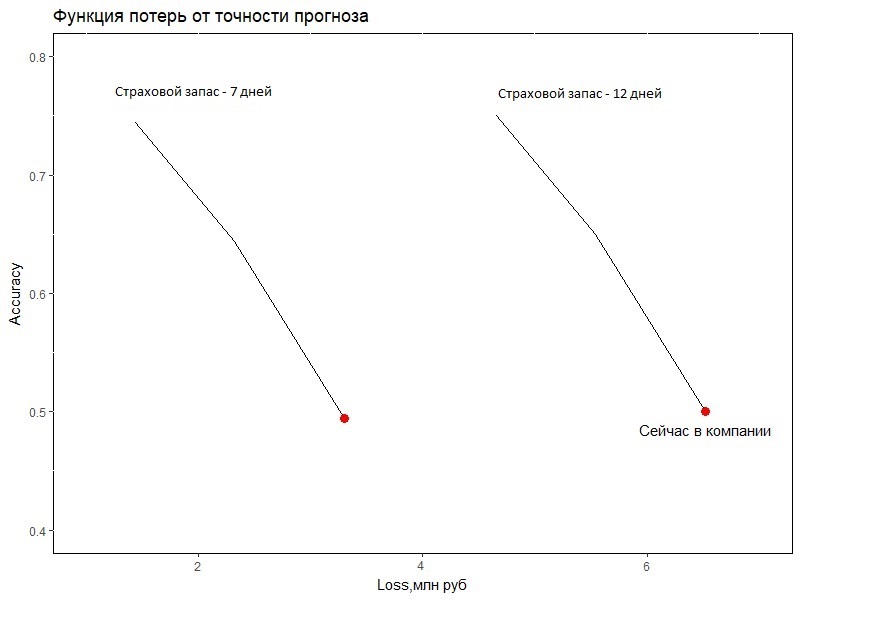
An interesting point arises: the client has a 12-day insurance stock, however, having a good forecast, it can be reduced and additional benefits can be obtained. When modeling, all the initial data of the system does not change, except for the safety stock, which allows, without reducing the level of service for the buyer, to reduce cost. In addition, I note that all simulated orders are consistent with the customer's delivery schedule, and the order conditions are observed, that is, the simulated system is fully consistent with the company's business processes.
A graph is the best tool to prove:

Now, with an accuracy of 70%, savings will amount to 4.6 million rubles per month! This result is obviously very cool. It is amazing how the introduction of a forecasting service can save customers money in the amount of 4.6 million rubles per month for only 20 sku!

Thus, with the help of IT solutions, we were able to save the client 4.6 million rubles per month on the pilot version. Now we have taken into development the remaining product groups for analysis and identification of the profit that our cloud forecasting service will provide.
Hope the article was helpful. The next article will detail the work of our service.
I will be glad to answer your questions.
Thanks for attention.
This article is informative in nature: I will not describe in detail the calculation algorithms and our models, however, I will tell the logic on which the entire mathematical part is based.
The first business case
The company wants to understand how much loss it has (very cool when the company immediately knows what it wants), and how to reduce them.
The goal is set. Now a little about the company: Federal network of 400 retail stores. We agreed to carry out a pilot version of the project with one product category - 20 sku, the average shelf life of the product is 15 days.
The structure of the operation is as follows:
- Analysis of the company. At this stage, the company's business processes are analyzed: replenishment systems, supply schedule, and balances.
- At the second stage, you need to understand what is considered a “loss”, where it comes from, how to estimate the amount of losses, etc. A bunch of open-ended questions.
- Suggest a solution to reduce losses.
Everything seems to be simple. You need to understand that optimization can be implemented in business processes (changing the delivery schedule, accounting for traffic jams ...) and an IT solution based on the introduction of new technologies that give business value. In the latter case, the company does not need to make major changes, such as retraining personnel, changing the structure of work, updating the infrastructure. In this article I will talk only about IT solutions.
A bit about saving in large companies
For example, the delay in the unit of each sku per day does not seem significant when analyzing a small group of 20 sku. However, let's calculate the monthly net loss:
31 (days) * 400 (stores) * 20 (number of sku) * 1 = 240,000 units.
Let the average purchase price be 30 rubles, that is, 7.2 million rubles per month in net losses. It would seem that only 1 unit of goods per day, a unit of millions saves.
At the first stage of the analysis of the company, we will take into account under-sales of the company and expired goods under losses. It remains to understand how to count them. In this project, we were very lucky, because the client had statistics on expired goods, otherwise they would have to be artificially modeled.
Let's try to deal with undersales
Under the underselling, we will consider the situation when OOS (out of stock) is observed, that is, we have to simulate the situation in the spirit of "what would happen if the company had enough balances to satisfy customer demand." The customer data has balances in the context of Shop-Sku-Day, which is good. It is worth noting that the balances are considered at the end of the working day.
Given the above logic, you need to find days, taking into account the goods on the way, in which the balances were zero, and replace the sale on this day with the average for the last week. Note that if there were no sales in fact on such a day, then we consider under-sale the average sale over the last 7 days, otherwise under-sale = weekly average - the fact of sale.
In fact, sales data tell us about the part of the demand that we managed to satisfy, but this is not the initial demand of customers.
Purification from OOS and some other procedures that purify data, for example, from such a situation: if there is no Coca-Cola on the shelf, some buyers will buy Pepsi; allow you to get real demand from the buyer.
Super! We got the dynamics of undersales in the context of Shop-Sku-Day and real demand from the buyer. The only thing left is small: to translate everything into money - multiply undersales by margin, and late payments by purchase price. I will say that in this company the total losses were 6.6 million rubles per month — about 8% of the turnover of this sku group. All calculations were carried out on real customer data, the results are completely true. In Russia, unfortunately, few people pay close attention to the analysis of losses, so losses account for such a large percentage of the turnover in many companies.
The first steps are completed. You can report to the management that you have a loss of 6.6 million! To which we get a very logical answer - So what? Offer a solution and justify its economy!
OK, you need to figure out how to lower the bones. One of our IT solutions to such problems is a cloud-based sales forecasting service based on Microsoft Azure. This solution does not require significant costs for its implementation and integration into the business. In addition, the service uses cloud technology, which allows not to load the client’s power.
The company predicted sales based on a moving average + safety stock, and the service has more serious forecasting methods (more about them later). I note that the company had an average forecasting accuracy of about 50%, and our service on the three-year customer data shows an accuracy of 70%.
Daily accuracy is calculated by the following formula:

If you need to aggregate, then consider it as a weighted average.
What is the profit from the forecast?
The logic is as follows: the more accurately we predict, the more optimally we build a system of product orders and the higher the customer service (absence of empty shelves) and the less expired products.
The most important part of the project is to show the real profit from our product. I note that, of course, the accuracy of the forecast gives benefits, however, each company is different. This is due to their business processes, for example, the delivery schedule does not allow you to place an order today, the order multiplicity - the number of yoghurts must be a multiple of 24, or the minimum order must be 100 pieces. Therefore, it is necessary to simulate the entire system from the inside: we take the customer’s supply schedule, order conditions, delivery shoulders and the necessary traffic load. And already in this environment, we model losses at different accuracy to show the real business value.
We must simulate customer balances, product deliveries, sales, expired products, laying down different forecast accuracy.
So, we built a model in which the following prerequisites were laid:
- The model includes a probabilistic part: buyers are more likely to buy a fresher product than a "long-lying" one.
- In the simulation, the restored demand function was used: actual sales were cleared of OOS and the effect of substitute goods.
- Balances and deliveries were modeled taking into account schedules, delivery times, order conditions.
- The costs of underselling were calculated as the difference between (demand and model sales) * margin.
- Defective expenses were calculated as the sum of all expired goods in monetary terms, and purchase prices were used.
Dependence of losses on forecasting accuracy:
Now it is clearly visible that with an accuracy of about 70%, savings will be approximately 1.2 million rubles per month, which is not bad, given that the pilot version was built on a group of 20 sku.
An interesting point arises: the client has a 12-day insurance stock, however, having a good forecast, it can be reduced and additional benefits can be obtained. When modeling, all the initial data of the system does not change, except for the safety stock, which allows, without reducing the level of service for the buyer, to reduce cost. In addition, I note that all simulated orders are consistent with the customer's delivery schedule, and the order conditions are observed, that is, the simulated system is fully consistent with the company's business processes.
A graph is the best tool to prove:
Now, with an accuracy of 70%, savings will amount to 4.6 million rubles per month! This result is obviously very cool. It is amazing how the introduction of a forecasting service can save customers money in the amount of 4.6 million rubles per month for only 20 sku!
conclusions
Thus, with the help of IT solutions, we were able to save the client 4.6 million rubles per month on the pilot version. Now we have taken into development the remaining product groups for analysis and identification of the profit that our cloud forecasting service will provide.
Hope the article was helpful. The next article will detail the work of our service.
I will be glad to answer your questions.
Thanks for attention.