Machine Learning at RapidMiner
- Tutorial

Dmitry Sobolev, Igor Masternaya, Rafael Zubairov
It’s simply impossible not to notice how quickly the total volume of collected metrics is growing. Not only the frequency with which automatic systems collect data, the throughput of data warehouses, but also the set of metrics that we can use is increasing. This trend is most pronounced in IoT, but other industries also boast a huge set of data sources - public or accessible by special subscription.
The increase in data volume creates new challenges for analysts and professionals working to optimize business tasks. The pace of development of the global economy is increasing, but it is precisely the quick reaction to changes at the micro level that allows individual companies to expand. And here data analysis and machine learning tools come to the rescue.
In the 2000s, machine learning and in-depth data analysis were the destiny of university groups and specialized startups. Today, any company has access to almost unlimited algorithms, approaches and turnkey solutions for creating automatic systems, as well as a whole set of products for data analysis.
Machine learning is now used not only by Microsoft and Google corporations, even small companies can take advantage of the high-quality data analysis or recommendation system. If until recently the use of such methods required the hiring of programmers, analysts, data scientists, now services and applications for machine learning are appearing on the market, which allow us to process data and build predictive models in a more friendly form using the graphical interface. Even a person with minimal knowledge in this area is able to use them.
Now the top three in automated and simplified machine learning consists of DataRobot, RapidMiner and BigMl. In this article we will take a closer look at RapidMiner - we will talk about what he can do and how he can make your life easier.
Rapidmainer
It is critically important for any business to evaluate the “work force” indicator in separate time periods. This allows you to plan business projects that are always largely tied to human resources. An additional risk factor may be seasonal outbreaks of colds: every year in winter a decent percentage of employees are on sick leave. As a result, the project completion dates are postponed, and any company, of course, would like to avoid such shifts. Machine learning can help.
With RapidMiner, we will analyze data on colds and build a model that can predict outbreaks of disease. Based on the results of the forecast, the company will be able to take measures in advance and avoid losses.
Let's get acquainted with the program:
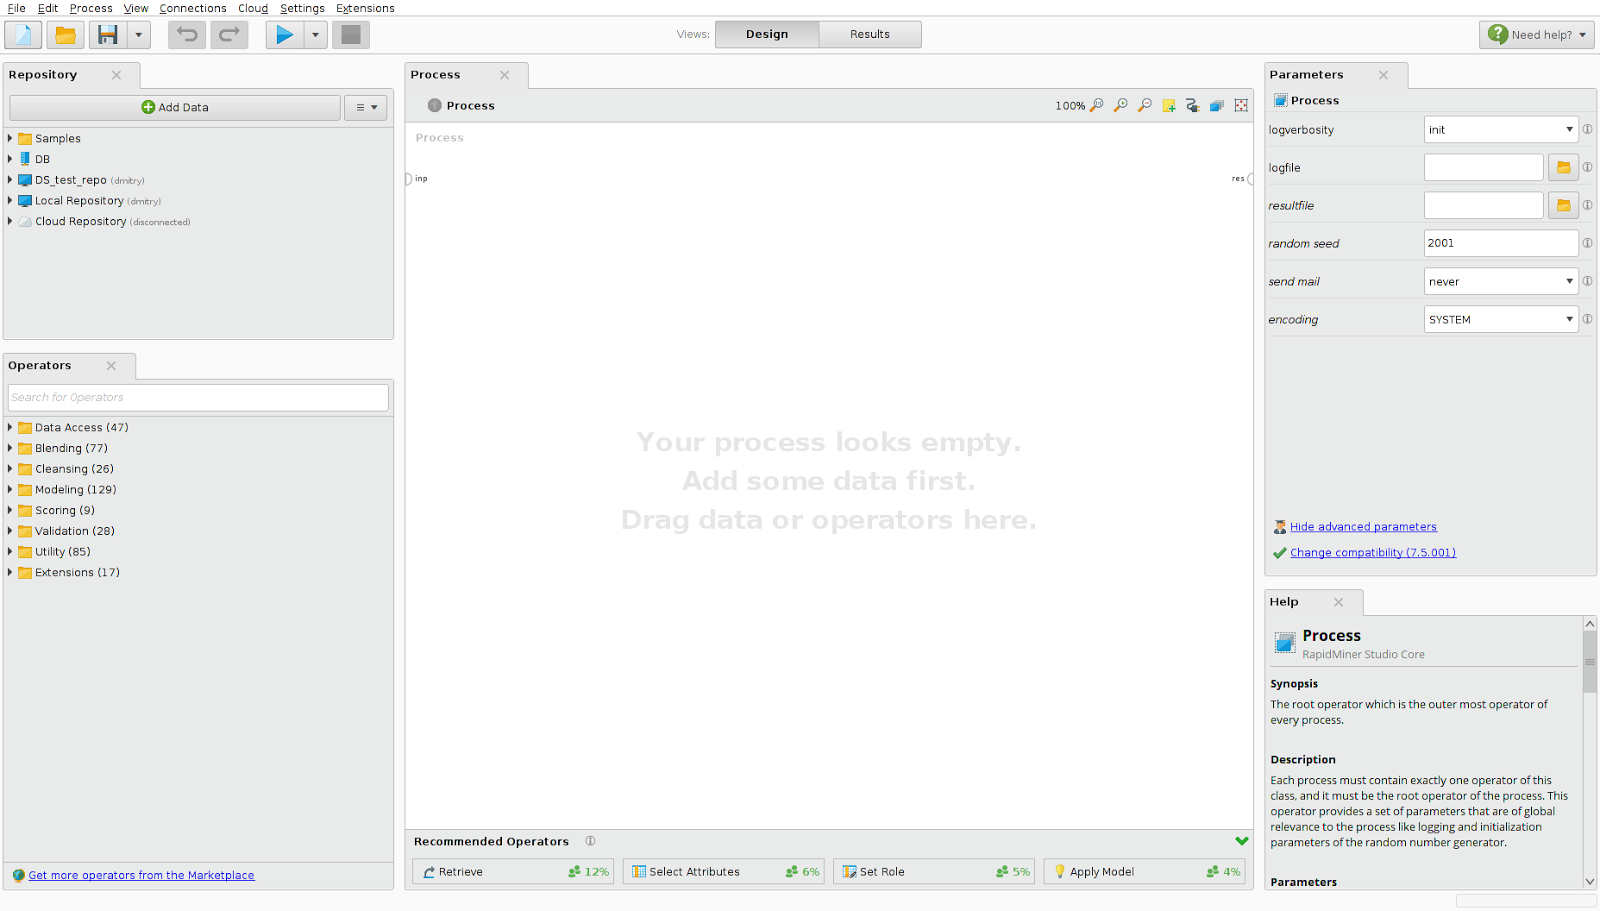
Fig. 1 Screen form of RapidMiner.
On the left side of the screen are the data loading panel and the operator panel. RadpidMiner provides the ability to download data from a database or cloud storage (Amazon S3, Azure Blob, Dropbox). The set of operators for convenience is divided into categories:
- access to data (work with files, databases, cloud storage, Twitter streams );
- operators for working with dataset attributes: type conversion, date conversion, operations on sets, etc .;
- mathematical modeling operators: forecast models, cluster analysis models, optimization models;
- auxiliary operators: starting Java and Groovy routines, anonymizing data, sending an email message, event planners.
We described some of the main categories, each of which has its own subcategories and various variations of the operators. It is worth paying attention to the possibility of adding operators from the ever-growing RapidMiner Marketplace. For example, among the available extensions there is an operator that allows you to convert datasets to time series.
In the central part of the screen is a workspace for creating data conversion processes. Using drag and drop, we add data to the process that we will work with, and data conversion, modeling, etc. operators. By setting the relationships between data and operators, we set the progress of the process. At the bottom in the center is a toolbar with tips - based on processes built by other users, it advises you which operation to perform next. On the right is a panel with the parameters of the selected operation and detailed documentation of parameters and operating principles.
To get started, upload the data (see Figure 2) on the number of Ukrainian search queries in Google related to the common cold. You can see an example of the data in Table 1 of the Application section.
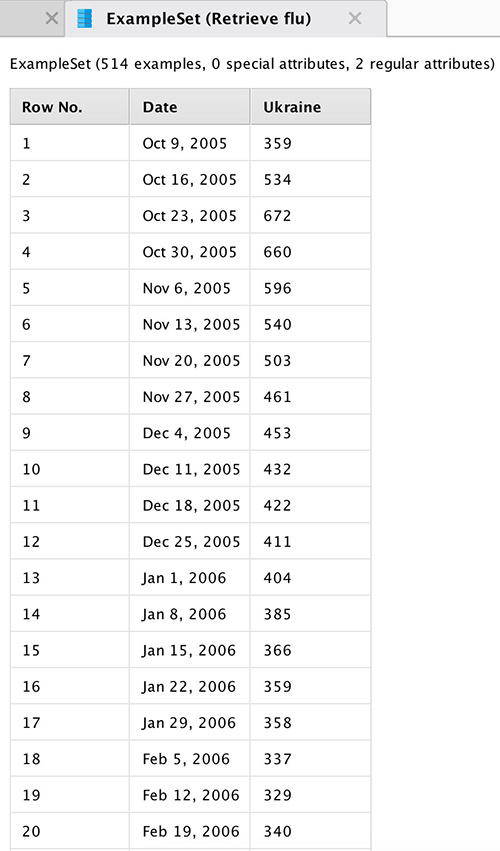
Fig. 2 Type of data for Ukraine
Data represents the number of requests at the end of the week from 2005 to 2015. When importing data, you must specify the date format for the correct construction of time schedules. Connect the output of the data block with the output point of the process results (res). When you press the "start" button, the program will show general statistics. The results are shown in Fig. 4.
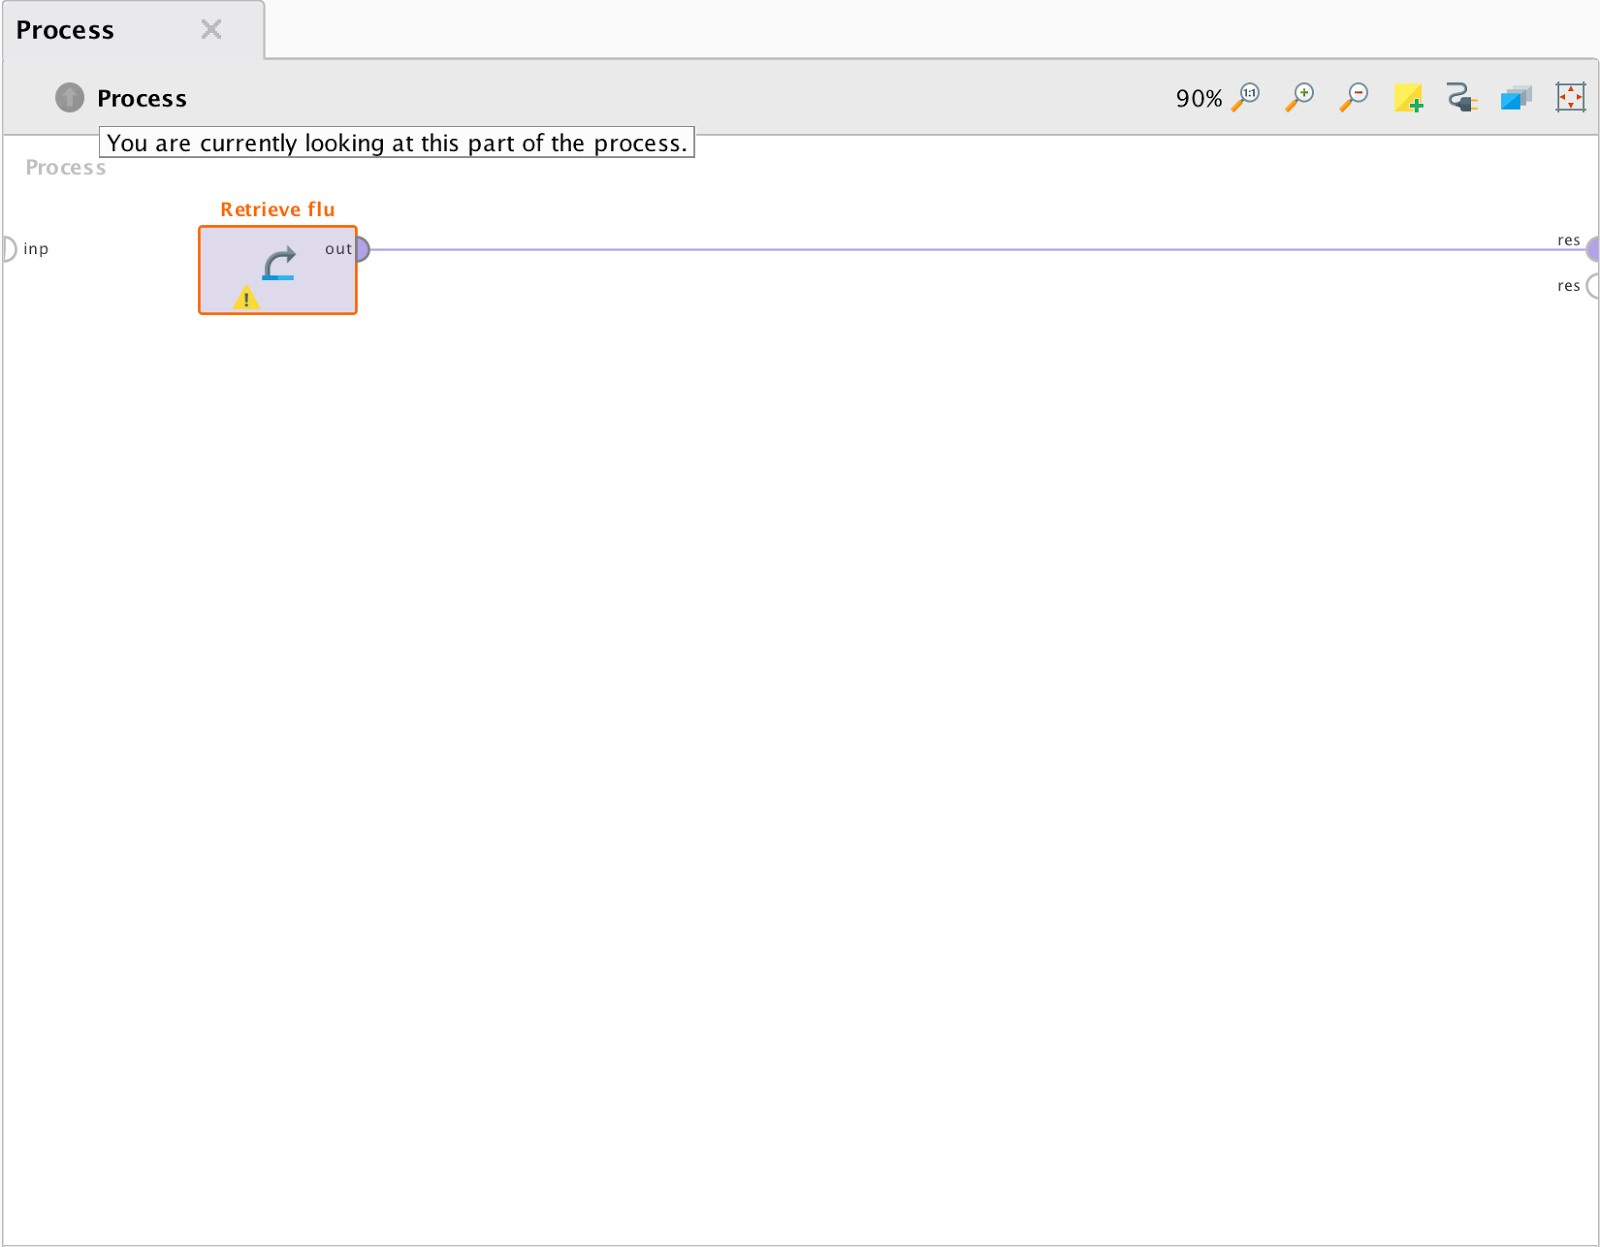
Fig. 3 The process of generating general statistics.
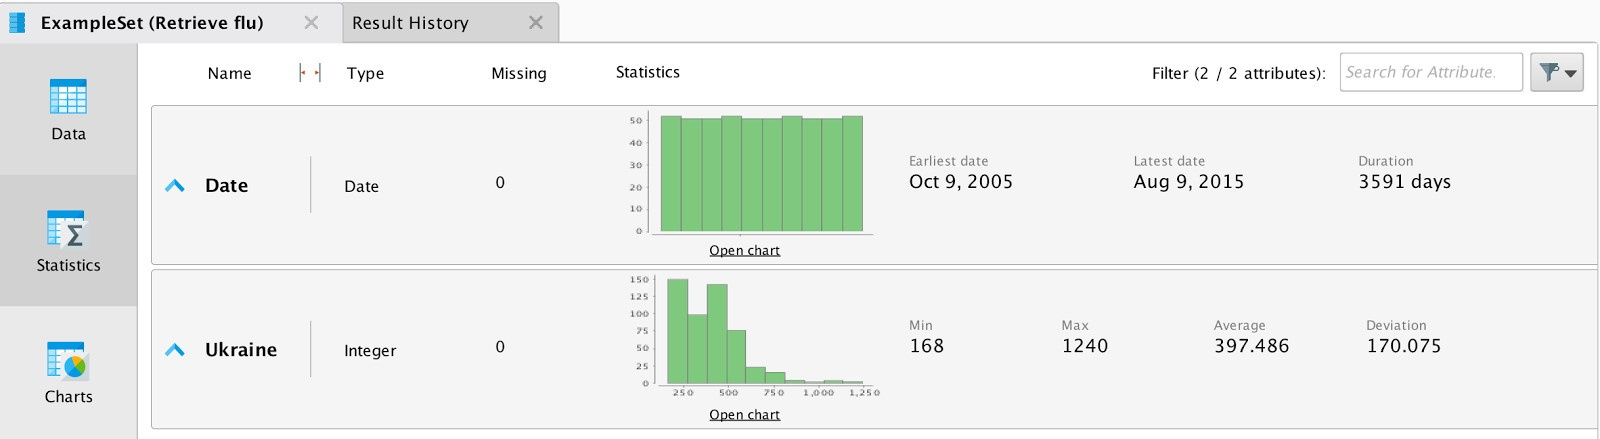
Fig. 4 General statistics for data for Ukraine.
Using the Charts tab, we will plot the data distribution graph (Fig. 5). The graph reflects the apparent frequency of the incidence of the common cold: the first wave begins in the fall, and we can observe the peak by February. Now let's take the data for Russia and see if the same periodicity remains in them, whether the outbreaks coincide with the periods that we allocated in Ukraine. To do this, upload new data and combine them with previously downloaded data; we unite using the Date field using the “Join” operator.
In the graphs shown in Fig. 5 and 6, we can see that the cyclicity persists and the incidence peaks almost coincide.
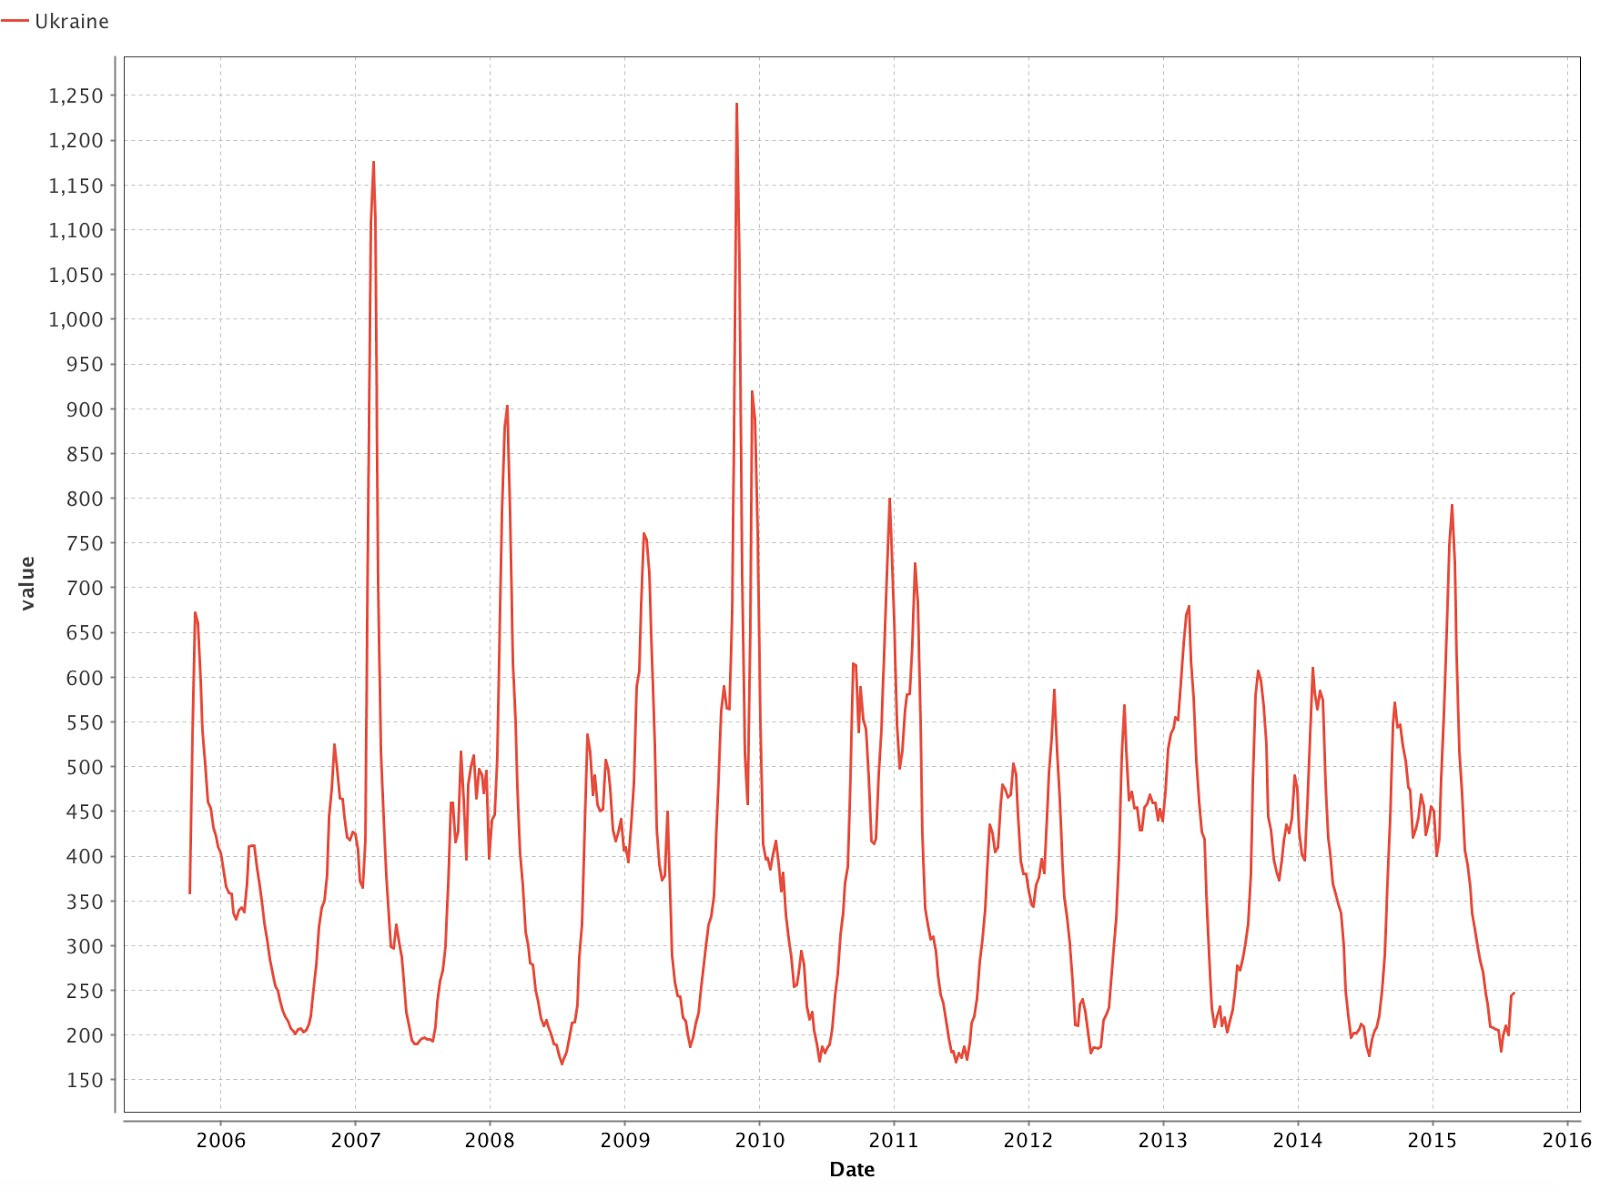
Fig. 5 Number of cold requests since 2005.
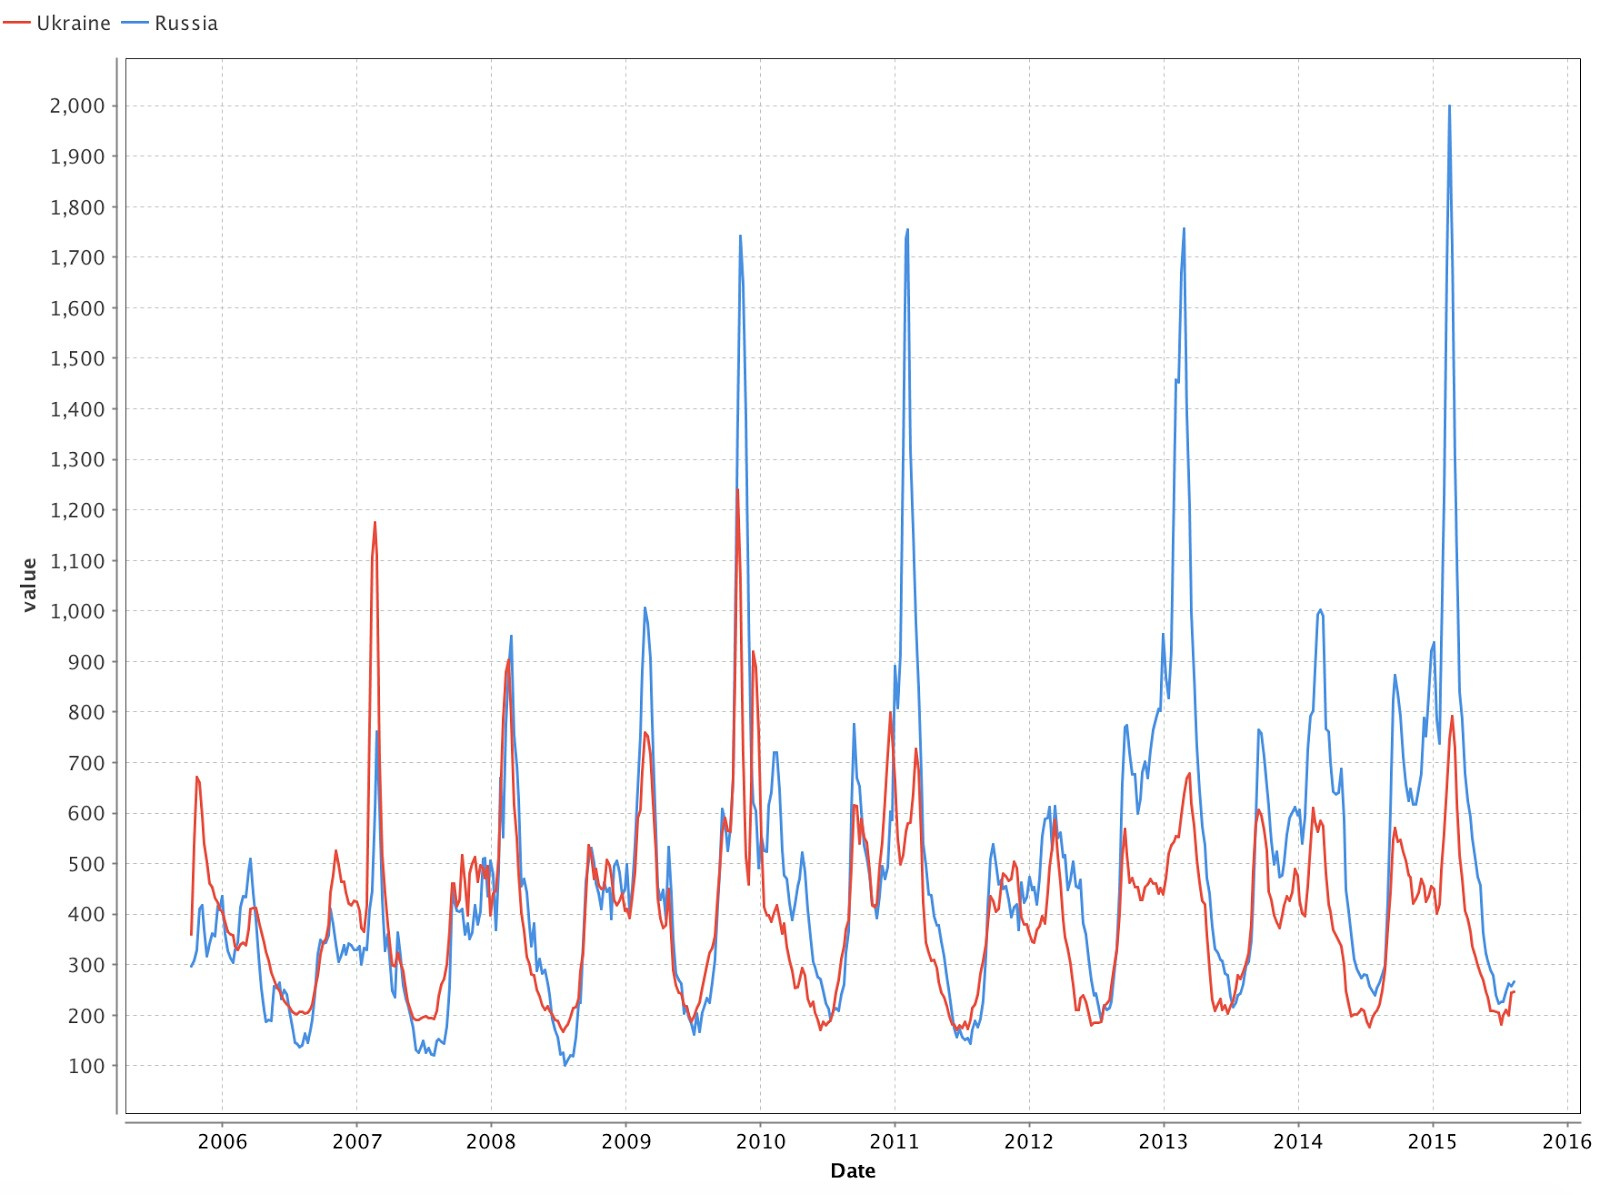
Fig. 6 Data on colds for Ukraine and Russia.
Model building
Let's move on to building a model that will predict the number of cases in Ukraine. We will predict the value of the series for the next week based on the values of the four previous weeks (approximately one month). In this article, we use a direct distribution neural network to predict the time series. The choice of neural networks is justified by the simplicity of the selection of model parameters and their further use. In contrast to the autoregressive and moving average models, neural networks do not require a correlation analysis of the time series.
In Fig. 7 shows a diagram of a process that allows you to predict the values of the time series:
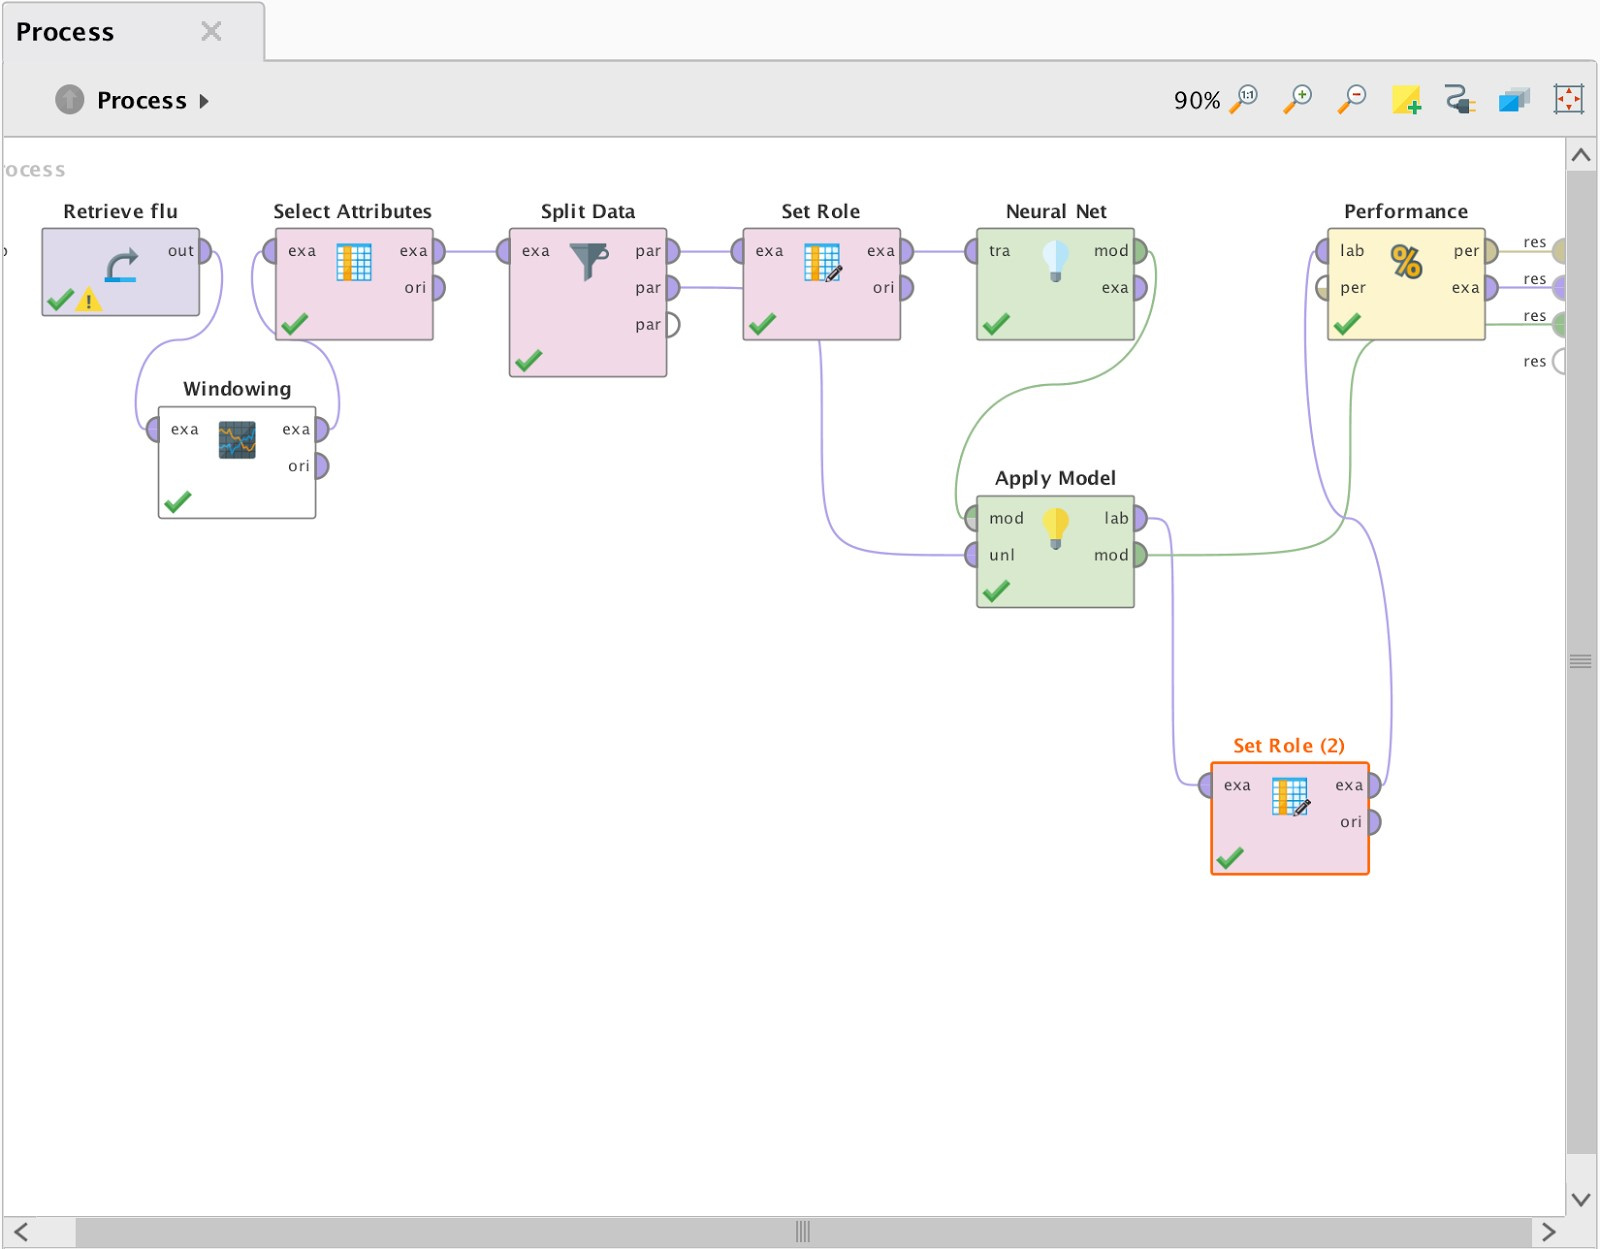
Fig. 7 The process of building a forecast in RapidMiner.
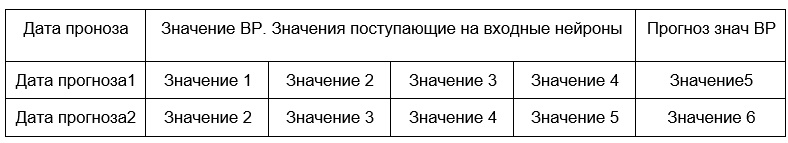
For the neural network operator to work correctly, it is necessary to convert the original time series into the training sample format. To do this, we used the Windowing operator from the Series Extension. Thus, from the column of values we got a table of the form:
Table 1. Presentation of the training sample for the neural network
Next, using the “Select Attributes” operator, we removed extra fields from the selection (dates for values 1–4). Teaching a neural network with a teacher implies the presence of a training and test sample, so using the “Split Data” operator we divided BP in the ratio of 80 to 20. According to the documentation of the “Neural Net” operator, it is necessary that the column of predicted values in the training sample has a name / role “Label”, for which the “Set Role” operator was used. Since the column “Prediction Date” is not involved in forecasting, it needs to be assigned the role “Id”. The second output of the “Split Data” operator and the “mod” output of the “Neural Net” operator are connected to the corresponding “ApplyModel” inputs. The “Apply Model” operator submits a control sample to the input of the trained model and compares the predicted and actual values. The final stage of our process is the “Performance” operator, which is necessary to determine the error of the results. The predicted value obtained from the “Apply model” using “Set Role (2)” was assigned the role “Prediction”.
Consider the parameters of the neural network operators used and the calculation errors. Empirically, we came to the architecture of the neural network shown in Fig. 8. The deep feed forward neural network has 2 hidden layers: 4 neurons in the first and 12 in the second. As an activation function, a sigmoid was used. The training was conducted on normalized input data with a training coefficient of 0.5 and the number of cycles of 1500.
Forecasting Results
RapidMiner as a result of our model provides three artifacts:
model: its graphic representation, parameters and weight vectors;
results of calculated errors;
a sample of test data, supplemented by a column of predicted values.
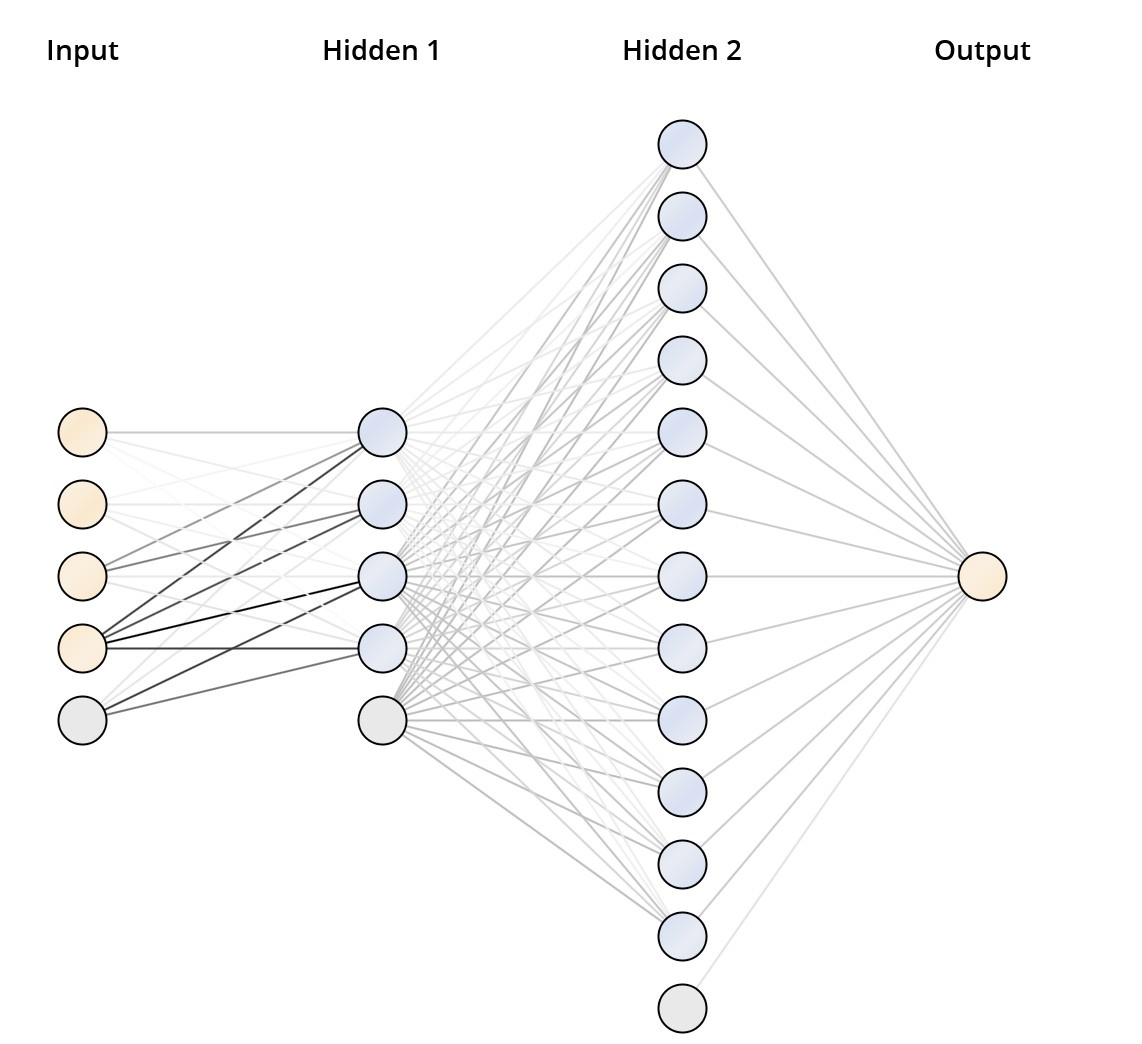
Fig. 8. Neural network architecture
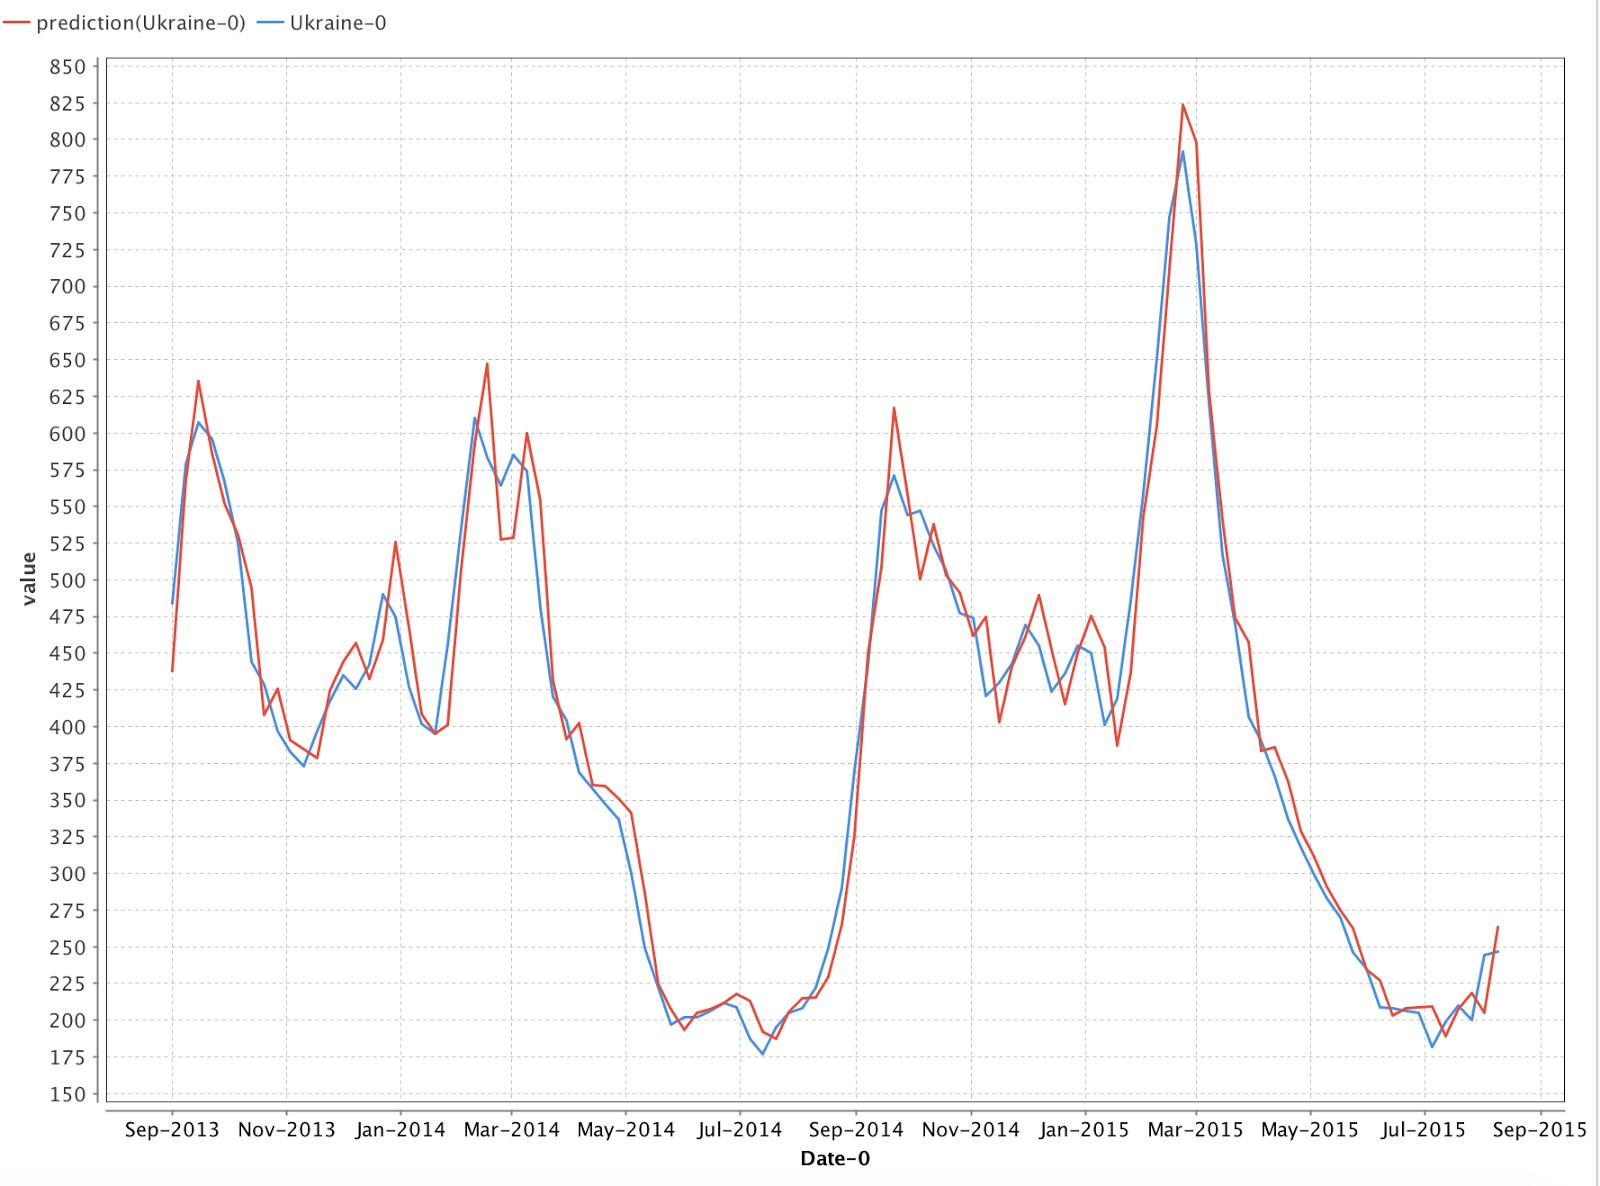
. Fig. Figure 9 predicted and actual values
in Fig. 9 we can see the result of forecasting. As you can see, the chart with the predicted data is very close to the real data. Let us evaluate the results of the constructed model, calculating the forecast error using the formulas (1, 2).
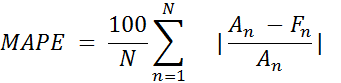
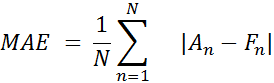
where An is the real value, Fn is the predicted value.
As a result of the calculations, we obtained:
MAPE = 5.47% (3)
MAE = 21.748 (4)
conclusions
The massive introduction of machine learning technologies entailed the creation of tools of varying degrees of complexity for the end user. The Rapid Miner program presented in the article lowers the entry threshold for starting to learn Machine Learning technologies.
If you use this program, you do not need to be able to write code in Python or R. Rapid Miner in every possible way suggests the following action in the chain of data preparation, model training, its validation and accuracy assessment. It allows you to automatically correct some errors in the process, can help and explain certain points that are not fully understood by you.
When writing an article, we studied the functionality of RapidMiner. It is quite extensive and provides the ability to use complex neural network architectures and fine-tune their parameters: selecting the activation function, configuring neural connections of hidden layers, etc. Having a license allows computing in the Rapid Miner cloud, which should reduce the learning time and speed up the process of other characteristics. In addition, the license allows you to download more data and does not limit the user to ten thousand lines.
The mathematical model constructed in the article reached an error of about 6% on the test data and, with some changes, can be used to predict the growth of colds. However, our main goal was to show the simplicity and conciseness of the program used.
Using Rapid Miner and a similar approach, any company can predict situations similar to outbreaks of colds. Preventive measures taken on the basis of the forecast can reduce risks and ultimately increase profits.
List of materials used
- Google Flu Data Russian Federation
- Google Flu Data Ukraine
- Using RapidMiner for time series forecasting in cost modeling: 1 of 2
Applications
Table 1. Sample data for Ukraine and Russia
| Date | Ukraine | Russia |
|---|---|---|
| 10/10/2005 | 359 | 296 |
| 10/10/2005 | 534 | 307 |
| 10/23/2005 | 672 | 329 |
| 10/30/2005 | 660 | 411 |
| 11/11/2005 | 596 | 417 |
| 11/13/2005 | 540 | 371 |
| 11/20/2005 | 503 | 316 |
| 11/27/2005 | 461 | 341 |
| 12/4/2005 | 453 | 362 |
| 12/12/2005 | 432 | 357 |
| 12/18/2005 | 422 | 415 |
| 12/25/2005 | 411 | 409 |
| 1/1/2006 | 404 | 436 |
| 1/8/2006 | 385 | 362 |
| 1/15/2006 | 366 | 327 |
| 1/1/2006 | 359 | 313 |
| 1/29/2006 | 358 | 304 |
| 5/2/2006 | 337 | 329 |
| 12/2/2006 | 329 | 344 |
| 2/19/2006 | 340 | 413 |