Monitoring system latency with JHiccup
- Tutorial

About JHiccup
JHiccup is a simple program that measures the latency of the operating system in terms of the end application. It was written by Azul’s CTO, Gil Shadow, to measure OS delays.
Why delays are so important
We live in a time of network applications. Most programs running on our computer regularly go online. If we launch the browser and open google.com, then 50-60 requests will occur.
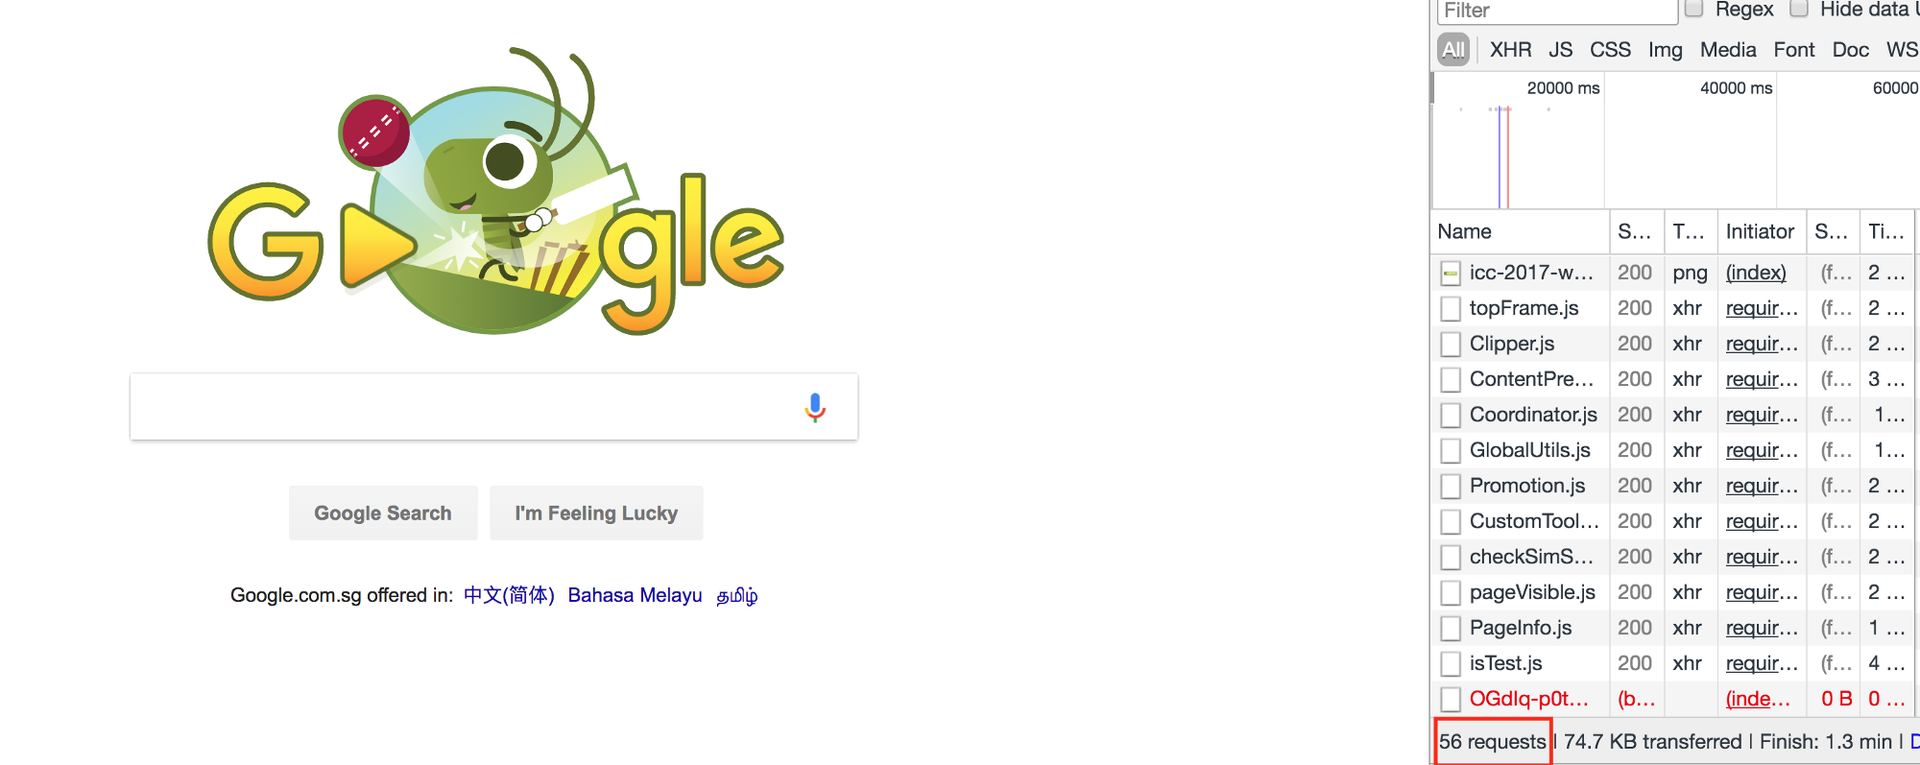
56 requests occurred to open google.com
If we talk about more complex sites, then the number of requests will be in the hundreds. And delaying any of these requests may delay rendering of the entire site.
Having examined the example of sites, we can easily draw an analogy with a client-server application or popular micro-services. If in the chain of calls by the micro-service one of the micro-services returns an answer later than usual, then this can slow down the whole logic. For example, a slow response about the price of a product from the database can slow down the entire purchase process in the online store.
Therefore, when we talk about program performance and delays, not only the best and average results are important, but also the worst results.
Why OS monitoring is needed
Often, developers receive complaints from clients or other systems that the application has processed the request for too long. Unfortunately, such a problem can be difficult to reproduce locally or even notice in a real environment.
Many developers in this case immediately begin to look for problems in the code. For this, for example, logs, metrics and profiler are used. But a proper performance analysis should start from the bottom up, starting from the level of iron and wasps and ending with the program.
Most wasps are not real-time operating systems. So they can not give guarantees for a certain time the execution of operations. This means that the performance of programs running on such OSs can vary greatly during the time the program runs. Simply put, a program may not even receive processor time at some point. And then it does not matter what code is executed in the program.
Here are a few reasons why a program can “sleep” without being able to perform useful actions:
- The OS can perform internal garbage collection;
- Another resource-intensive application may use a CPU or other resources;
- The OS can run on top of the hypervisor, and without knowing it, it will not be the only OS running on this hardware.
Why jHiccup?
There are many utilities and metrics that allow you to see the load of various components of the system with varying degrees of detail. The problem is that there are a lot of such metrics and for each programmer you need to answer two questions:
- Could this metric cause a delay?
- Is the specific meaning of this metric abnormal?
jHiccup allows you to look at the system from an application perspective. jHiccup is a small application with a simple function: an endless stream falls asleep and asks the wasps to wake it after a certain period, for example 1 second. If the wasp was busy after 1 second and was unable to wake the stream, then the application will see this by comparing the time of awakening with the estimated time of awakening (time to fall asleep + 1 sec). We can build a graph where we see system delays during program execution.
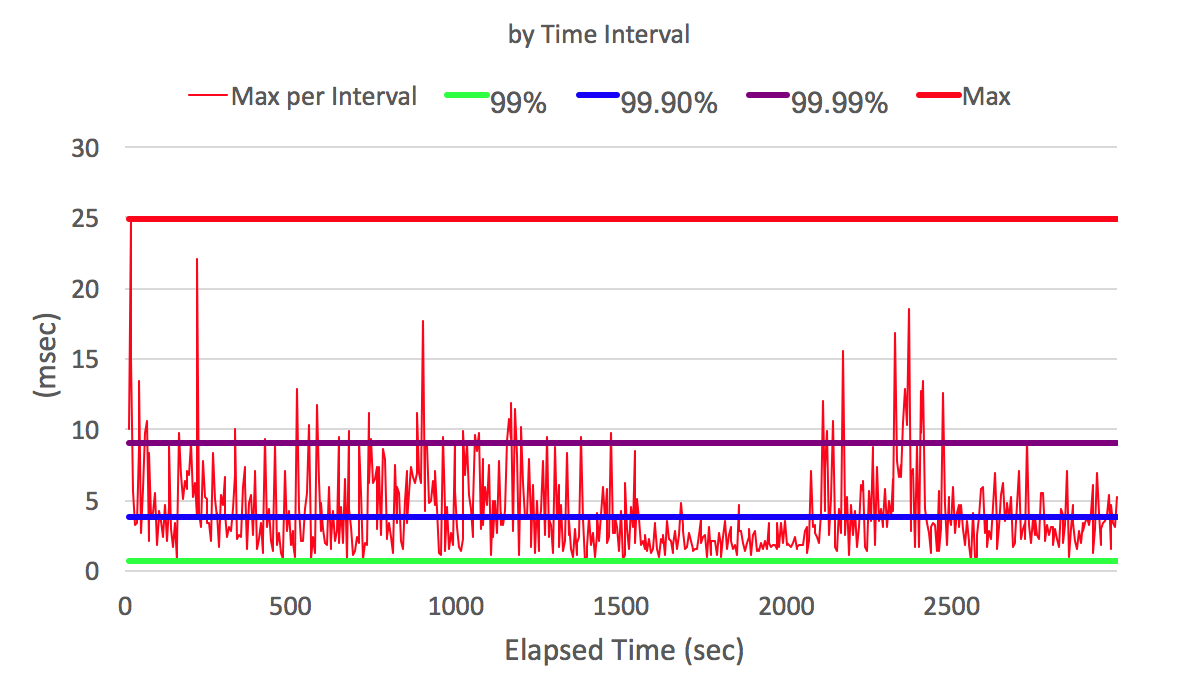
On the X axis, the program execution time in seconds. On the Y axis, the wake-up delay in milliseconds (how long did the program wait for the OS to allow it to execute)
Knowing the time of the complaint about the slow response of our system to the client and seeing the schedule of delays in waking up our program, we can say whether the reason for the delay was or not.
In the previous graph, we looked at delays with respect to program execution time. In addition, it can be convenient to take all the delays and sort them in ascending order. This will give us an idea of the distribution of delays and their likelihood.

Delay in milliseconds on the y axis and its probability on the x axis
Some features of JHiccup :
- doesn't suffer from the Coordinate Omission problem well described by Gil Tene in his video
Inside jHiccup uses a histogram as a data structure. A regular histogram breaks the entire delay interval (for example, from 1ms to 1 second) into segments and counts how many delays fell in a certain interval. This allows you to present the data on the delays in a more compact form than just a list of observed values (1.55ms, 2.6ms, etc.).
In fact, jHicuup uses a special implementation of the histogram - HDR-Histogram, which has the following properties:
- Histograms have high resolution. We can see not only 95% and 99% worse results, but also much more detailed data (99.999%).
- Stores data in a compact form, which allows you to measure performance over time. To do this, the size of the histogram segment increases exponentially. This makes it possible to more compactly store anomalous values.
The HDR-Histogram library is widespread. You can find implementations in different languages. Different systems for collecting metrics began to support hdr-historgram as one of the internal formats, due to its compactness and accuracy.
Why such precision?
In the graphs above, we saw data on 99.9999% case. Many people have a question whether such accuracy is needed and whether it is necessary to consider data beyond 95% or 99% percentile. Let's look at two examples. In both examples, we take the probability of anomalous delay P (A) as 5% and 1%, respectively. We need to answer the question, what is the likelihood that the user will see an abnormal request P (B):
- We saw that google.com makes about 60 requests. For example, consider the site of an online store where you need to complete 200 requests to purchase. In the case of P (A) = 5%, P (B) = 1– (0.95 to the power of 200) = 99.997%. In the case of P (A) = 1%, P (B) = 1- (0.99 to the power of 200) = 86.6%
- Suppose we have 10 micro-services. And each is called twice during the execution of a certain scenario, that is, 20 calls occur. In the case of P (A) = 5%, P (B) = 1– (0.95 to the power of 20) = 64.15%. In the case of P (A) = 1%, P (B) = 1- (0.99 to the power of 20) = 18.2%.
As we can see, considering data only up to the 95th or 99th person is not enough.
JHiccup example
You can download jhiccup from http://www.azul.com/downloads/jhiccup/ or https://github.com/giltene/jHiccup .
./jHiccup -d 4000 /usr/bin/java org.jhiccup.Idle -t 300000
# первые 4 секунды старта не буду записаны, всего будет записано 300 секунд. По умолчанию поток будет просыпаться каждые 5 секунд (настраивается с помощью параметра -i).
# создан hiccup.170617.1120.3461.hlog
./jHiccupLogProcessor -i hiccup.170617.1120.3461.hlog -o hiccup.170617.1120.3461
# создан hiccup.170617.1120.3461 и hiccup.170617.1120.3461.hgrm
The hiccup.170617.1120.3461 file can be viewed using the jHiccupPlotter.xls excel file.
Для просмотра hiccup.170617.1120.3461.hgrm можно воспользоваться онлайн приложением https://hdrhistogram.github.io/HdrHistogram/plotFiles.html. Оно также удобно для сравнения нескольких hdrm файлов (например, во время разной загрузки системы или с разных серверов).
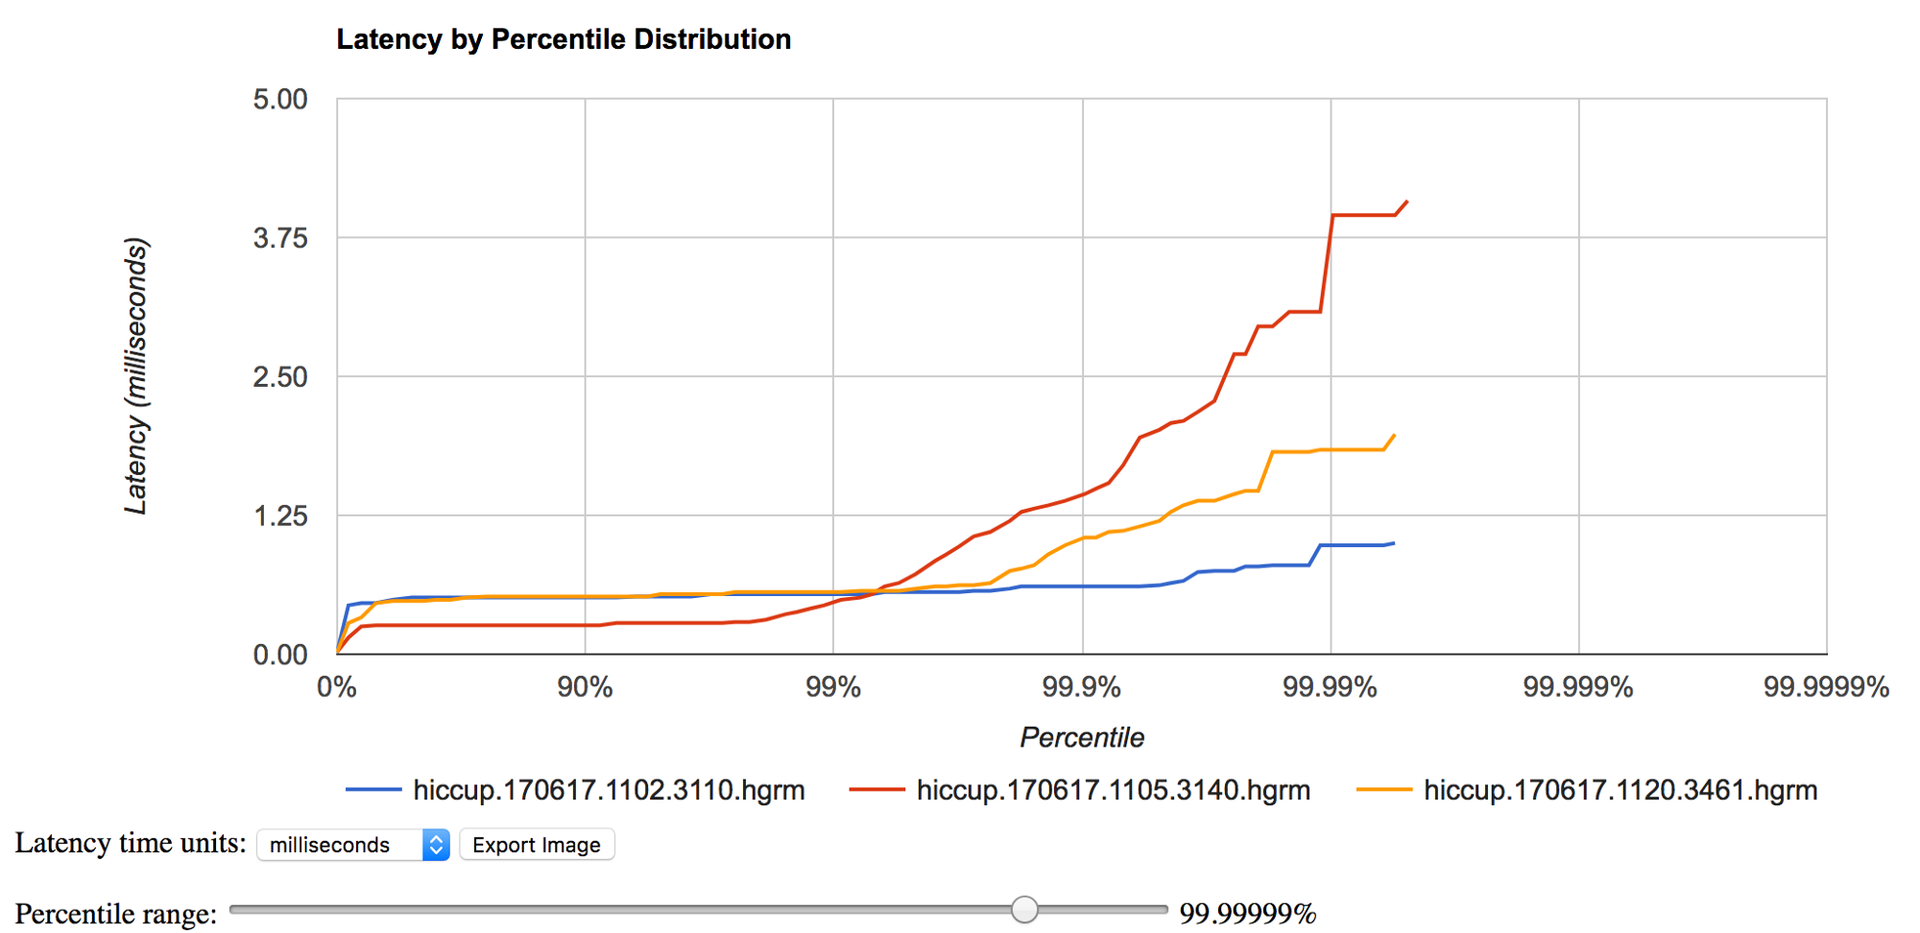
Сравнивая график производительности нашей программы (например, задержки http-ответов) с полученной hdr-диаграммой, мы можем понять работала ли вся система медленно в определенный период или только наша программа.
Мы запускали jhiccup как отдельный процесс. Другой способ это запуск javaagent-а вместе с нашей программой.
java -javaagent:jHiccup.jar="-d 0 -i 1000 -l hiccuplog -c" MyProgram.jar -a -b -cВ этом случае jhiccup будет просыпаться и сохранять информацию о задержках в течении всего времени выполнения программы.
There is one important difference in these two launch methods. In the first case, jHiccup runs on a separate JVM in another on the same JVM. That is, in the second case, we will see delays associated with the work of the JVM (for example, pauses of the GC), on which the main application is running.
In the jHiccupPlotter.xls file, it is possible to add SLA lines to the chart.
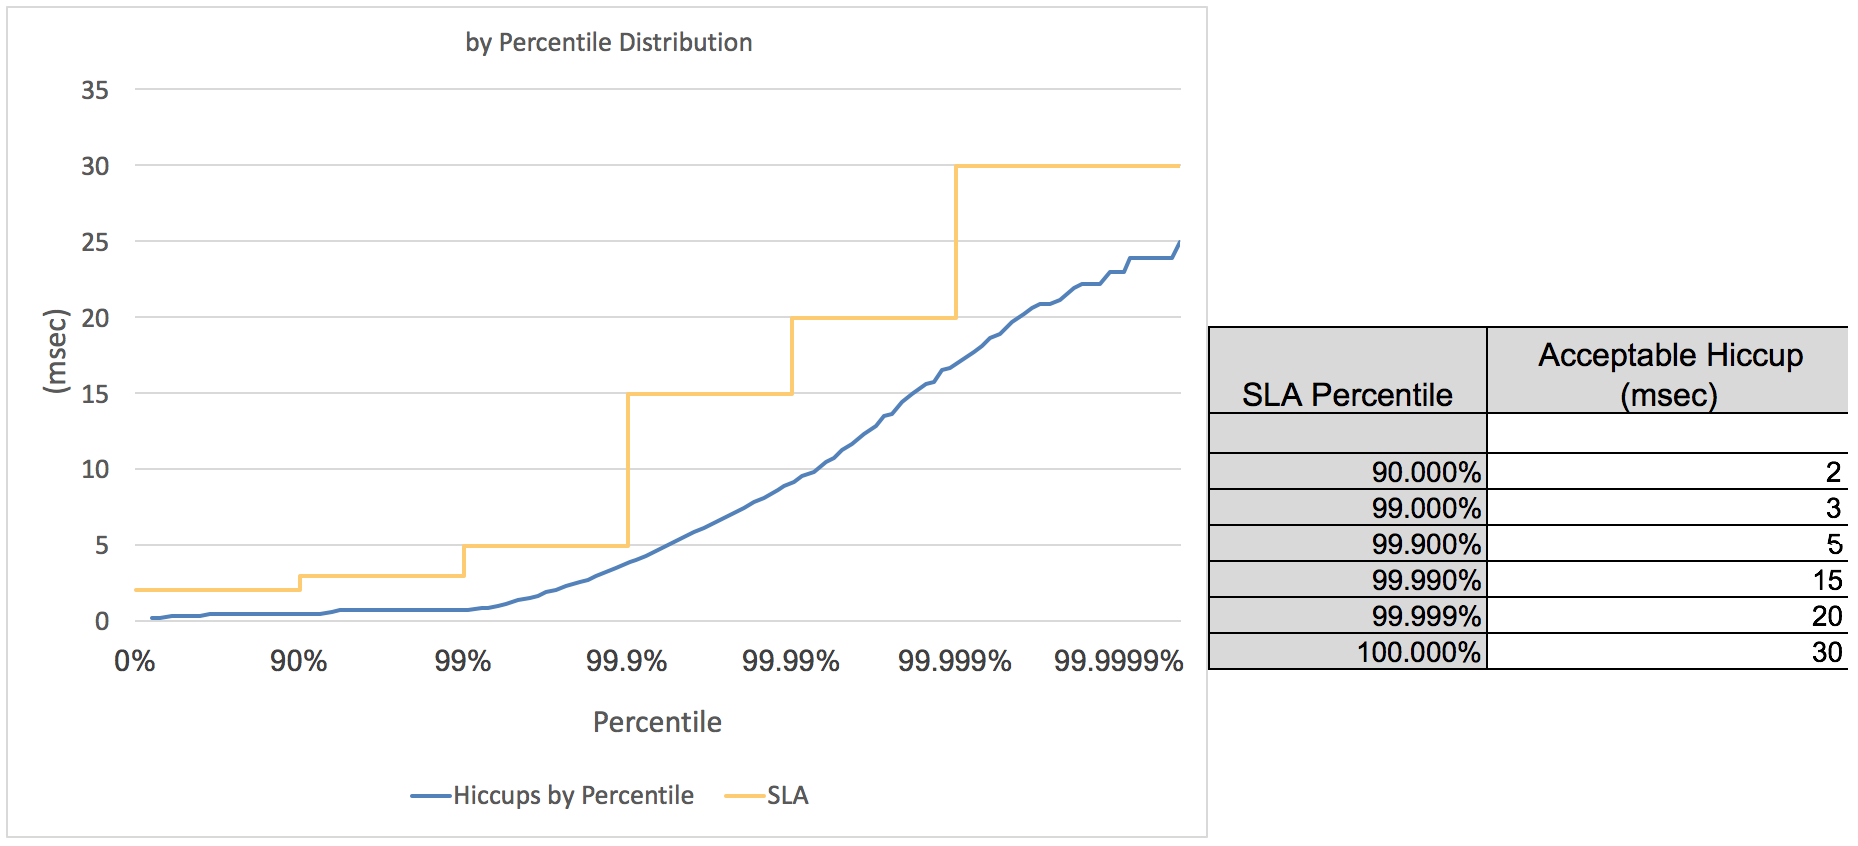
I see two convenient applications for SLA:
jHiccup is a handy utility for monitoring system delays. Unlike system metrics, jHiccup allows you to take a look at system loading from an application perspective.