Quick start iOS-application on the example of iOS Mail Mail.Ru
Nikolay Morev ( Mail.Ru )
Today I will talk about our experience in accelerating the launch time of the application, and what he taught us.
Here we see that for most users, the launch time was about 4 seconds, even a little longer. Therefore, recently we decided to pay more attention to the quality of the product, and not to the new functionality. We began to increase test coverage, began to work on reducing the size of the application, on optimizing startup speed, on optimizing the use of network resources. And this is what we learned.
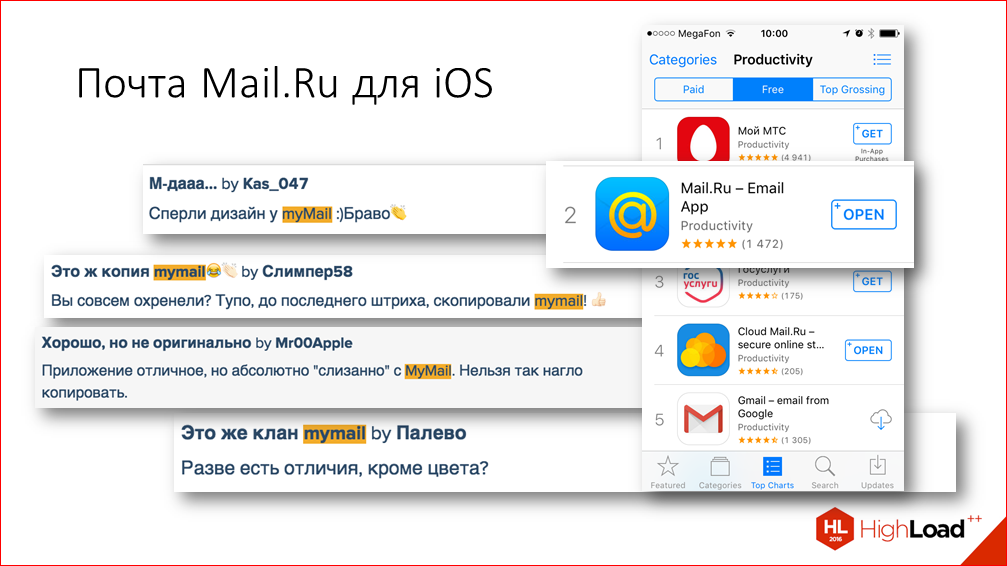
Our application is an e-mail client that allows you to work with any mailboxes, not only those that are wired to mail.ru. And we have been in the Store since 2012, although the history of application development is a little longer and is rooted in Agent Mail.Ru application.
Almost all this time, we are in the 30th position in the ranking of the most popular free applications in the Russian Store and in the 1-2th position in the performance section. Today we will also talk about performance, but not quite about that. For an international audience, we are making the same application, with a slightly different design, called MyMail. And our users sometimes notice this.
Today I will talk about our experience in accelerating the launch time of the application, and what he taught us.
Our users, in principle, constantly tell us some problems with applications and talk about what is really important for them. Here are some examples of reviews in the AppStore:
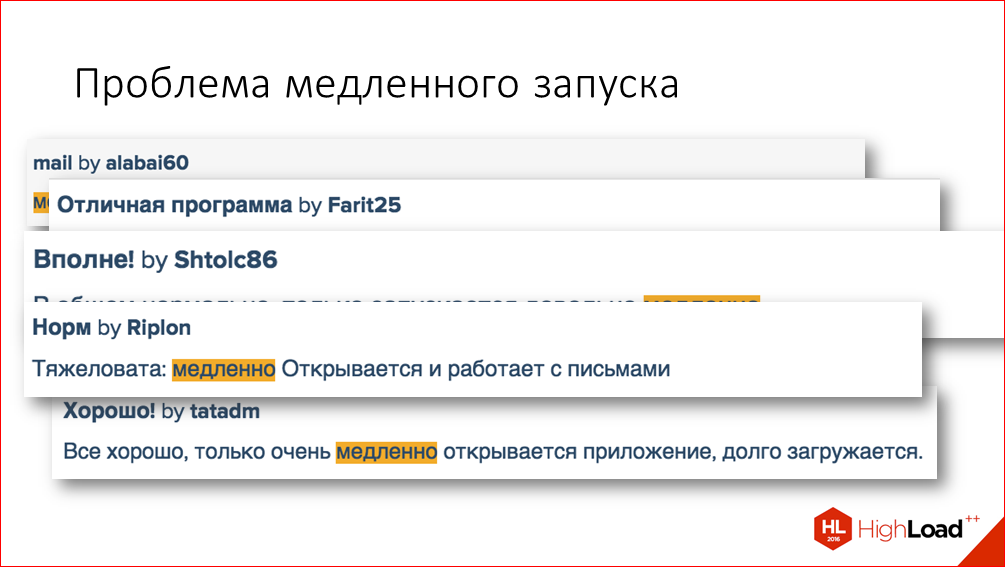
In addition, the analytics data that we collect also confirmed that there was a problem with the launch time.

Here we see that for most users, the launch time was about 4 seconds, even a little longer. Therefore, recently we decided to pay more attention to the quality of the product, and not to the new functionality. We began to increase test coverage, began to work on reducing the size of the application, on optimizing startup speed, on optimizing the use of network resources.
First, let's see how we came to the urgency of this problem? How did it happen that the problem with the launch speed began to worry us. Perhaps you can compare these factors with your application and understand, but, in general, is it worth it to do?

The very first thing is that our application has such a usage scenario that users launch it many times during the day. And of course, at the same time, if the application starts slowly, it annoys everyone.
The second reason is the obvious answer to so many questions in development: "This is how it happened historically." I would attribute the performance problem to problems that are called technical debt. These problems accumulate gradually, as new functionality is added, invisibly to everyone, and it happens that even intentionally to speed up the development time. I think everyone knows these situations. For this reason, it hardly makes sense to optimize the startup speed if your application is not launched so often.
And another reason is the lack of continuous performance monitoring. The process of accumulating technical debt, as we all know, is natural, and new code is constantly added to the application that can affect the launch speed. Part of this code really needs to be executed at the start process, these are things like setting up a logging library, launching a library to catch caches, etc. And the part, it turns out, is added to the startup process randomly, i.e. by oversight. For example, we in our application at the start, so historically, that we customize the appearance for all screens of the application, even if they are not shown directly at the very beginning.
All this is complicated by the fact that each time the start time increases by a very small amount. And this deterioration cannot be noticed during manual testing, and even if we use special tools like the profiler, we may not notice this deterioration, because the error in the change in the profiler will be greater than the deterioration made.
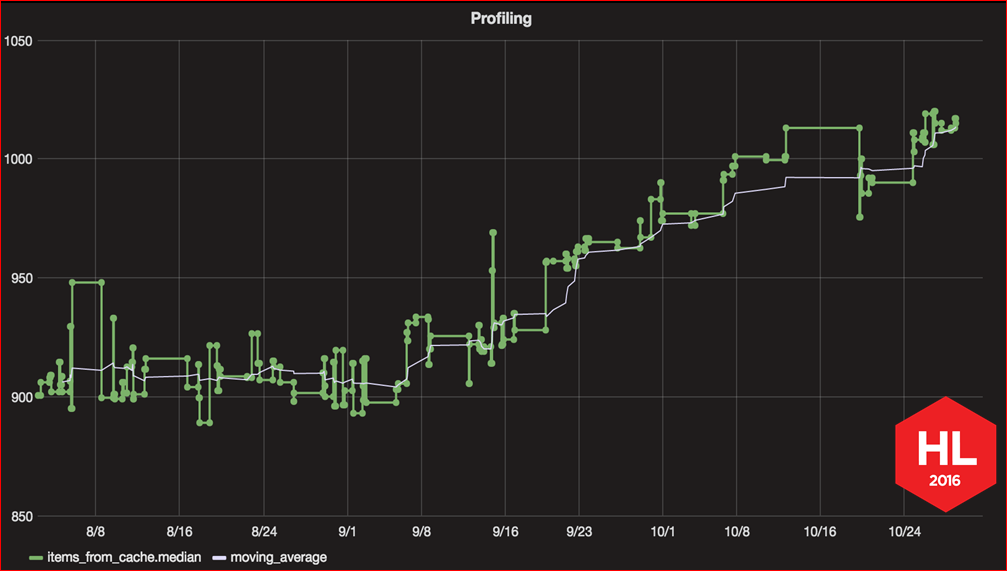
Here is a graph of the launch speed we have built over the past few months. It exactly shows this problem, how gradually, a little bit, the startup speed is increasing, increasing with each new commit. This graph was one of the results of our work to improve the launch speed, and then I will tell you how you can also build such a graph for your application.

But first, let's talk about how to build the process of working to improve launch speed.
Everyone knows that the main rule of optimization: premature optimization is the root of all evils. Therefore, before you start, you need to decide on the main questions - what exactly are we optimizing, how will users feel the effect of our optimization, how do you understand whether the change led to the goal or not, and, in general, it would be nice to make sure first, but, in principle, is optimization possible, and what is the maximum value that we can improve the startup speed, because the speed may depend not only on your code, but also on some external factors that you cannot influence. Let's start answering these questions.
What have we optimized? We selected the most common startup scenario for optimization. This is when the application is unloaded from memory, the user has already logged in to his account and, when launched, gets into the list of letters in the Inbox folder. It looks something like this:

Next. The effect that users should feel.

As a result of all optimizations, the user should lose the feeling of brakes at the start. To achieve this, we go from two sides - we try to reduce the time itself, but, in addition, we try to improve the subjective perception of the start time.
Here I will talk only about the technical part - how we improved time, but in my article, a link to which I will give later, you can find several tricks to improve subjective perception.
Further. How to measure that optimization has had an effect?

In the process of working on optimization, in the process when we tried to find places that can be optimized, we used Time Profiler. To assess the overall effect of the change, we used the logs built into the application. Why didn’t we use Time Profiler? Because if you cut out some small part in the application, optimized it, removed some code, it is far from the fact that this will affect the overall start time. And, of course, to make the measurements as useful as possible, we take all the measurements on the slowest device that we have, and in no case on the simulator.
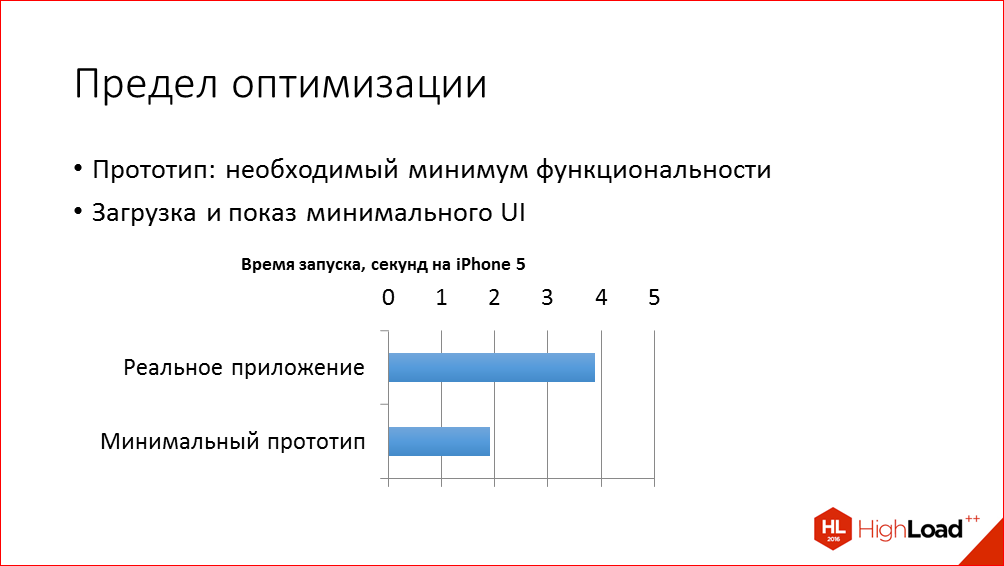
And the answer to the last question - what, in principle, the limit of optimization is possible - we got as follows. We created a simple test application with minimal functionality, which, literally, is the Single View Application template in Xcode, and added screens with a header, a list of letters, and several cells that mimic the list of letters. And on this application we measured the time below which we, in principle, will not be able to optimize. And we realized that on the order of two seconds theoretically we have opportunities for optimization.
We proceed to the optimization directly. Let's start with the first phase of the launch.

The first stage is the time that passes from clicking on the application icon to transferring control to our own code. In fact, a lot of things are happening at this stage, and it may well take a tangible time.
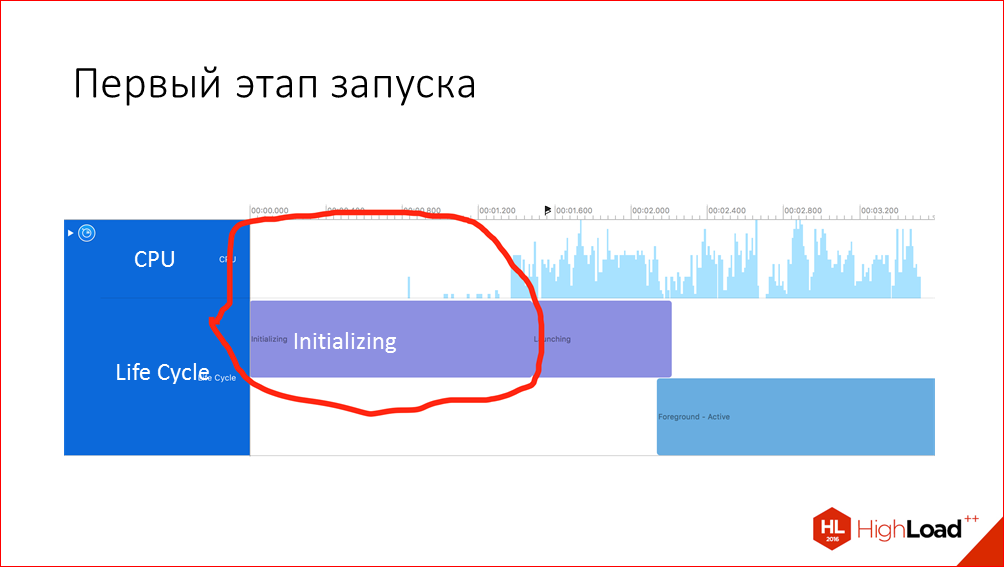
The bad news is that in the first stage you can’t see almost any data in the profiler, but the good news is that there are still some opportunities to influence this time.
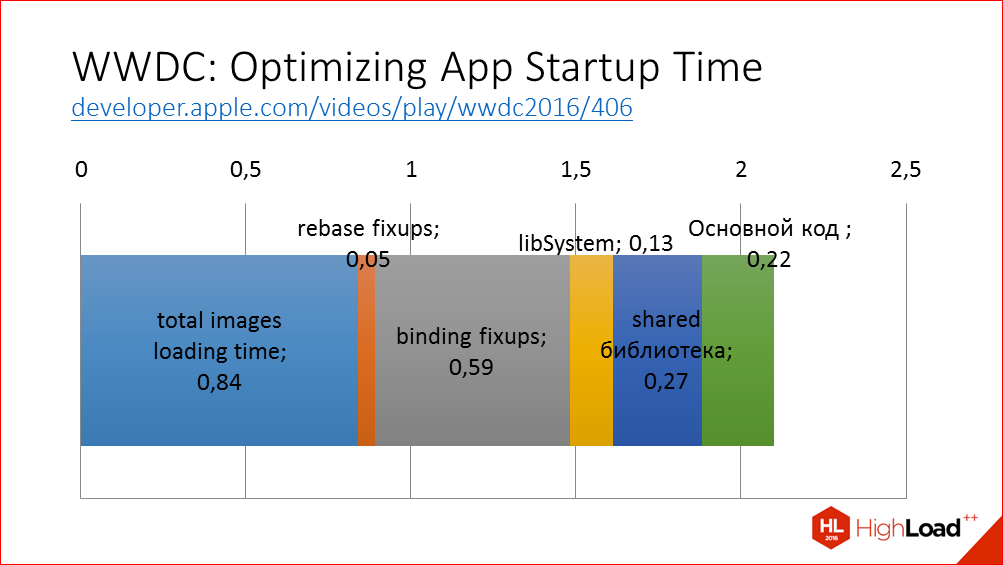
At WWDC this year, there was an excellent report on the first stage, it was considered in great detail what was happening here, and recommendations were given on what we can do about it.
What's going on here? iOS loads the executable code of the application into memory, performs the necessary manipulations on them, the shift of indicators, which is in our application; binds pointers to external libraries, checks signatures of all executable files, and then loads methods and static constructors are executed. This is the very first code that is already our code, and not the operating system code. For an example, I gave a diagram of how it looks in our application, what a breakdown by various stages. For your application, you can get the same data using the DYLD_PRINT_STATISTICS environment variable in Xcode. Accordingly, in order to speed up the first stage, the main recommendation is to reduce these stages. How to do this?

I cut out a slide from the report at WWDC, which summarizes all the recommendations briefly - for the application to work faster, you just have to do fewer things in the application.
What other recommendations?

Reduce the number of dynamic frameworks that you have in the application. Why? Because they load much slower than system frameworks, loading of system dynamic frameworks is already optimized in advance in the operating system, and the number 5 is given as the optimal number of native dynamic frameworks.
In our application, we have only one dynamic framework and, mainly, we added it in order to embed code between different actions and to reduce the size of the application so that this code is not duplicated. But, in principle, if we only thought about launch speed, we could refuse dynamic frameworks.
By the way, if you use swift, then it adds several own dynamic frameworks at once, which are also considered to be in this limit. Those. it turns out that using swift adds a certain overhead at startup.
The steps that are marked as rebase fixups, binding fixups are affected by the number of Objective-C characters in your application, so the main recommendation here was to write large classes and write large methods. Or switch to swift, where all addresses are set statically and you do not need to do these steps, or at least they are shortened.
Naturally, for an existing large application, this is not a very useful recommendation, because you have to do a lot of refactoring, re-test a bunch of code, and, in general, the readability of the code, of course, decreases. Therefore, even for new applications, I would not recommend this optimization method.

The second stage, when we already got control from the operating system. Here we already have more room for action, because we can change our code somehow and, naturally, for research here we started using Time Profiler. I will not explain what Time Profiler is.
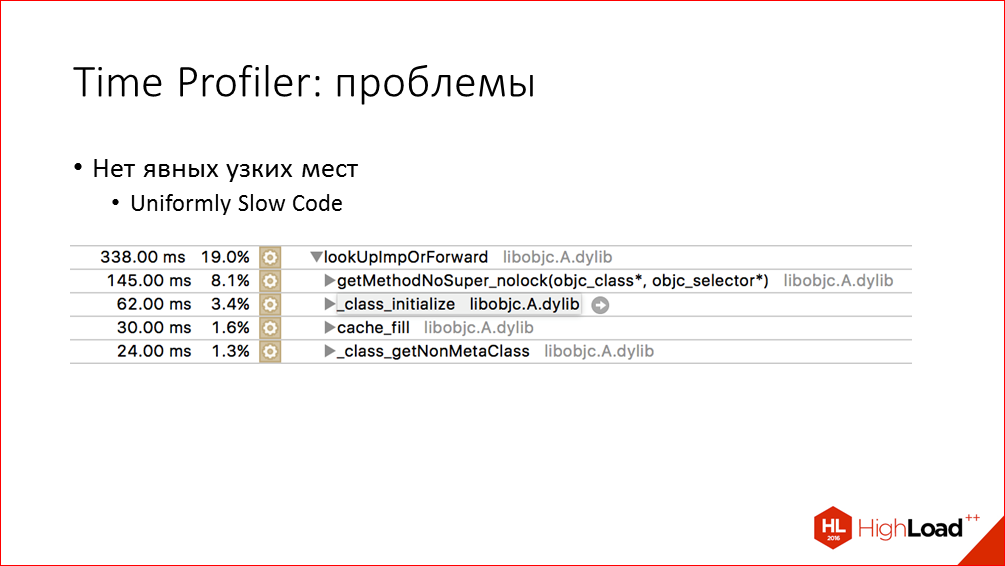
Time Profiler is a very cool and powerful tool, it has helped us a lot, but here I will list a few problems or shortcomings that it could not solve for us.
By the way, we posted publicly available videos of the last five years of the conference of developers of high-loaded systems HighLoad ++ . Watch, study, share and subscribe to the YouTube channel .
First, we did not find any obvious bottlenecks in the application that could just be cut out, and everything would improve immediately. This is a well-known development problem called “uniformly slow code” and it is a consequence of the right approach to development, when we first try to make working and well-readable code, and then think about optimization. Another reason for this problem may be the very features of the platform used. For example, here we see that the overhead of invoking Objective-C methods takes quite a while.
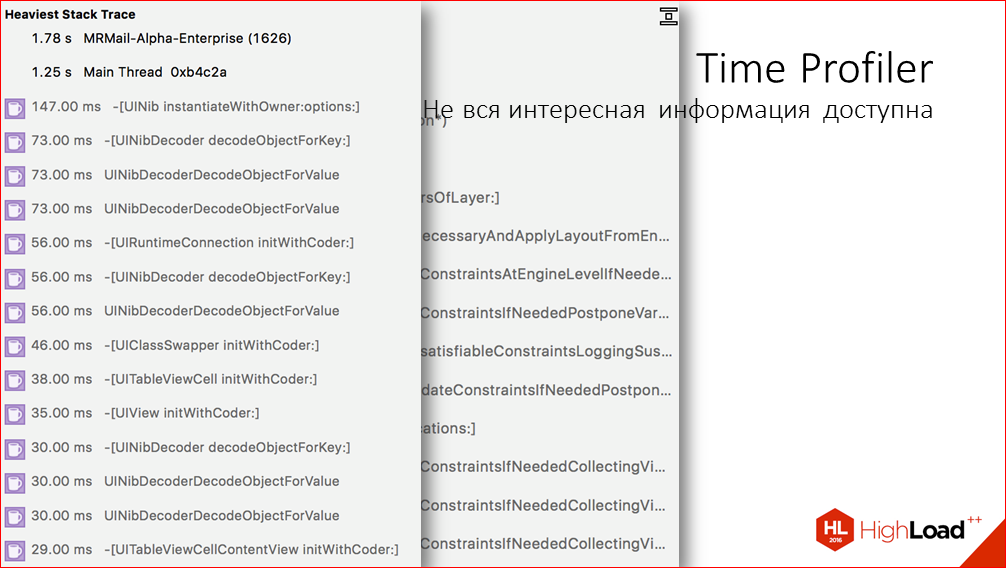
The second issue is Time Profiler. In some cases, we can see such heavy parts of the call tree in Time Profiler, but the problem is that it is not always possible to understand from which view the particular call belongs to which part of the application. And this is mainly observed when we analyze layout or loading views from XIBs. XIBs can also have a rather complicated hierarchy, and it is not always clear which view is slowly loading there.
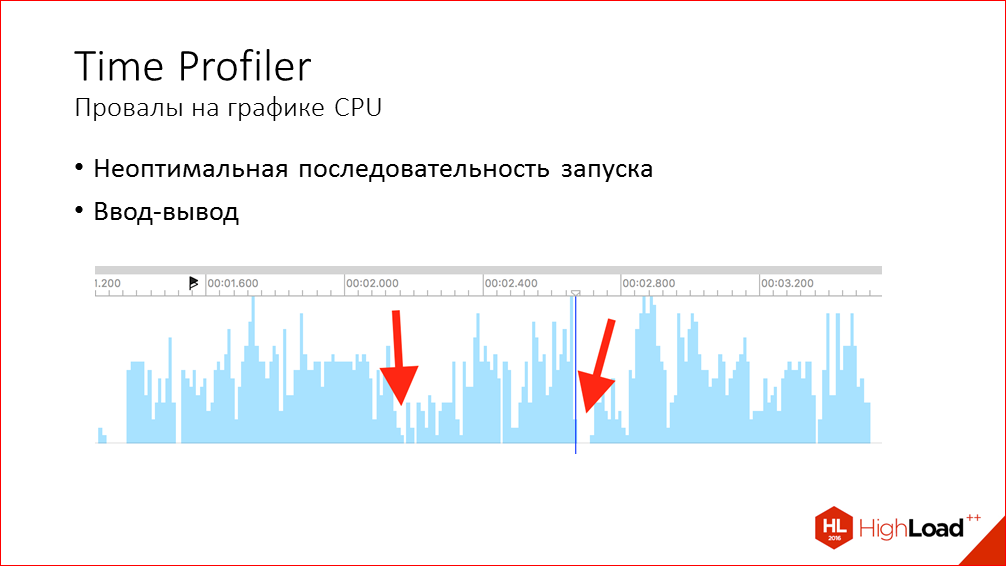
The next problem is dips in the graph of CPU usage. Ideally, of course, for everything to work very quickly, the main thread should be constantly loaded at 100%, something should constantly be done there. But on the chart, we always see failures, they can be small or larger, and Time Profiler tells us practically nothing about why they arise, which leads to them. But there can be two main reasons:
- Firstly, the launch sequence itself can be arranged in such a way that there is an expectation of the completion of some action that delays the remaining stages of the launch, but, in principle, it is not necessary for everything. For example, we try to open the database and only after that continue the rest of the actions, while some of these actions may not depend on the database.
- Another problem that may lead to this, i.e. to failures are synchronous I / O operations. As obvious when we work with files, or when third-party libraries work with files, less obvious ones. So some system calls in the SDK communicate with system processes via XPC, and at these moments such failures can also occur. Examples of such calls are working with Key Chain, with Touch ID, checking permissions for photo access or geolocation.
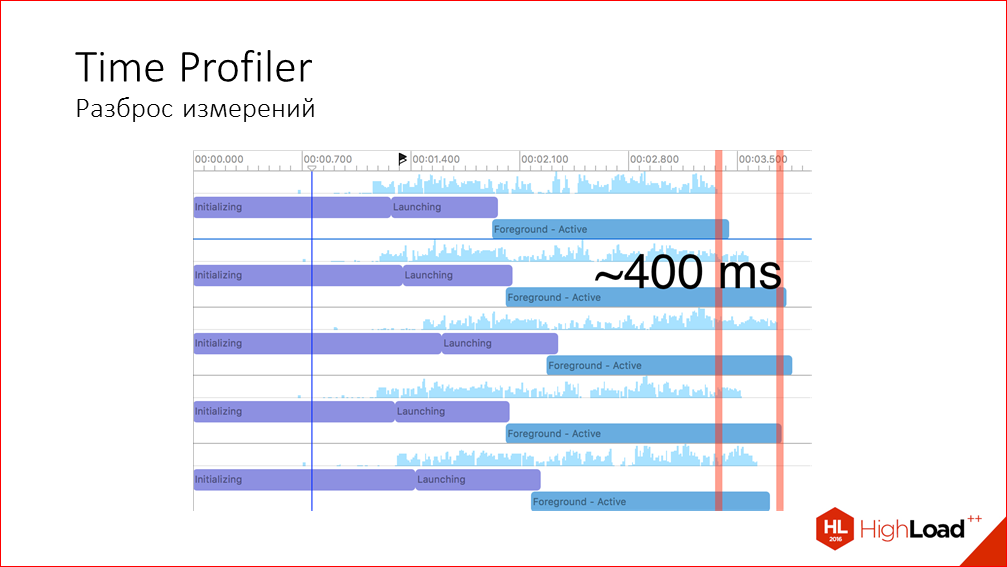
Another problem of Time Profiler, about which I already mentioned earlier, is that it is difficult to understand the general effect of optimization in it due to the fact that the spread of measurements can be quite large. This is what I did measurements on the same application without any changes, and we see that from start to start time varies very much:
What else can you look for when looking for places to optimize?

Profiler gives us a lot of useful information, but our psychology is designed so that it is very easy to get on the wrong track. During the analysis, we tend to pay more attention not to those places that really take a lot of time and can give a big gain, but to those that we are very easily noticeable and understandable and that we are interested in doing.
For example, in the process of finding places for optimization, I found a place where calls to the baseboard at the launch stage took as much as 20 ms. I'm starting to think: “How can I get rid of all this? Maybe replace the baseboard with something else? ". But, in a good way, you need to look at the problem one level higher and understand why we are doing this, in principle. In our case, this was done in the process of sending statistics about the launch of the application and, in principle, we can simply transfer this statistics sending to a slightly later stage, and little will change functionally from this.
Naturally, we primarily want to reduce the amount of work on the main thread. And first of all we pay attention to it, but you should not forget about background threads, too, because the possibilities of parallelizing the hardware are not unlimited. In particular, we were faced with a situation where one of the libraries that we use and initialize at the start immediately went into the background thread and did some work there. At first we didn’t even look at what she was doing there, but then we decided to just turn it off and see what happens. And this gave a pretty significant effect.
Back in Time Profiler, it is striking in the first place that most of the time is spent on rendering the UI and layout. But it’s not always clear from traces what exactly in the UI this time is spent, because there are some strange system calls that are incomprehensible, CA, render, something. And these calls can relate to anything, to any rendering on the screen. But practice shows that the most voracious in the UI is the rendering of labels due to the fact that it is relatively difficult to calculate their size and draw, and any pictures, because they need to be read from disk and decoded.
The conclusion follows from all of the above - if you want to reduce startup time, do all operations as lazy as possible. What does it mean? Do not create or configure any screens or views if they are not shown immediately after the start. In general, perhaps this is the most effective way to speed up the existing large application, where there are no obvious bottlenecks.
For example, what did we do lazy in our application? We made lazy loading of pictures in the process of setting the appearance for secondary screens. We removed the intermediate launch screen, we removed the creation of background screens that are in the side menu, and much more on the little things. In principle, this rule applies not only to the UI, but also to any logic, any code, if some manager or action needs to be initialized at the start of the application. Think about whether you can postpone it at the time of the appearance of the main user interface. Perhaps in terms of functionality there will be no difference.
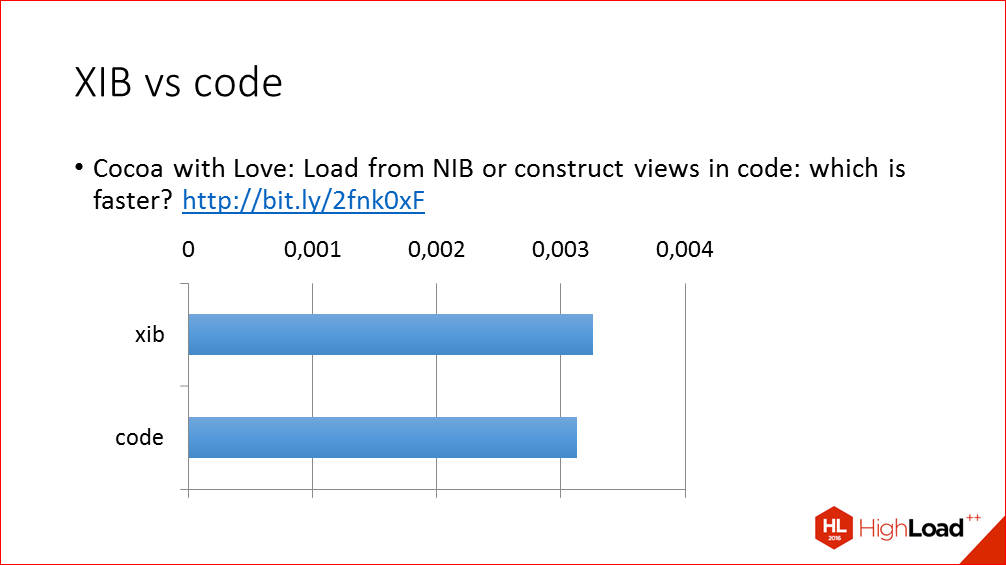
And a few words about such a controversial topic as creating a UI in a builder interface or in code. Oddly enough, XIBs are usually not a problem, the creation of a similar UI in the code is performed very slightly faster, but there are
cases where even slower. Here is a link to a rather old blog post where this comparison was made. If you wish, you can download a test project, though it will take some effort to drag it to the latest version of Xcode, because it was written in 2010. And you can see for yourself what is slower and what is faster.

Input Output. In principle, reading and writing to flash memory on modern devices is very fast, these are units or tens of milliseconds, so you should not always bother with this, but it happens that your or third-party code misuses it and opens too many files at startup. For example, we found such a problem with the Flurry analytics framework and with our own code, where we upload pictures to customize the appearance of the application. Time Profiler will not show you such places. In Time Profiler you will at best see small dips in the CPU graph. Instead, you can use another tool - I / O Activity, which lists all the I / O and the names of the corresponding files. By name then it is pretty easy to determine which part of the application this file is reading.
Similar information can be obtained not only with the I / O Activity tool, but also with a simple breakpoint on the open function. In the case of the system frameworks and XPC, which I spoke about earlier, you can track it by paying attention to the failures on the CPU graph. In Profiler, you open the Call Samples view, where there is a list of all stack traces, and see which calls preceded the failure. So you can understand which call leads to this delay.

When Time Profiler does not provide enough information ... I used to give an example with layout, and in such cases you can get more detailed information using swizzling layoutSubviews methods in all classes. What is swizzling I will not explain. And Objective-C allows us to do this easily. In the behind-swizzling methods of layoutSubviews, we simply insert the logging - how long this call took, and print to the console a pointer to the object over which this layout was performed. After that, we copy it all, paste it into a tablet, in Google Sheets, and we can analyze it. If after such a log we do not end the application, but exit the debugger and pause, we can roughly understand by the signs which views were the longest layouts.

The search methods for optimization that I described above have a big drawback - they do not allow you to confidently answer the question of whether a small change led to an improvement in general, because the sequence of launching in a large application can be quite complicated. This is an interweaving of different callbacks on different threads, etc. And the fact that you removed something somewhere in one place, it can either be transferred to a later stage of the download, or it will not give any improvement at all, because this moment will be replaced by the expectation of some actions. And this problem is especially pronounced when corrections, improvements give a rather small gain. Therefore, we come to the need to automate the start of measurement of the start time and perform a large number of measurements, so that for some median time it’s more accurate to say
Of course, using Time Profiler for this is not an option, because it is difficult to automate, and even such a large amount of information that it issues is not needed for this task. Therefore, we added debugging logs to the application itself, which are entered into the console and in a separate file during the various stages of the launch. These logs look something like this:
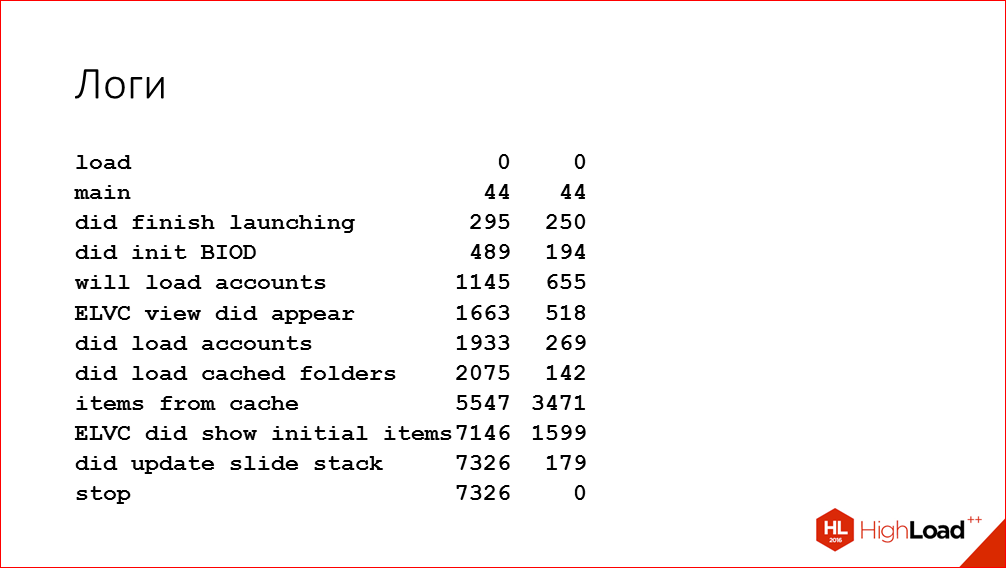
Here we have selected some key points of the critical path to launching the application. At these points, we enter the absolute time from the start of the launch and the time from the previous stage. We used such logs not only subsequently to automate measurements, but also during the search for places for optimization in addition to Time Profiler. Because sometimes it’s useful to just get an idea of how much longer the larger stages of application execution take. So we can understand which stage you need to devote more time to Time Profailer. And with such logs you can even build such beautiful diagrams in Google Sheets that clearly show everything:

For example, this diagram shows how the time of the various stages was redistributed after one change.
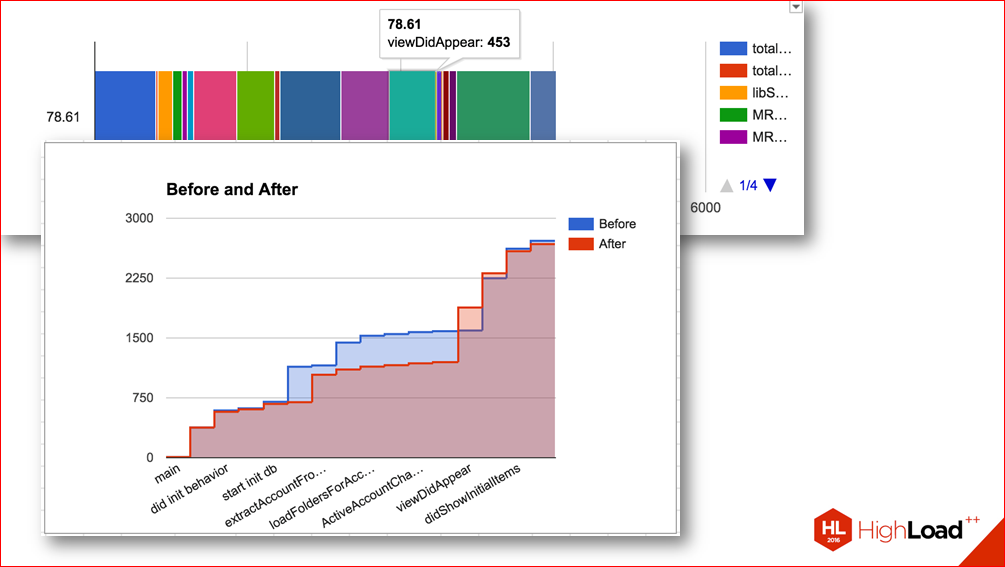
Those. without such measurements, you would think that you made some improvement, but in fact it turned out that time was simply redistributed.
Or here are some diagrams that show the sequence of the various stages of the application:
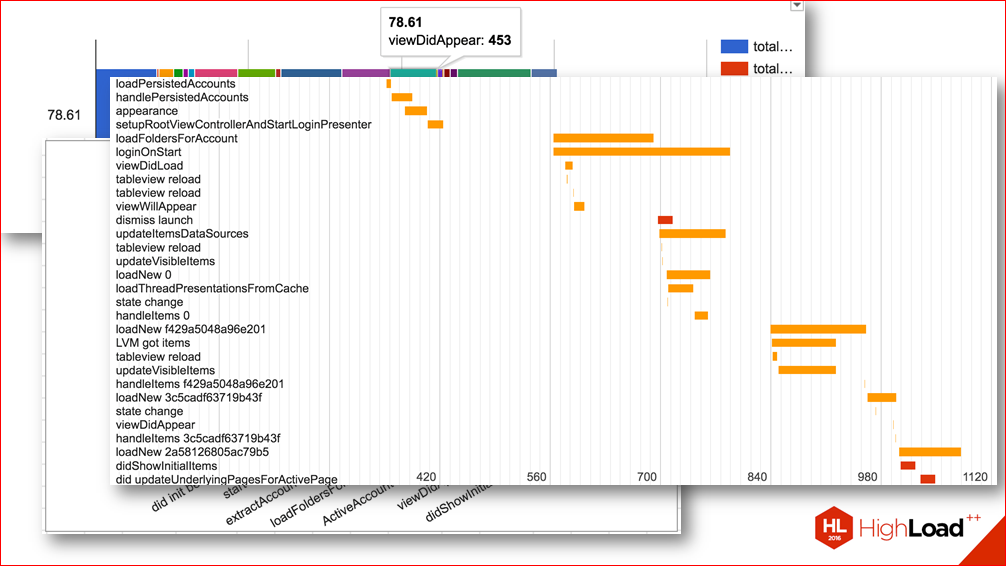
According to them, you can think about what places we can parallelize, where we have an unnecessary relationship between the launch stages, etc.
Talk about optimization.
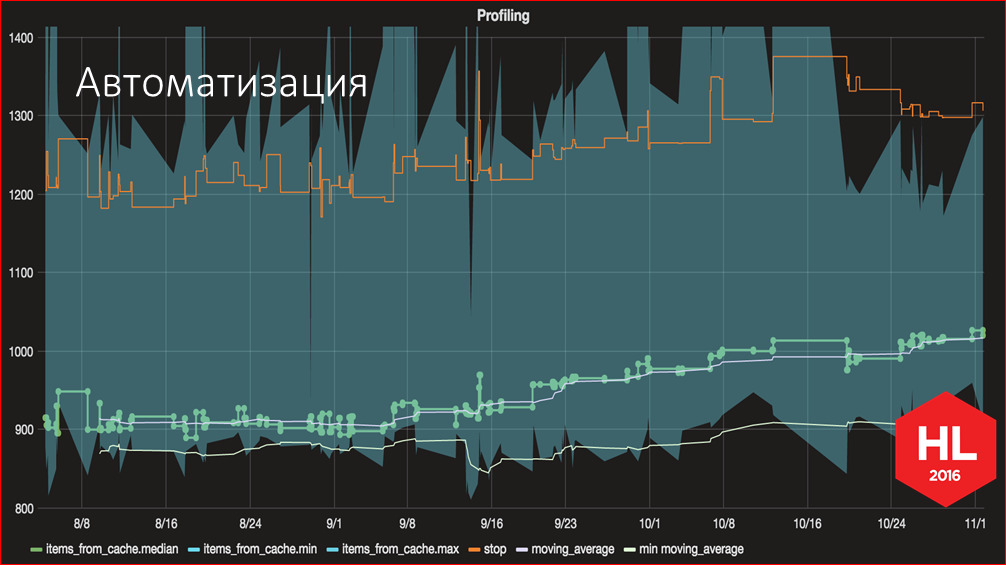
The developer community talks a lot about Continuous Integration, TDD, and other good practices for continuously monitoring application quality, but for some reason there is very little information about how to control performance. We tried to fill this gap. And we consider one of the main achievements of the work done a system that allows us to continuously monitor the launch time during development. Having such a system, we solve the main problem, which led to the need to do this ... With this schedule, we can now clearly see how this or that change affected the startup speed, and we can take the necessary measures by seeing these signals. Now the feedback time has been reduced very much. If earlier we received feedback from users that something is slow,
Naturally, when using such a system, as well as many other useful practices in development, the usefulness of this approach begins to be visible only as the application evolves. At the very beginning, it may not be clear to you why this is necessary.
I will tell you briefly how it is technically implemented.

For every commit, a task is run on Jenkins. It collects the application in the release configuration with the profile logs turned on and the application automatically terminates at the last stage, when we believe that the application has fully started. This assembly runs 270 times on a device specially dedicated to this task. At the moment we have this Iphone 5S, on iOS 9.
And you probably have questions, where did this number 270 come from? Obviously, to reduce the error, this number should tend to infinity, but then each run will take infinite time. Therefore, we made 10 thousand measurements and calculated the necessary number of starts according to the formula for determining the sample size for a normal distribution with an error of about 10 ms. Because of this, everything on the chart jumps a little from side to side.
By the way, if we return to the chart, we can see the moment when we switched from 10 measurements to 270 measurements. The bottom line shows the minimum start time from all starts, respectively, when we increased the number, the minimum became less.
And then, when we made these 270 launches, we process the data for all launches, calculate their statistical characteristics and then save them in InfluxDB, and then a graph is built on them.
You can then look at specific examples of scripts on how this is all done in my article. There really is nothing complicated, there bash scripts are literally 10 lines long. Here I’ll tell you only the main points, which tools we used for this.
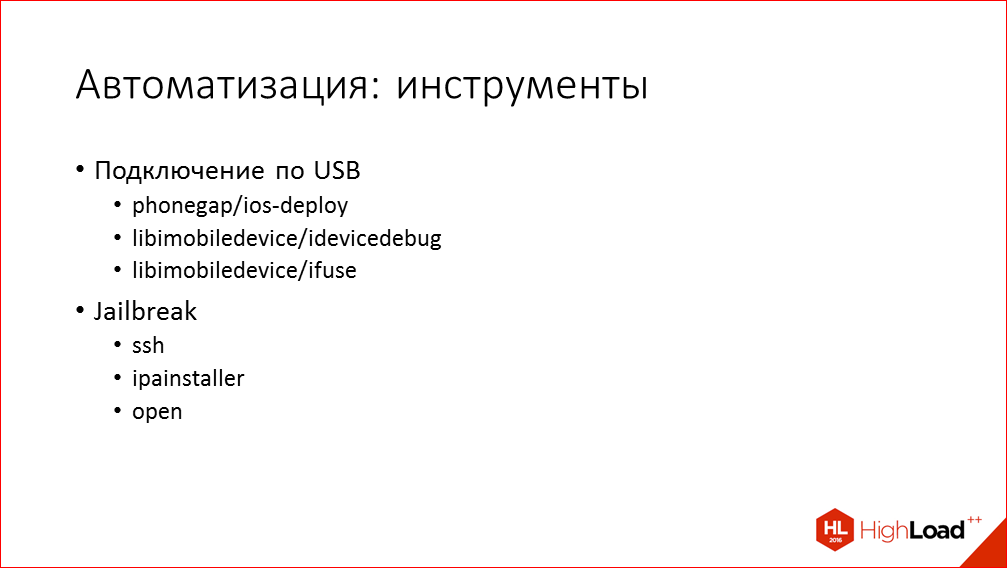
As you all know, iOS is a closed system, so there are two options for automating tasks such as automatic installation, autostart, and getting results from your device. We can either work with the undocumented USB protocol that Apple itself uses in its applications, or we can just install Jailbreak and how white people go to the device via ssh and launch the application by executing one command. Of course, we settled on the latter option, because it is much simpler, more reliable and more flexible. We do not need to bind the test phone to a specific slave, connect via USB. The phone just lies on the table of one of the developers, and from any of the Jenkins slaves we can run measurements on it. Or, if a developer needs to start something, he just picks it up and launches it.
Pitfalls of this approach, which came to light after some time of operation:

Yes, now we can see that at some stage of development the launch speed increased, but, unfortunately, the jump moment does not always coincide with the commit where the deterioration occurred. This is due to the measurement error and due to various external factors - at that moment some kind of system process or something else could be performed on the device that we don’t know about yet.
Even if we determined the commit in which the deterioration occurred, it is not so easy to fix it, anyway we have to do some research work in Profiler, conduct comparison experiments and analyze the code. Of course, I would like to have some kind of technique that allows you to easily see in which places the behavior in run time changed when the commit was entered, something like the Time Profiler and div hybrid, but, unfortunately, this tool is not known to us.
And it also happens that performance worsens due to updating some third-party library, and here we can do little.
I will list the main conclusions that we came to based on the results of all the work done, and which I tried to convey in my report.

- We must be the first to notice problems before users do it.
- All aspects of optimization must be formalized before we begin to work, otherwise we may not optimize what we really need to optimize, or think that we have improved something, although in fact there has been no improvement.
- Time Profiler is a very cool thing, but it is not always enough and you need to use other tools, both supplied by Apple and generic swizzling types layoutSubviews.
- Well, of course, application performance monitoring should be part of the Continuous Integration process.
In conclusion, I’ll talk about the results of the work done from a product point of view, and not from the developer's point of view. Here is the launch of the application before and after the changes ( demonstrates the video ).

The video is slowed down 2 times for clarity. And we see that it has become better. Although slightly, but better. It is difficult to calculate the digital acceleration that we have achieved as a result of all the work, because work stretched out over a long period, while other tasks unrelated to it poured in. In addition, the measurement methodology was developed as we did it all, so there are no initial numbers, but an approximate comparison of “before and after” shows that we managed to reduce the launch time by about 30%.

There are also such beautiful statistics from our analysts, which show that the number of users whose launch has occurred in less than 2 seconds has increased 10 times during this time. It may not seem quite obvious how it increased by 10 times, if improved by only a third? But if we calculate the weighted average for all user groups, then we also get about an improvement of 40%, which coincides with the Time Profiler data.
Well, the most important indicators for mobile developers - retention and user satisfaction - also improved slightly. Here are the indicators of retention:

And negative reviews in the store.

Although it is difficult to draw conclusions from such minor fluctuations, it seems to us that the work on acceleration also contributed to this.
Everything that I did not manage to tell about in today's report, you can look in my article on this subject.
- Habrahabr
Record time: how we increased the launch speed of the Mail.Ru Mail application on iOS
bit.ly/2fgCzi5 - Medium
A record-breaking story of boosting the launch time of Mail.Ru's email app for iOS
bit.ly/2f9OnGu
Contacts
→ github
This report is a transcript of one of the best speeches at a professional conference of developers of highly loaded systems Highload ++ , and specifically - the section "Mobile Application Performance".
In a couple of weeks, we will have a whole conference on mobile development -
AppsConf . Here Yandex will tell about optimization of loading time on the example of Yandex.Maps. And the Mail.ru team will reveal the topic of optimizing the size of an iOS application , this time, using the example of ICQ.