How to remotely debug through WinDbg without including Windows debugging mode
- Tutorial
 Sometimes when analyzing a
 In such situations, using a virtual machine with a debugger connected to it helps (for example, GDB or IDA). This is if the program does not try to “break” in the virtual machine too.
If you are lucky and the program does not mind running in a virtual machine, then using GDB you can walk around its internals and even compare them with the source texts, if the binary contains debugging information in the DWARF format.


We look at the Windows kernel through WinDbg and GDB
If the program is built in Visual Studio, then GDB will not be able to show debugging information. You can also forget about the names of the Windows API functions in the listing. WinDbg could be useful here, but how can they connect to the virtual machine if the OS debugging mode does not suit us?
It would be great if there were a remote debugging interface in some virtual machine similar to that used by GDB, we thought and wrote such a module for the QEMU virtual machine. Everything is laid out in the form of sources and binaries for Windows , so that everyone can try to apply it.
About remote debugging using WinDbg there is already material on the geek magazine. It describes how to enable Windows debugging mode and use it to remotely connect WinDbg. The debugger connects through the virtual COM port associated with the named pipe of Windows.
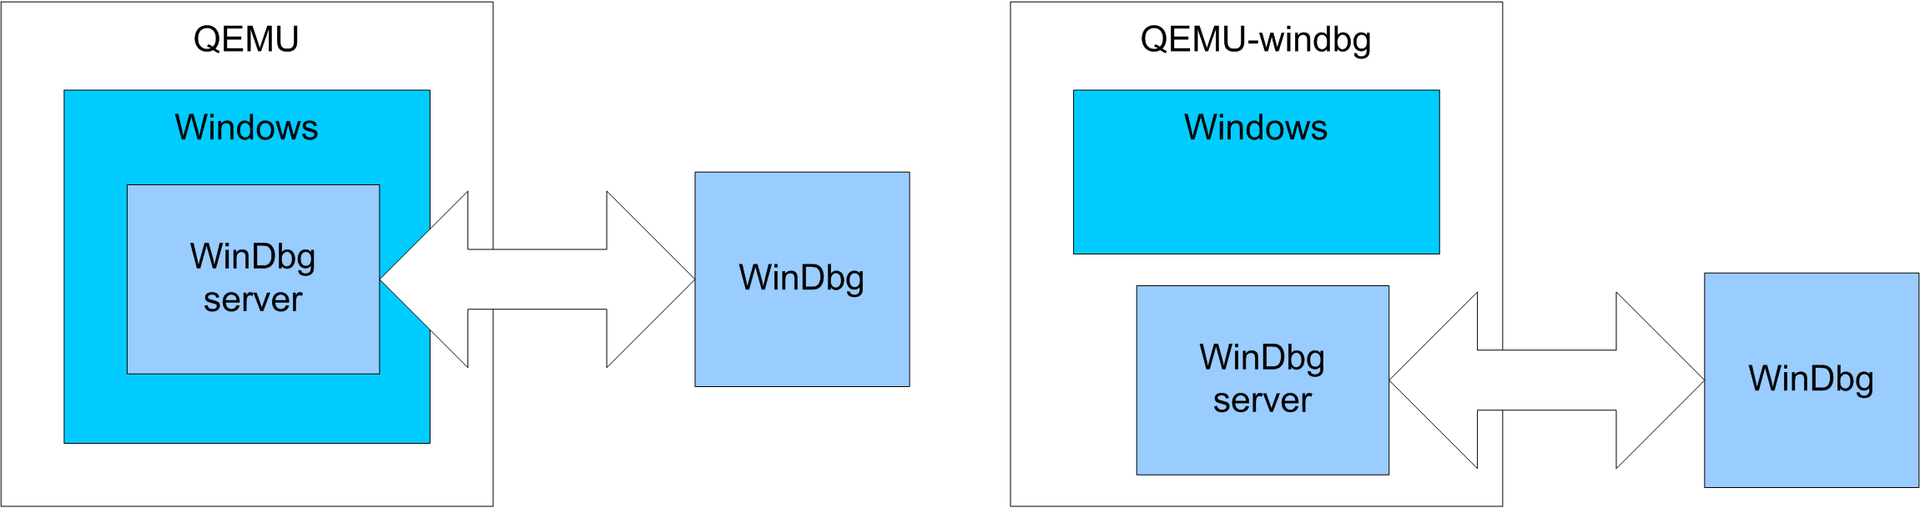
The usual powder against the debug server built into QEMU
In our case, QEMU without the participation of the guest system will connect to this named pipe to give the debugger information about what is happening inside Windows. The operating system itself does not know that it is being debugged, so debugging is obtained in some way hidden.
To start QEMU in this mode, you need the -windbg switch:
qemu-system-i386.exe -windbg pipe:windbg -hda disk.qcow2After that, QEMU will wait for the debugger to connect. You need to run it with the following command:
windbg.exe -b -k com:pipe,baud=115200,port=\\.\pipe\windbg,resets=0When the emulation starts, we select the operating mode without the Windows debugging module:

After a while, the OS initializes everything that is needed for the debugger to work, it will stop the emulator and prompts you to enter commands:

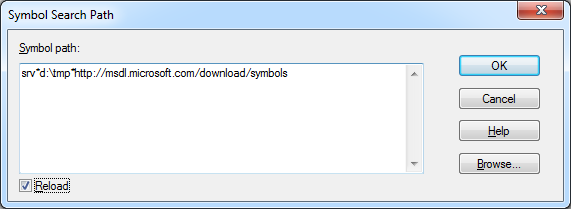
WinDbg immediately writes that no symbolic information was found:
Symbol search path is: *** Invalid ***Download symbolic information about system libraries can be a pair of .symfix and .reload commands. The same can be done through the menu File -> Symbol File Path ..., where you can specify the path to the temporary directory and Microsoft server srv * d: \ tmp * http: //msdl.microsoft.com/download/symbols
Now WinDbg will be Know the names of the internal structures and functions of Windows and the names of library functions. They are shown in listings, you can bind breakpoints to them, etc.
After that, we will continue loading the OS with the g command and run the necessary applications there
For example, the! Dlls command will show us a list of modules loaded in the current process:

The term “current process” appears when debugging is remote. After all, the OS constantly switches virtual address spaces that are tied to tasks. The! Dml_proc command displays a list of running processes:

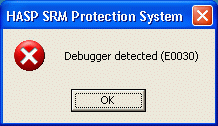
It can be seen that the CrashMe application is running on the system (I took it from the site www.windbg.info ). It did not find a running debugger in the system.

To debug this program, switch to its context using the .process command. Its parameter is the address of the EPROCESS structure, which is indicated in the first column of the! Dml_proc command output. You can verify that everything worked out with the command! Peb:

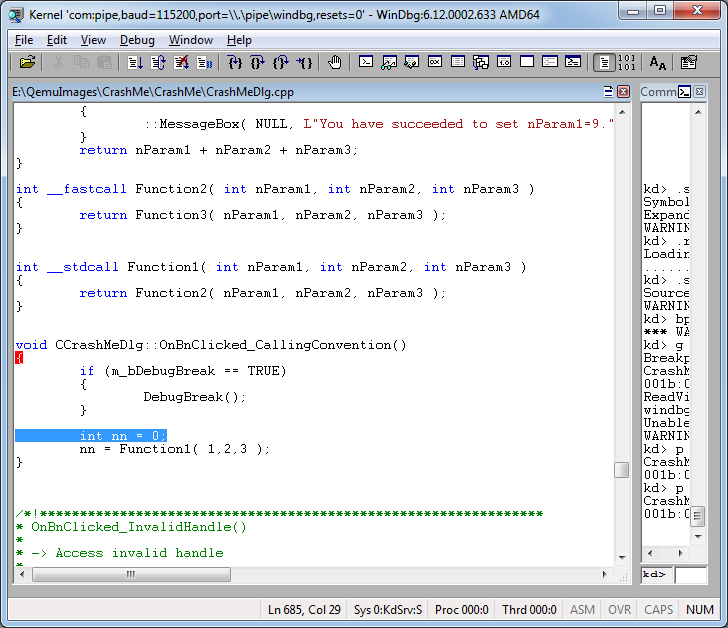
To make the debugging comfortable, load the symbolic information and indicate where the source code for this program is stored. After that, using the bp command, you can create a breakpoint:
.sympath+ E:\QemuImages\CrashMe\debug
.reload /user
.srcpath+ E:\QemuImages\CrashMe\CrashMe
bp CCrashMeDlg::OnBnClicked_CallingConvention
g
Now, when you click the “Test Calling Conventions” button on the application form, we will fall into the debugger:

Next, you can open the file with the source text:
Check the call stack:

Or examine local variables:

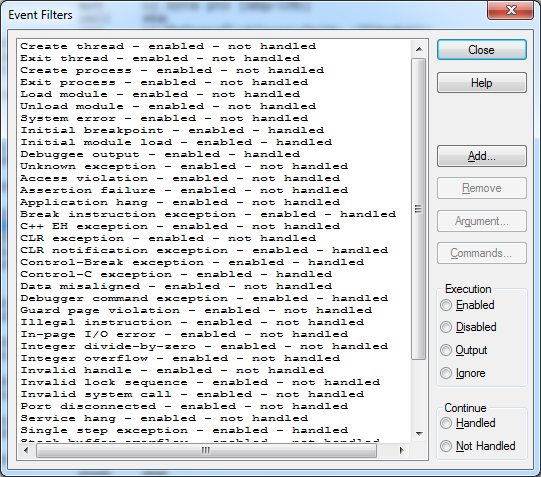
Another useful feature of WinDbg is event filters. You can put an interruption to various exceptional situations, to the event of loading a module or launching an application. Typically, messages about such events are sent by the debugging server in the guest system, and in WinDbg filters for them are configured in the Debug → Event Filters window:
We have not yet implemented interception of events and exceptional situations.
If int 3 or division by 0 is quite easy to understand at the emulator level, then much more work needs to be done to identify the creation of the process.
All other WinDbg functions should work well for 32-bit systems, but we have not really dealt with 64-bit so far, we are preparing patches so that all these functions are available to all QEMU users by default.
References
- Build QEMU for Windows with the possibility of a hidden connection WinDbg can be downloaded here
- If you are comfortable with the debug mode of Windows, then it is written how it can be used in QEMU
- And here the same thing about VirtualBox with an emphasis on driver debugging
- Description of some WinDbg commands and extensions
- Another list of teams
- A selection of links about WinDbg
- About debugging .NET applications in WinDbg