Functional safety, part 6 of 7. Evaluation of indicators of functional safety and reliability
Source
Continuing a series of publications on functional safety , in today's article we will consider how to quantify functional safety on the basis of statistics on random hardware failures. For this, the mathematical apparatus of the theory of reliability is used, which, as you know, is one of the applications of probability theory. Therefore, we will periodically refer to the provisions known from the theory of reliability.
We will consider the following issues:
- the relationship of the attributes of reliability, information and functional security;
- the transition from risk analysis to the measurement of functional safety indicators;
- Examples of calculating reliability and functional safety indicators.
Attributes of Reliability, Information and Functional Security
In order to better understand exactly what properties we will evaluate, we will consider the structure and the relationship of the attributes of reliability, information security and security.
Let's start by defining reliability. Reliability is the property of an object to maintain over time, within established limits, the values of all parameters characterizing the ability to perform the required functions in the specified modes and conditions of use, maintenance, storage and transportation. This can be demonstrated in a simple diagram. The system sets the service life, and the limit values of the parameters. As long as the parameters are within the specified limits, the system is operational and vice versa, if the parameters are outside the limits, then a failure occurs
(Figure 1).
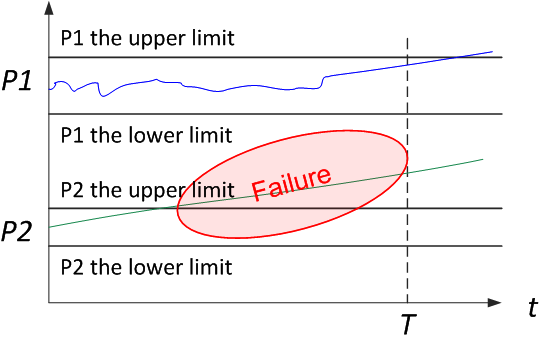
Figure 1. Graphical interpretation of the definition of reliability
The correlation of the properties of dependability and reliability should be said separately, since in the field of standardization of this property, Western and Soviet science at one time went in several different ways. The correct translation of the term reliability is dependability, since both reliability and dependability are considered as complex properties. Reliability is the correct translation for the term reliability, which is important, but still only one of the components of reliability. Reliability is the property of an object to continuously maintain a healthy state for some time or operating time, i.e. reliability can be generalized with reliability only for maintenance-free systems.
In addition to reliability, components of reliability include Maintainability, Durability, and Storability. Availability is a combination of uptime and maintainability.
All these provisions were set forth in one of the best in terms of harmony of presentation of standards that I have ever held in my hands, GOST 27.002-89 . “Reliability in technology. Basic concepts. Terms and Definitions". Unfortunately, the “non-selective” adaptation of Western standards as GOST R has led to the fact that the achievements of the Soviet school of reliability are now forgotten (at least in the field of formal standardization). In 2009, the standard GOST R 27.002-2009 was issued(the original number for some reason was GOST R 53480-2009, then historical justice triumphed), which is a copy-paste also quite an ancient dictionary of the International Electrotechnical Commission, IEC 60050-191: 1990. Progress is not always progressive, and you can judge the quality of the presentation yourself by comparing the presentation of the main terms (Figure 2). In Ukraine, DSTU 2860-94, corresponding to GOST 27.002-89, is currently operating.

Figure 2. Comparative analysis of the attributes of reliability according to versions of GOST 27.002
from 1989 and 2009
We emphasize that we are considering precisely random hardware failures, to which the mathematical apparatus of probability theory can be applied. Reliability theory gives a practical picture of the world in which it is possible to build reliable systems from not quite reliable components (as a rule, backup and diagnostic methods). The situation is different with systematic failures, which obviously cannot be described in the framework of the theory of reliability. It is these failures that make up the biggest problem, since they are unpredictable. In the 1980s and 90s, there were attempts to apply probabilistic models to assess software reliability, operator errors, and then information security indicators. Until now, this path has not yielded practically applicable results.
Another approach to the analysis of reliability attributes is the so-called RAMS approach, which stands for Reliability (Availability), Availability (Maintainability), and Safety (safety). Sometimes Integrity, integration or completeness is also added to this four attributes, because this is how this word is translated in the Russian version of IEC 61508. The simplest definitions for these properties are:
- Readiness is the suitability for proper operation;
- Reliability is the continuity of proper maintenance;
- Maintainability is the ability to undergo modifications and repairs.
- Security is the absence of catastrophic consequences for the user and the environment;
- Integration is the absence of inappropriate system changes.
Security (IS) is a collection of attributes of confidentiality, integration and readiness (the so-called CIA triad). Readiness or accessibility is considered for authorized actions to access information, and integration is considered for the correct work with data, excluding their unauthorized changes. Confidentiality is an additional attribute compared to reliability, which means the absence of unauthorized disclosure of information. Thus, the simplest model describing dependability (i.e. reliability) and security (i.e. information security) is represented by only six attributes (Figure 3).
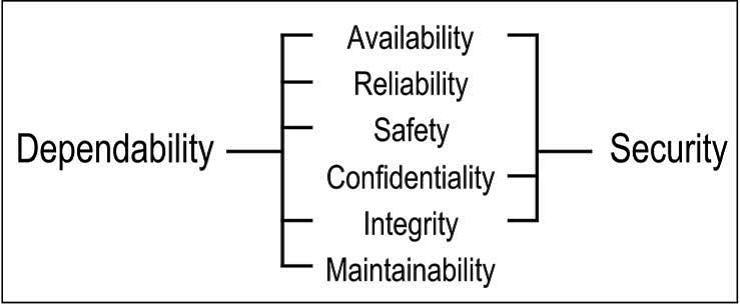
Figure 3. RAMS & CIA Attributes
Now we will do another iteration and try to present all the attributes we know in the form of a single diagram (Figure 4).
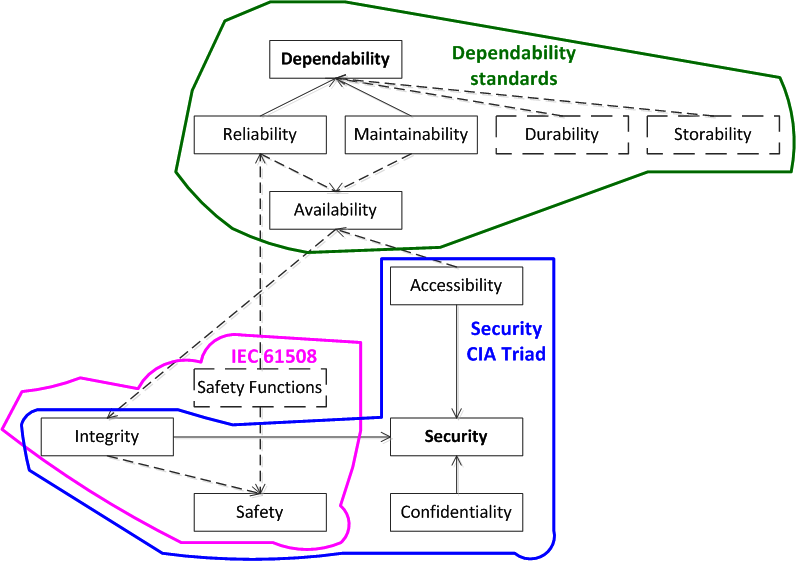
Figure 4. A generalized taxonomy of attributes of reliability, information and functional security
The usual lines indicate the attributes and relationships corresponding to the just considered model of six attributes. Dotted lines add additional attributes. One of the attribute groups relates to dependability components. FB (Safety), according to IEC 61508, includes safety functions & integrity, and, through safety functions, FB is associated with reliability, availability and reliability, and the integrated execution of functions provides a number of properties, including information security. Thus, between the attributes of reliability, information security and financial security, there is a mutual influence and certain relationships that we will take into account in the quantitative assessment.
Risk analysis and functional safety indicators
Now let's turn to safety indicators. The basic concept and indicator of FB is risk, which is a combination of the probability of an undesirable event and its consequences.
Risk assessment can be quantitative and qualitative, while qualitative, they operate in such categories as “high”, “medium”, “low”, etc.
If an undesirable event and damage from it are recorded, then the risk becomes numerically equal to the probability P (t) of occurrence of a fixed damage. For example, the risk of an accident in a nuclear power plant with the release of radioactive substances into the atmosphere today is established no more than 10 -7 1 / year.
The so-called ALARA (ALARP) principle (as low as reasonably applicable / practicable), an approach to risk management, which implies its maximum possible reduction achieved through actually available (limited) resources, is widely used for risk assessment and risk management (Figure 5) .
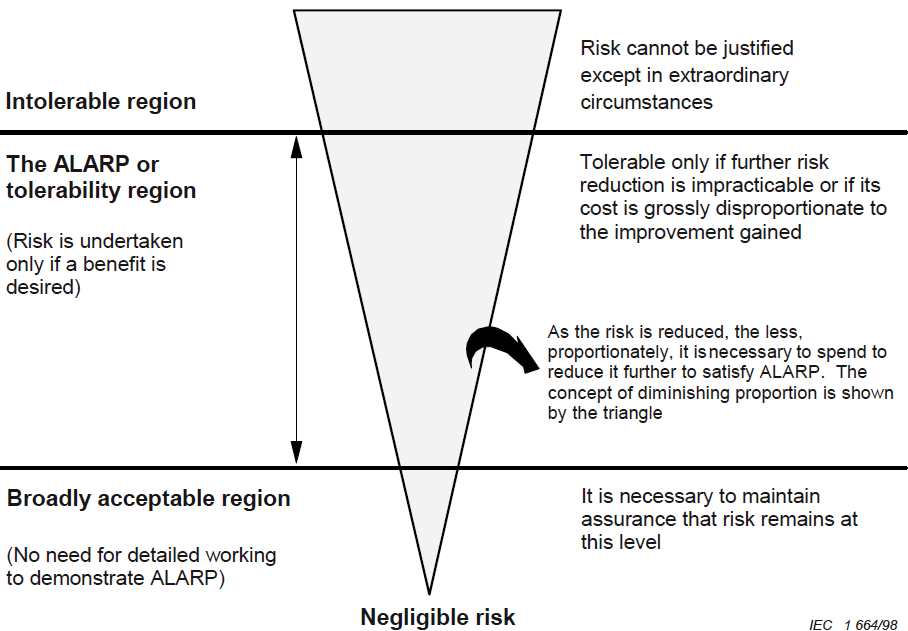
Figure 5. Risk reduction based on the ALARP method (as low as reasonably practicable), IEC 61508-5
A convenient model is the risk graph (Figure 6). An example is taken from the standard for industrial equipment safety (EN ISO 13849-1 Safety of machinery - Safety-related parts of control systems - Part 1: General principles for design). In addition to the likelihood and consequences of events, the possibility of avoiding dangers and damage was also taken into account. These three categories have a high and low value, as a result we get six combinations, each of which corresponds to one or another Performance Level (PL), from a to e, which is an analog of the Safety Integrity Level (SIL).
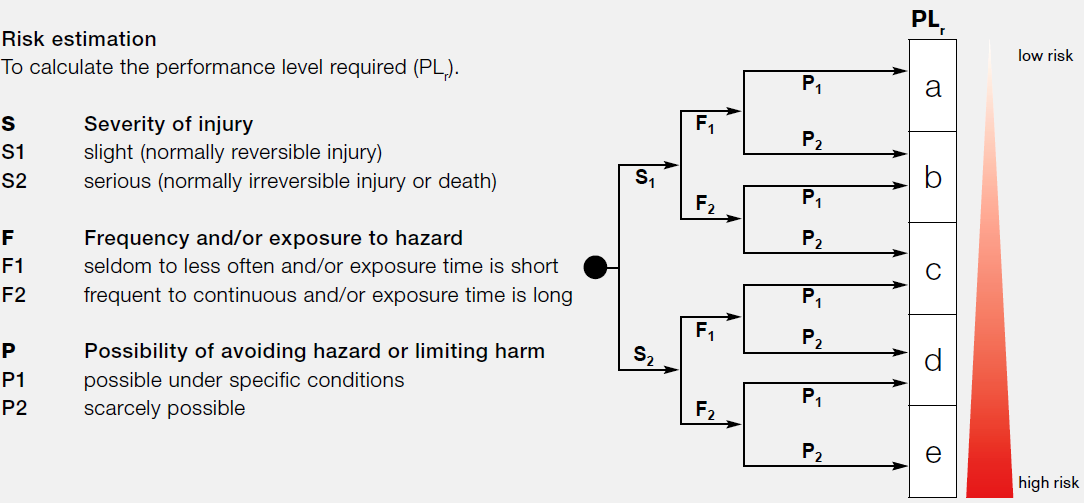
Figure 6. Risk graph, EN ISO 13849-1
This is a qualitative approach to risk assessment, now we will consider how quantitative values of safety indicators are standardized in IEC 61508. If we consider the control systems, then the events associated with the risk are failures of the safety functions, therefore it is logical that the failure probabilities for the safety functions are chosen as safety indicators.
Let us return to the basic concepts of reliability theory. Reliability theory is an applied field of probability theory, where the time to failure of a system is considered as a random variable.
One of the most important indicators is the probability of failure-free operation, which is understood as the probability that a failure will not occur within the set MTTF time, called MTBF: P (t) = P {MTTF> t}. Like any probability, the probability of failure-free operation takes values from 1 to 0, moreover, it is equal to unity at the initial moment of time, and equal to zero at time tending to infinity.
The probability of failure is the probability that the failure will occur within the set time T, i.e. the probability of failure complements the probability of failure-free operation to unity (failure either occurs or not, i.e. we have a complete group of events): F (t) = 1 - P (t).
Failure rate - conditional distribution density (i.e. time derivative) of the time between failures, provided that the failure has not occurred, has a dimension of 1 / hour:
 (t) = f (t) / P (t) = - [1 / P (t)] • [dP (t) / dt] = - [1 / (1 - F (t)] • [dF (t / dt]. In a statistical assessment, the failure rate is defined as the ratio of the number of failed products of the same type to the length of the time interval during which these failures were observed (for example, if 10 products failed in 1000 hours, then = 10/1000 = 0.01 1 / hour).
 An important assumption of the theory of reliability is the use of the so-called exponential distribution of time to failure, when the failure rate is considered constant in time.
MTTF MTBF is calculated as a certain integral ranging from zero to infinity for the probability of failure-free operation in time:
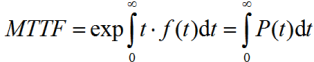
Sometimes MTTF is interpreted as the average or guaranteed operating time of the system, but this is not so, since the probability of failure-free operation at time MTTF is 1 / e, which is approximately 0.37. This means that for a single device, the probability that the device will remain operational after MTTF expires is only 0.37. For a group of devices of the same type, this means that only 37% of them will remain operational after MTTF expires.
The coefficient of availability (availability) is the probability that the object will be in working condition at an arbitrary point in time, except for the planned periods during which the use of the object for its intended purpose is not provided. The availability factor is calculated as the time between failures to the total time between failures (MTTF) and the average recovery time after failure (MTTR):
A = MTTF / (MTTF + MTTR).
To understand the relationship between reliability and safety, we turn to the classification of failures discussed in IEC 61508 (Figure 7). Failures can be dangerous and safe, as well as diagnosed and undiagnosed. In the framework of reliability, all types of failures are considered. From the point of view of safety, we are only interested in dangerous failures, and it is important that such failures be diagnosed, and if they are detected, the system could go into a safe state.
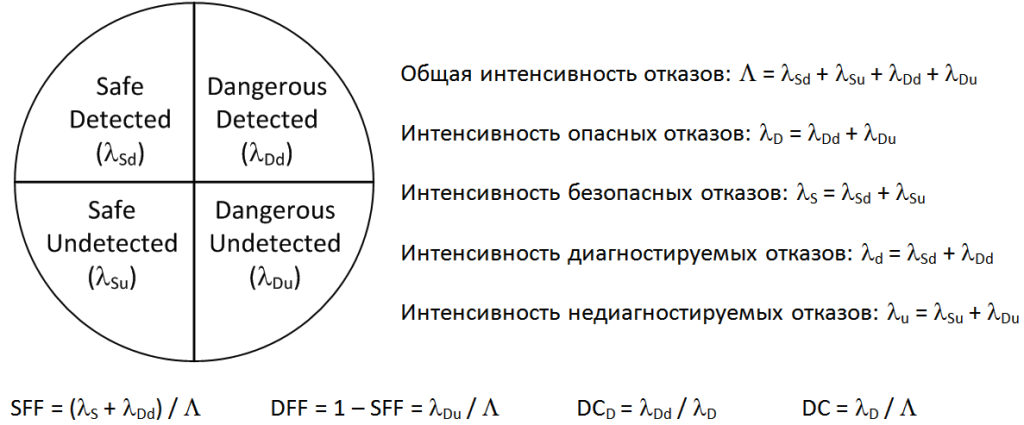
Figure 7. Failure classification and safety indicators according to IEC 61508
IEC 61508 indicates the following safety indicators.
Firstly, this is the so-called Hardware Fault Tolerance (HFT). This is a very simple indicator that indicates how many hardware failures can occur in the system before it fails. In fact, this is equivalent to the number of additional backup channels. That is, if the system is not reserved, then any failure will disable it, HFT = 0. If there are two backup channels in the system, then one of them is additional, redundant. After a single failure, the system will remain operational, i.e. HFT = 1, etc.
Secondly, the Safe Failure Fraction (SFF) should be determined. In terms of IEC 61508, this is the ratio of the intensity of safe and dangerous diagnosed failures to the total failure rate (see Figure 7). It turns out that the terms of IEC 61508 take into account, first of all, dangerous undiagnosed failures, and dangerous diagnosed failures in the share of safe failures belong to safe ones.
Accordingly, the fraction of dangerous failures (Dangerous Failure Fraction, DFF) can be determined, supplementing the fraction of safe failures to one and calculated as the ratio of the intensity of dangerous undiagnosed failures to the total failure rate (see Figure 7).
Diagnostic Coverage, DC D) in IEC 61508 is determined only on the basis of the intensity of dangerous failures, this is the ratio of the intensity of dangerous diagnosed failures to the intensity of dangerous failures (see Figure 7).
In technical diagnostics, the approach when the diagnostic coverage (DC) is defined as the ratio of the diagnosed failure rate to the total failure rate (see Figure 7) is more common. However, IEC 61508 declares diagnostic coverage based on the fraction of the reduction in the probability of dangerous failures due to the integrated diagnostics.
Based on the obtained Safe Failure Fraction value, the maximum achievable SIL safety integrity level can be determined, depending on the redundant or non-redundant configuration (Figure 8).

Figure 8. The maximum achievable SIL based on Safe Failure Fraction (SFF) and Hardware Fault Tolerance (HFT), IEC 61508-2.
For example, for the percentage of safe failures, 90% -99% for a non-redundant configuration (HFT = 0) can be SIL2 maximum safety integrity achieved. In a duplicated system (HFT = 1), SIL3 can be achieved, and in a ternary system, SIL4 (HFT = 2) can be achieved. Typically, such an approach is used by developers of PLCs and other equipment for safety control systems. Resistance to accidental hardware failures corresponds to the SIL2 level for a non-redundant configuration and the SIL3 level for a duplicate configuration. However, it should be remembered that in this case, the resistance to systematic failures due to the implementation of life cycle processes must also correspond to the SIL3 level.
Another gradation specified in IEC 61508 is the separation of equipment into types A and B (Type A & Type B). Type A includes the simplest, mainly mechanical and electrical components. All programmable electronic components are of type B.
In addition to the requirements considered, there are also requirements for the numerical values of safety indicators.
From the basic definitions of IEC 61508, we recall that there are three modes of operation of equipment: low demand (low demand mode), in which the frequency of requests for the security function does not exceed one per year, and high demand (high demand mode), in which the frequency of requests to perform the security function exceeds one per year, and continuous mode. It turns out that IEC 61508 recommends various reliability indicators for these modes.
For systems operating with a low frequency of requests, the average probability of a dangerous failure to perform the security function on demand should be determined as a target indicator (Figure 9). For safety integrity level SIL1, this value should not exceed 0.1. With an increase in SIL, each time the probability of a dangerous failure should be reduced by 10 times. Therefore, for SIL4 safety integrity level, the probability of a dangerous failure should be between 10 -5 to 10 -4 .
If we draw a parallel with the indicators we have already examined, then this indicator is equivalent to the unavailability coefficient, i.e. supplementing the availability factor to one. However, it should be remembered that we are not talking about all the failures, but only dangerous undiagnosed ones.
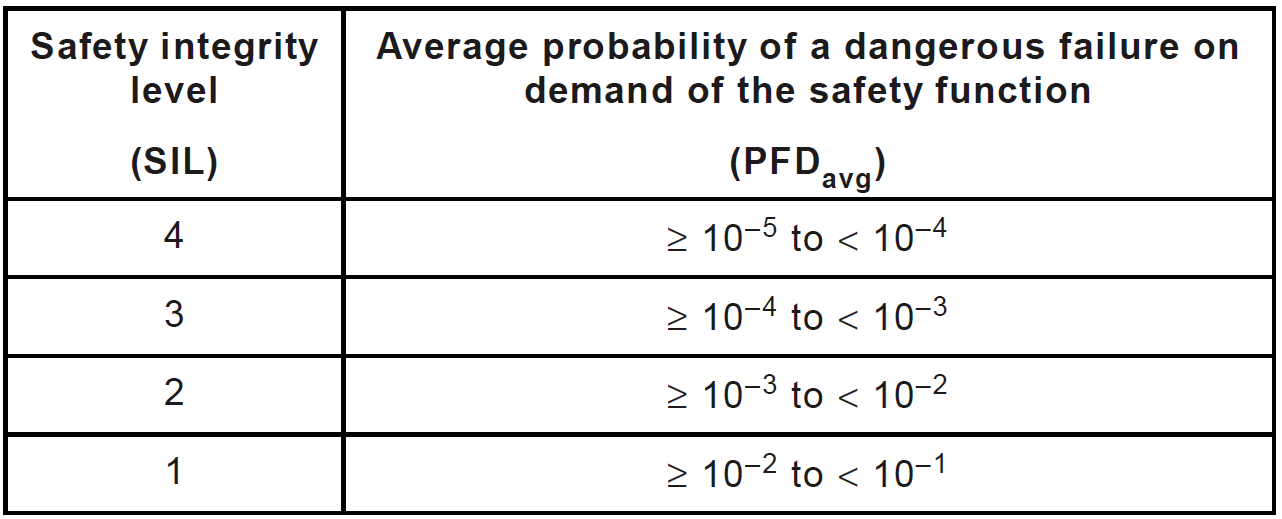
Figure 9. Dependence of the SIL level on the value of the average probability of a dangerous failure to fulfill the safety function on demand (low-demand mode), IEC 61508-1
For systems operating at a high request frequency or in continuous mode, the average frequency (or intensity) of dangerous safety function failures (Figure 10). For SIL1 safety integrity level, this indicator should not exceed 10 -5 1 / hour, which is equivalent to one failure in 11.4 years. With an increase in SIL, each time the intensity of a dangerous failure should decrease by 10 times. For SIL4 safety integrity level, the hazardous failure rate should be between 10 -9 to 10 -81 / hour, i.e., no more than one failure in 11,400 years. Of course, for a single system, this sounds somewhat absurd, but if you take into account that thousands of systems of the same type are operated in the world, even with such a low failure rate, dangerous failures are quite likely that we are seeing in reality.
This indicator is equivalent to the intensity of dangerous undiagnosed failures.
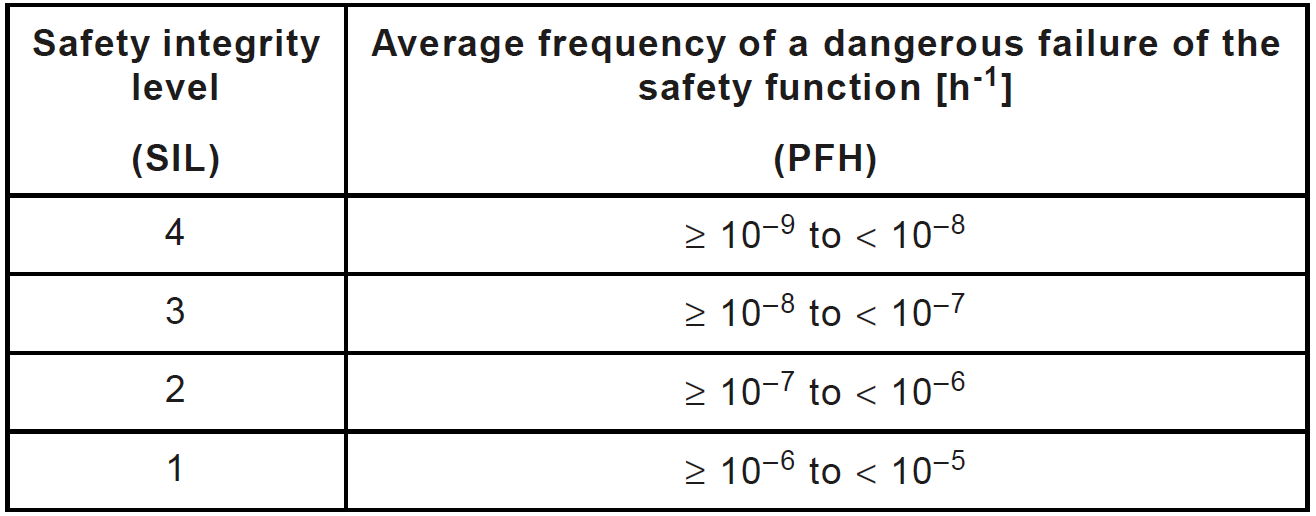
Figure 10. Dependence of the SIL level on the value of the average intensity of dangerous failures of the safety function (high-frequency mode and continuous mode), IEC 61508-1
All tasks of calculating safety indicators are linked together within the framework of the methodology for analyzing the types, consequences and criticality of failures (Failure Mode, Effect and Criticality Analysis, FMECA). The main points of this technique are described in IEC 60812: 2006, Analysis techniques for system reliability - Procedure for failure mode and effects analysis (FMEA). In the Russian Federation, GOST R 51901.12-2007 “Risk management. Method for the analysis of the types and consequences of failures ” , which is an adaptation of IEC 60812.
The initial data for FMECA can be obtained by applying methods such as structural diagrams of reliability, analysis of the fault tree, and Markov analysis.
Examples of calculating functional safety and reliability indicators
Now let us consider a few examples on the definition of safety performance, I have several adapted based on the examples given in the "Guide to engineer PCS" YN Fedorova.
Let it be necessary to calculate the safety of a simple process control system. We have a tank (for example, a boiler) with a pressure sensor into which some liquid is supplied through the pipe (Figure 11). If the preset pressure level is exceeded, the shut-off valve must be activated and the fluid supply to the tank is shut off. To process the signal from the sensor and issue a response signal to the valve, a programmable logic controller (PLC) is used. For the specifics, we set the probability of failure, let for the sensor and valve we have a probability of failure of 10 -3. To make it more convenient to study approaches to redundant field equipment, we put the PLC out of the “brackets”, i.e. we will assume that the PLC is absolutely reliable and we will not take its influence into account.
Regarding equipment failures, it should be noted that they can be of two types, firstly, a dangerous failure, that is, failure when the equipment should work, and secondly, a false failure, that is, operation when the equipment should not work. For both types of failure we have the same probability.
Now let's say a few words about one of the gaps in IEC 61508. It turns out that IEC 61508 does not put forward any requirements for the reliability and availability of control systems, it contains requirements only for safety. It would seem that this is one and the same, the more reliable the system, the safer it is. However, this is not entirely true; the system that is constantly in a safe state, that is, does not function, is absolutely safe. Engineering tasks for the development of security systems include the optimization of safety indicators (probability of a dangerous failure) and availability (probability of false positives). In our example, we will consider the simplest architectures of control systems in terms of the probabilities of dangerous failures and false alarms.
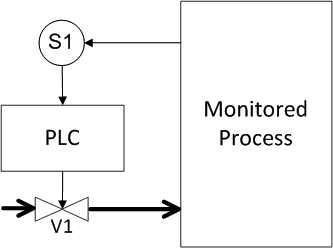
Figure 11. Example 1: Unreserved system
Determine the probability of a dangerous failure and the probability of a false positive (response under the spoiler)
The answer for Figure 11
A dangerous failure occurs when either the sensor or the valve fails. In this case, the probabilities add up, that is, for the system, the probability of a dangerous failure is 2 • 10 -3 . The probability of a false positive is determined by exactly the same pattern of events and is also equal to 2 • 10 -3 .
Now we define the probabilities for various types of reservations. First, we introduce the redundancy for the sensor (Figure 12). We assume that the redundant components are identical, that is, the probability of their failure is equal. Try to determine what are the probabilities of a dangerous failure and a false positive for this case?
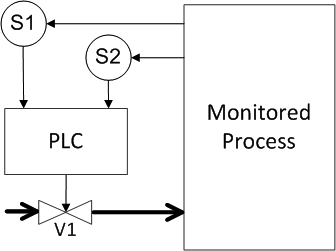
Figure 12. Example 2: Redundancy of sensors
Determine the probability of a dangerous failure and the probability of a false positive (answer under the spoiler)
The answer for Figure 12
A dangerous failure occurs when either sensor or valve fails. The probabilities of sensor failures are multiplied because both failures must occur for a failure. Then the multiplication result is added with the probability of valve failure, we get as a result 10 -6 + 10 -3 = 1.001 • 10 -3 , that is, a value close to 10 -3 . Thus, redundancy of only one system component allowed halving the probability of dangerous failures. Now, what happens with false positives? The probability of false positives has increased by one and a half times in comparison with the original scheme, since false positives can occur for any of the three components, therefore, the probabilities add up and get 3 • 10 -3.
Now let's look at what happens if the valve is not reserved for the sensor, but for the valve (Figure 13)? What are the probabilities equal?
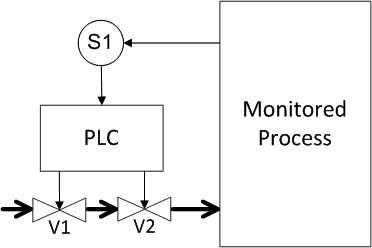
Figure 13. Example 3: Valve redundancy.
Determine the probability of a dangerous failure and the probability of a false positive (response under the spoiler)
The answer for Figure 13
As expected, the result is identical to the previous reservation scheme, the probability of dangerous failures is 1.001 • 10 -3 , the probability of false positives is
3 • 10 -3 .
3 • 10 -3 .
Now we will consider the scheme where both sensors and valves are reserved. We assume that according to the data of each of the sensors, a control signal is generated for each of the valves (Figure 14). What do we get?
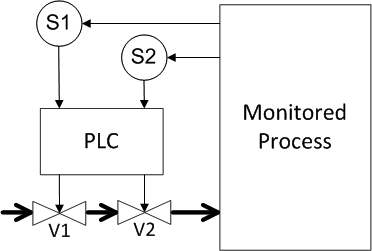
Figure 14. Example 4: Redundancy of sensors and valves (1st method)
Determine the probability of a dangerous failure and the likelihood of a false positive (answer under the spoiler)
The answer for Figure 14
A dangerous failure will occur if both sensors or both valves fail. Thus, the failure probabilities for the sensors and for the valves are multiplied, and these results add up, we get
2 • 10 -6 , i.e. we have reduced the likelihood of dangerous failures by 1,000 times compared to the original unreserved system. But a false positive will occur when any of the components of the system, i.e. all the failure probabilities add up and we get 4 • 10 -3 . Those. Paradoxical as it may sound, but in the security system, redundancy reduced the availability of the system by half compared with the original system.
2 • 10 -6 , i.e. we have reduced the likelihood of dangerous failures by 1,000 times compared to the original unreserved system. But a false positive will occur when any of the components of the system, i.e. all the failure probabilities add up and we get 4 • 10 -3 . Those. Paradoxical as it may sound, but in the security system, redundancy reduced the availability of the system by half compared with the original system.
For the shut-off valve, another type of redundancy is possible when they are installed in parallel, and then the product flows into the tank when both valves have tripped (Figure 15). How in this case to determine the probabilities of a dangerous failure and a false positive?
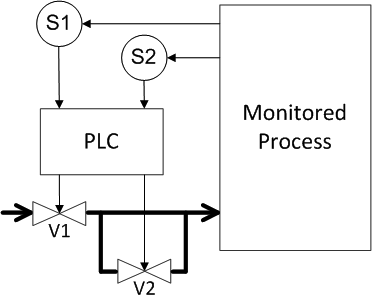
Figure 15. Example 5: Redundancy of sensors and valves (2nd method)
Determine the probability of a dangerous failure and the likelihood of a false positive (answer under the spoiler)
The answer for Figure 15
A dangerous failure occurs when both sensors or any of the valves fail. The probabilities of sensor failure are multiplied, the probabilities of valve failure are added. As a result, we get the probability of a dangerous failure of 2.001 • 10 -3 . For the probability of false positives, the probabilities of sensor failure are added up, the probability of valve failure is multiplied, and we get the probability of false positives also equal to 2.001 • 10 -3 . If we compare with the original scheme, then again we get a paradox, we introduced redundancy, doubled the volume of equipment, but did not get any gain.
Thus, in security systems, it is necessary to analyze not only safety indicators, but also reliability indicators and select structures taking into account the entire set of available information. Otherwise, the system will be safe, but its operation may not be economically feasible.
conclusions
Today we examined how the quantitative assessment of FB indicators is carried out.
Functional security attributes, which include security features and security integrity, are part of a larger attribute system, which also includes information security and reliability.
Functional security indicators are also associated with information security and reliability indicators. When developing security systems, it is necessary to conduct a comprehensive analysis of measurable indicators and identify possible contradictions between properties where optimization is required and a compromise is found.
When assessing and ensuring information security, probabilistic indicators can be used, first of all, to analyze the availability (readiness) of certain physical devices.
Risk is a universal indicator of functional safety. Depending on the type of system, the risk can be transformed into the target value of the availability coefficient and failure rate, which vary depending on the SIL safety integrity level.
Failure Mode, Impact, and Criticality Analysis (FMECA) is the most effective approach for quantifying and qualitatively evaluating safety.
PS To explain the main aspects of functional safety, the following series of articles
is being developed: - Introduction to the topic of functional safety;
- IEC 61508 standard: terminology ;
- IEC 61508 standard: requirements structure ;
- The relationship between information and functional safety of industrial control systems ;
- Processes of management and assessment of functional safety ;
- The life cycle of information and functional security ;
- Theory of reliability and functional safety: basic terms and indicators ;
- Methods for ensuring functional safety .
Here you can watch video lectures on the topic of publication.