Microservices: experience in a busy project

At the HighLoad ++ 2016 conference, M-Tech development manager Vadim Madison talked about growth from a system for which a hundred microservices seemed like a huge number to a busy project where a couple of thousand microservices were commonplace.
The topic of my report is how we launched microservices in production on a rather busy project. This is a kind of aggregated experience, but since I work at M-Tech, let me tell you a few words about who we are.
In short, we are engaged in video output - we give video in real time. We are a video platform for NTV-Plus and Match TV. These are 300 thousand simultaneous users who resort in 5 minutes. This is 300 terabytes of content that we give out per hour. This is such an interesting task. How to serve all this?
What is this story about? This is about how we grew, how the project developed, how there was some rethinking of some of its parts, some kind of interaction. One way or another, this is about scaling up a project, because it’s all in order to withstand even more load, to provide customers with even more functionality and at the same time not to fall, not to lose key characteristics. In general, so that the client is satisfied. Well, a little about what path we went. Where did we start.

Here is such a starting point, some kind of starting point, when we had 2 servers in the Docker cluster. Then the databases were launched in the same cluster. There was no such highlight in our infrastructure. The infrastructure was minimal.
If you look at what was basic in our infrastructure, then this is Docker and TeamCity as a system for delivering code, assemblies, and so on.
The next milestone - what I call the middle of the road - was a fairly serious project growth. When we already had 80 servers. When we built a separate dedicated cluster for databases on special machines. When we started moving to CEPH-based distributed storage. When we began to think that it might be time to reconsider how our services interact with each other, and came close to the idea that it was time for us to change our monitoring system.
Well, actually what we have come to now. There are already several hundred servers in the Docker cluster - hundreds of running microservices. Now we have come to the point that we are beginning to divide our system into certain service subsystems at the data bus level, at the level of logical separation of systems. When there were too many of these microservices, we began to split up the system in order to better serve it, to better understand.
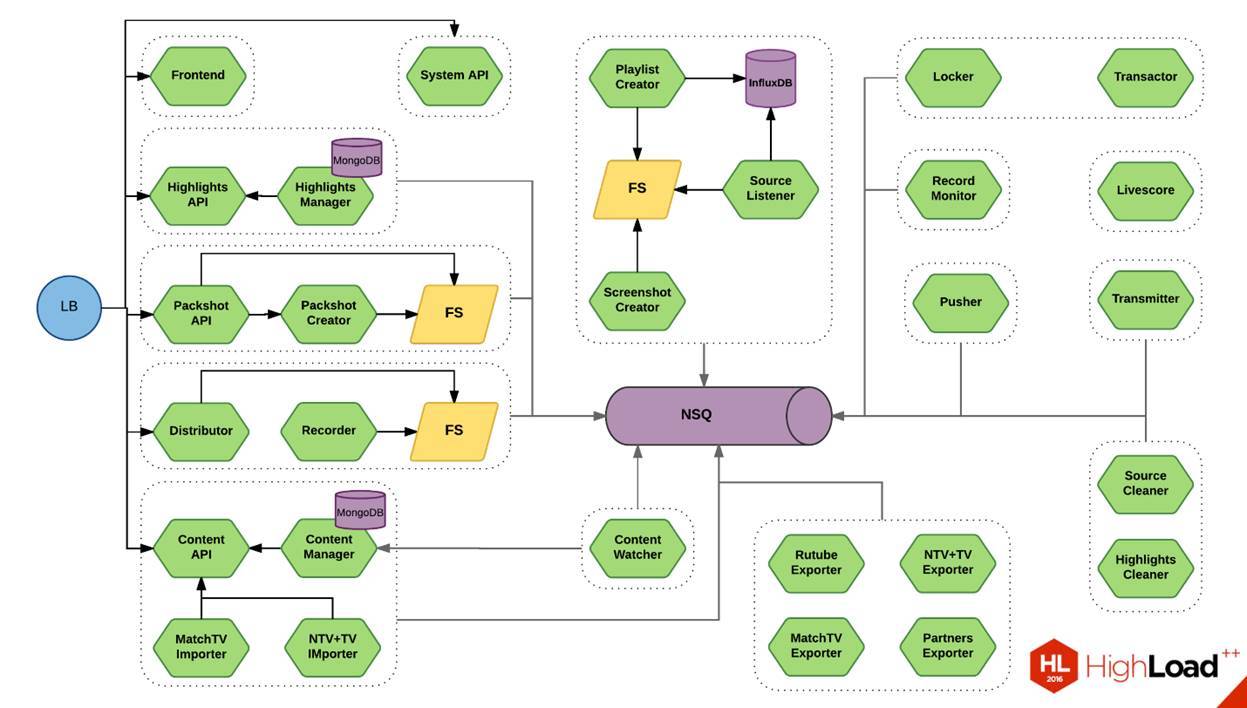
Now on the screen you see a diagram. This is one small piece of our system. This is a thing that allows you to slice a video. I showed a similar scheme six months ago at RIT ++. Then there were, in my opinion, 17 green microservices. Now there are 28 of them. If you look approximately, this is 1/20 of our system. You can imagine an approximate scale.
Details
One of the interesting points is the transport between our services. Classically begin with the fact that transport should be as efficient as possible. We also thought about it, decided that protobuf is our everything.
It looked something like this:
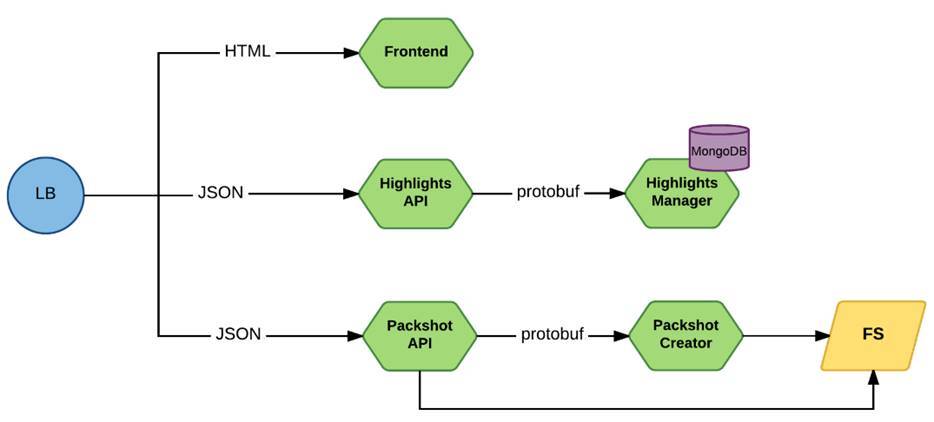
Request via Load Balancer comes to front-line microservices. This is either Frontend, or services that provide the API directly, they worked through JSON. And requests to internal services went through protobuf.
Protobuf itself is such a pretty good thing. It really gives a certain compactness in messaging. Now there are already quite fast implementations that allow serializing and deserializing data with minimal overhead. You can consider it a conditionally typed request.
But if you look in the context of microservices, it is noticeable that between the services you get a kind of proprietary protocol. As long as you have 1, 2, or 5 services, you can easily issue a console utility for each microservice, which will allow you to access a specific service and verify that it returns. If he blunted something - yank it and see. This somewhat complicates the work with these services in terms of support.
Until some stage, this was not some serious problem - there were not many services. Plus, the guys from Google have unveiled gRPC. We saw that, in principle, for our purposes at that time he did everything that we needed. We slowly migrated to it. And bams - another thing has appeared in our stack.
Here is also a rather interesting detail in the implementation. This thing is based on HTTP / 2. This is the thing that really works out of the box. If you do not have a very dynamic environment, if your instances do not change, do not move around the cars often enough, then this, in general, is a good thing. Moreover, at the moment there is support for a bunch of languages - both server and client.
Now if you look at it in the context of microservices. On the one hand, a thing is good, but on the other, it is a thing in itself. To the extent that when we began to standardize our logs in order to aggregate them in a single system, we were faced with the fact that logs cannot be directly obtained from gRPC in a convenient form.
As a result, we came to the conclusion that we wrote our own logging system, slipped it into gRPC. She did parsing of messages issued through gRPC, brought them to our mind, and then we could put this into our logging system normally. And plus the situation when you first describe the service and the types of this service, then compile them, it increases the dependence of services among themselves. For microservices, this is a problem, the same as some complexity of versioning.
As you probably already guessed, in the end we came to the conclusion that we began to think about JSON. Moreover, we ourselves for a long time did not believe that after some compact, conditionally binary protocol, we would suddenly return to JSON until we came across an article from the DailyMotion guys who wrote about the same thing: “Damn, we can cook too JSON, everyone
knows how to cook it, why do we create additional difficulties for ourselves? ” As a result, we gradually began to migrate from gRPC to JSON in a certain implementation. That is, yes, we left HTTP / 2, we took fast enough implementations to work with JSON.
Got all the buns we have. We can access our service through cURL. Our testers use Postman, and they are doing fine too. At any stage of working with these services, everything became simple for us. This is the thing that, on the one hand, is a controversial decision, and on the other, it really helps a lot in maintenance.
By and large, if you look at JSON, then the only real minus that you can show it right now is the lack of compactness of this description. Those 30%, which, according to statistics, are the difference between the same MessagePack or something else, in fact, according to our measurements, the difference is not so big, and it is also not always so critical when we talk about a supported system.
Plus, with the transition to JSON, we got additional buns. Such as, for example, protocol versioning. At some point, the situation began to develop that through the same protobuf we are describing some new version of the protocol. Accordingly, customers, consumers of this particular service, must also move to it. It turns out that if you have several hundred services, even 10% of them should move. This is already a big cascading effect. You have changed in one service, and another 10 need to be redone.
As a result, we began to have a situation when the developer of this service released the fifth, sixth, and seventh versions, but in reality the load in production still goes to the fourth, because developers of related services have their deadlines and priorities. They simply do not have the ability to constantly rebuild the service, move to a new version of the protocol. It actually turned out that new versions are released, but they are not in demand. But bugs in older versions we have to implement in some obscure ways. This complicated the support.
As a result, we came to the conclusion that they ceased to produce protocol versions. We fixed some basic version, within which we can add some property, but within some very limited limits. And consumer services began to use the JSON scheme.
This is what it looks like:
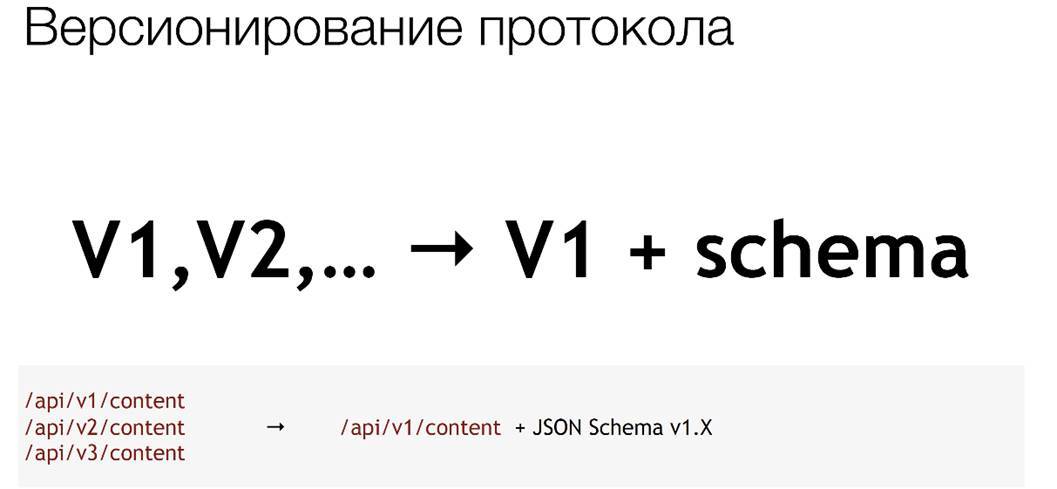
Instead of 1, 2 and 3, we have version 1 and the scheme that applies to it.
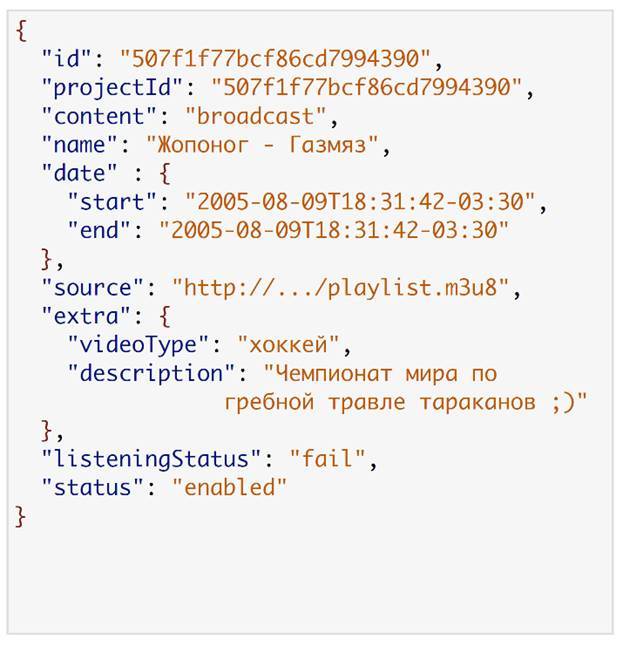
Here is a typical answer from one of our services. This is Content Manager. He gave out broadcast information. Here, for example, is a diagram of one of the consumers.
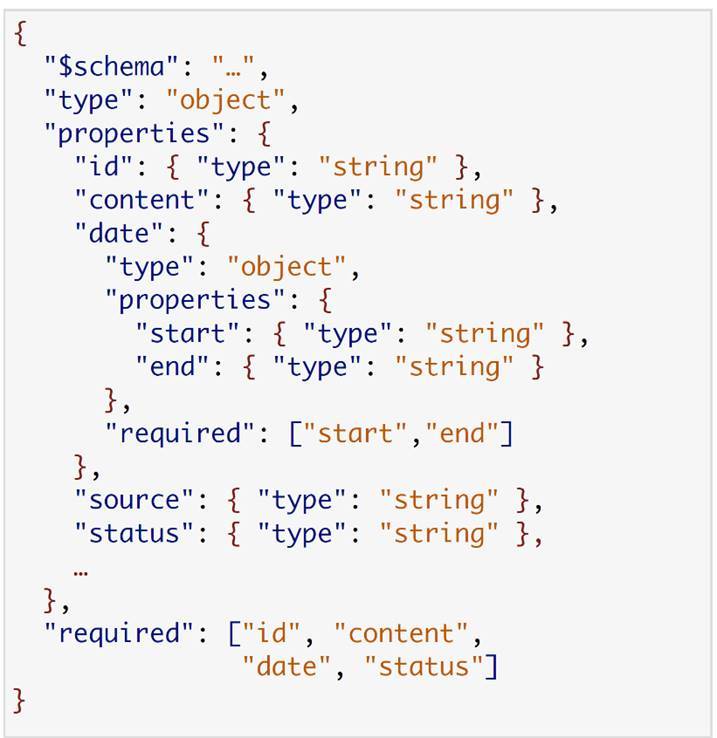
Here the most interesting line is the bottom one, where we have the required block. If we look, we will see that this service actually needs only 4 fields from all this data - id, content, date, status. If you really apply this scheme, then in the end the customer service needs only this data.
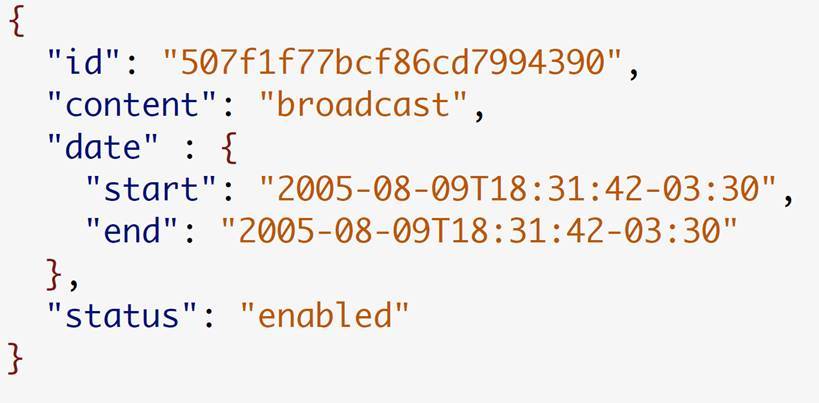
They really are in every version, in every variation of the first version of the protocol. This simplified the move to new versions. We began to release new releases, and consumer migration to them was greatly simplified.
The next, important moment that arises when we talk about microservices, and, in general, about any system. It's just that in microservices it feels stronger and faster than anything. These are situations when the system becomes unstable.
When you have a call chain of 1-2 services, then there are no special problems. You do not see any global difference between a monolithic and a distributed application. But when your chain grows to 5-7, at some point something fell off of you. You really don't know why it fell off, what to do about it. Debugging is quite difficult. If at the level of a monolithic application you turned on debugger, just went through the steps and found this error, then here you have such factors as network instability, unstable performance under load, and something else. And such things - in such a distributed system, with a bunch of such nodes - become very noticeable.

Then, in the beginning, we went the classic way. We decided to monitor everything, to understand what and where it breaks, to try to somehow deal with it quickly. We started sending metrics from our microservices, collecting them into a single database. We began to collect data on machines through Diamond, what happens to them through сAdvisor. We began to collect information on Docker containers, merge all this into InfluxDB and build dashboards in Grafana.
And now we have 3 more bricks in our infrastructure, which is gradually growing.
Yes, we have become more aware of what is happening with us. We began to respond more quickly to the fact that something fell apart. But it did not stop falling apart from this.
Because, oddly enough, the main problem with microservice architecture is that you have services that are unstable. It works, it does not work, and there may be many reasons for this. Up to the point that your service is overloaded, and you send an additional load to it, it goes down for some time. After some time, due to the fact that he does not serve everything, the load drops from him, and he begins to serve again. Such leapfrog leads to the fact that such a system is very difficult to maintain, and to understand what is wrong with it.
As a result, we gradually came to the conclusion that it is better that this service falls than it jumps like this. This understanding led us to the fact that we began to change our approach to how we implement our services.
The first of the important points. We began to introduce a restriction on incoming requests into each of our services. Each service we began to know how much it is able to serve customers. How does he know this, I'll tell you a little later. All those requests that are above this limit or near its borders, he ceases to accept. It issues an honest 503 Service Unavailable. Anyone who addresses him understands that they need to choose another node - this one is unable to serve.
Thus, we reduce the request time if something is wrong with the system. On the other hand, we increase its stability.
Second moment. If rate limiting is on the side of the destination service, then the second pattern that we began to introduce everywhere is Circuit Breaker. This is a pattern that, roughly speaking, we implement on the client.
Service A, he has as possible points of access, for example, 4 instances of service B. So he went to the registry, said: "Give me the addresses of these services." Got them 4 pieces. I went to the first one, he answered him that everything is ok. The service marked “yes”, you can go to it. According to Round Robin, he scatters appeals. Went to the second, he did not answer him for the right time. That's all, we ban him for some time and go to the next. That, for example, returns an incorrect version of the protocol with us - no matter why. He also bans him. Goes to the fourth.
As a result, 50% of the services are obtained, they are really able to help him serve the client. He will go to these two. Those two who for some reason did not suit him, he bans for a while.
This allowed us to seriously improve the stability of the work as a whole. Something is wrong with the service - we shoot it, an alert rises that the service was shot, and we further figure out what could be wrong.
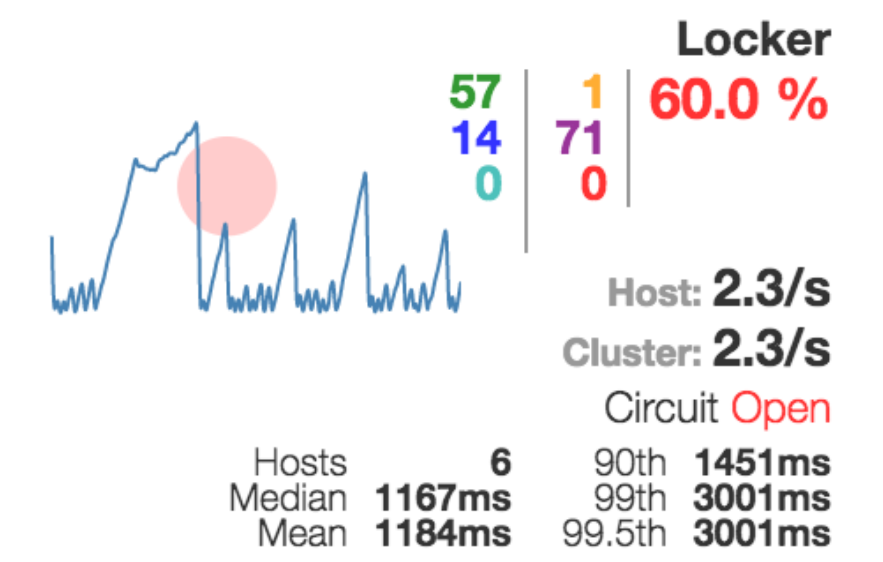
In response to the introduction of the Circuit Breaker pattern, we have one more thing in our infrastructure - this is Hystrix.
The guys from Netflix not only implemented support for this pattern, but also made it clear how to understand if something is wrong with your system:
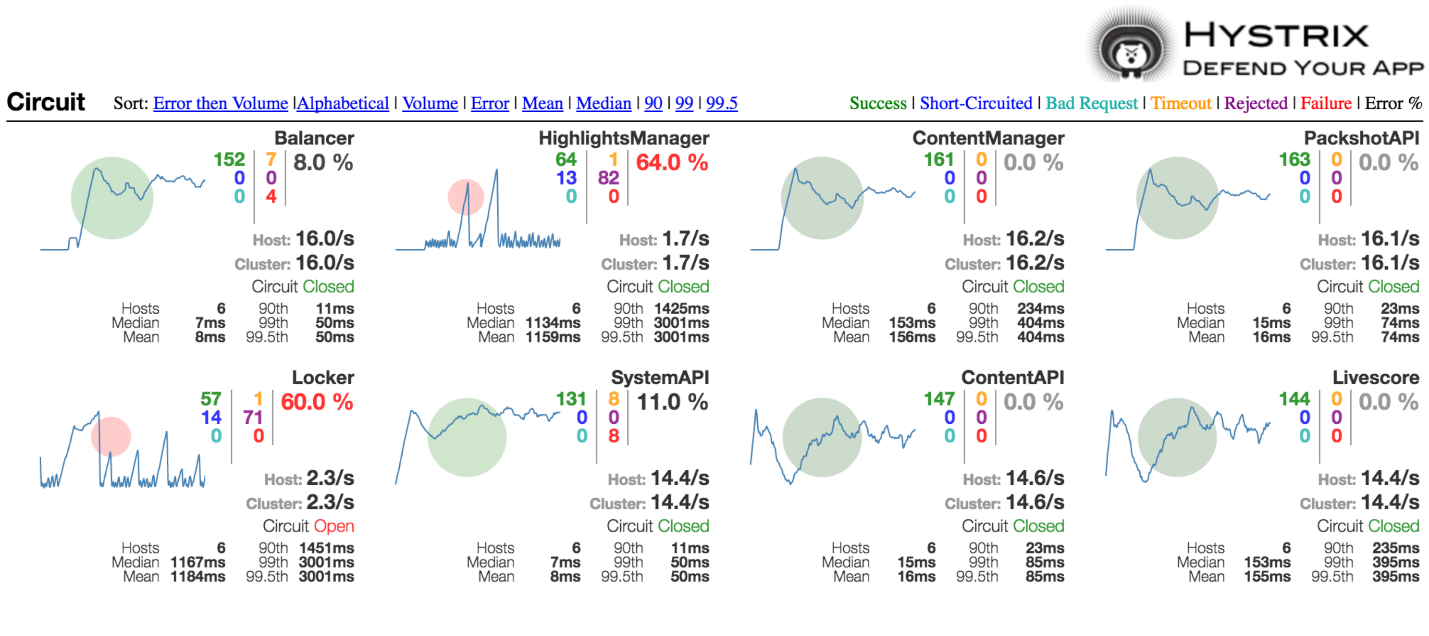
Here, the size of this circle shows how much traffic you have relative to others. Color indicates how good or bad the system is. If you have a green circle, then, probably, everything is fine with you. If red - not everything is so rosy.
It looks something like this when your service needs to be completely shot. A switch worked on it.
We have achieved that our system has become more or less stable. We have at least two instances of each service so that we can switch by firing one or the other. But this did not give us an understanding of what is happening with our system. If something somewhere along the way fell off during the execution of the request, then how to understand this?
Here is a standard query:
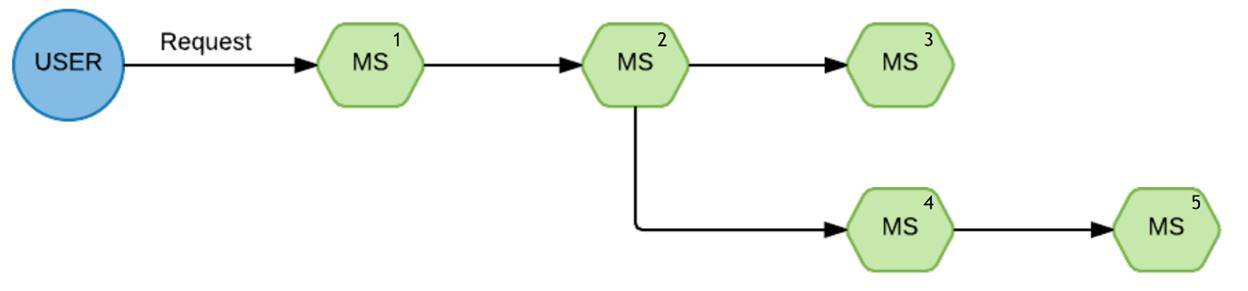
Such a chain of execution. A request came from the user for the first service, then for the second, from the second he diverged into the third and fourth branches.
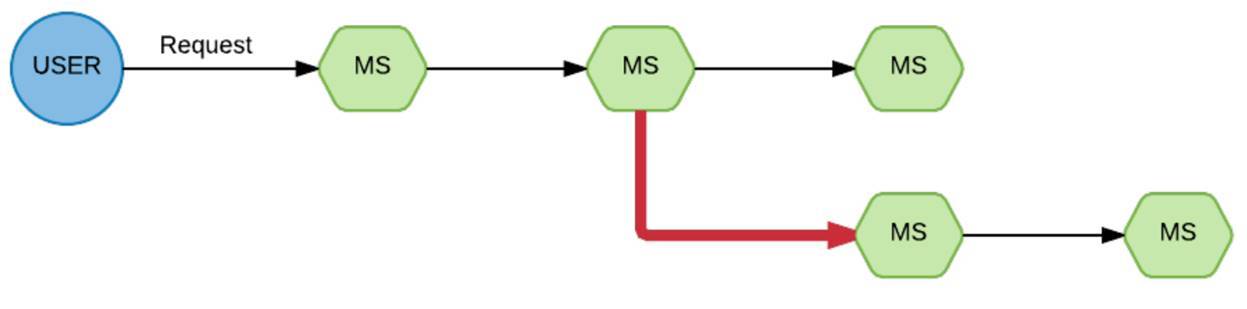
Bam, and we have one of the branches dropped. It’s really not clear why. When we faced this situation and began to figure out what to do here, how we can improve the visibility of the situation, we came across such a thing as Appdash. This is a trace service.

It looks like this:
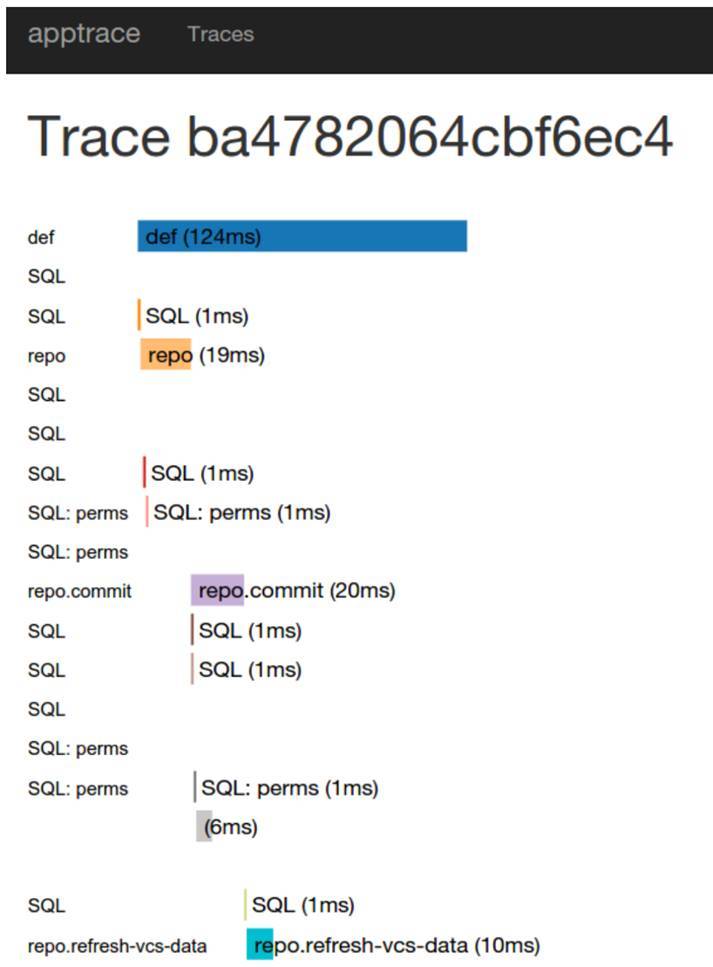
I’ll say right away, it was a thing to try, to understand whether it was. It was the easiest to implement it in our system, because by that time we had switched quite tightly to Go. Appdash had a library ready to connect. We saw that yes, this thing helps us, but the implementation itself does not suit us very much.
Then instead of Appdash, we got Zipkin. This is the thing that the guys from Twitter did. It looks something like this:
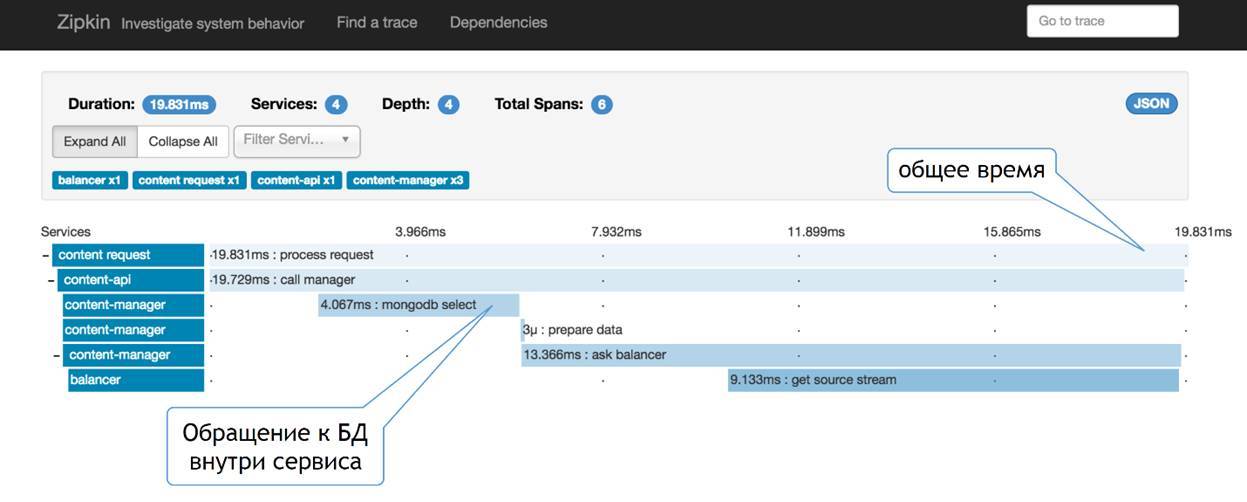
It seems to me a little more clearly. Here we see that we have a certain number of services. We see how our request goes through this chain, we see how much of this request eats away in each of the services. On the one hand, we see some common time and division by services, on the other - no one bothers us here to add information about what is happening inside the service in the same way.
That is, some kind of payload, accessing the database, subtracting something from the file system, accessing the caches - all this can be added and viewed in the same way here, which in your request could most add time to this request. The thing that allows us to do this forwarding is through TraceID. I’ll talk about him a little further.

That's how we began to understand what is happening in a particular request, why it suddenly falls for a particular client. All is well and all of a sudden someone is wrong. We began to see a certain basic context and understand what is happening with the service.
Not so long ago, a standard was developed for the trace system. Just some kind of agreement between the main suppliers of trace systems on how to implement the client API and client libraries in order to make this implementation as simple as possible. Now there is already an implementation through Opentracing for almost all major languages. You can safely use it.
We learned to understand which of the services suddenly did not allow us to serve the client. We see that some of the parts have blunted, but it is not always clear why. The context is inadequate.
We have logging. Yes, this is a fairly standard thing, this is ELK. Maybe in our small variation.

We do not collect directly through the heap forward in the form of Logstash. We first pass this to Syslog, using Syslog we aggregate this on the collecting machines. From there, through forward we put in ElasticSearch and in Kibana. Relatively standard thing. What is the trick?
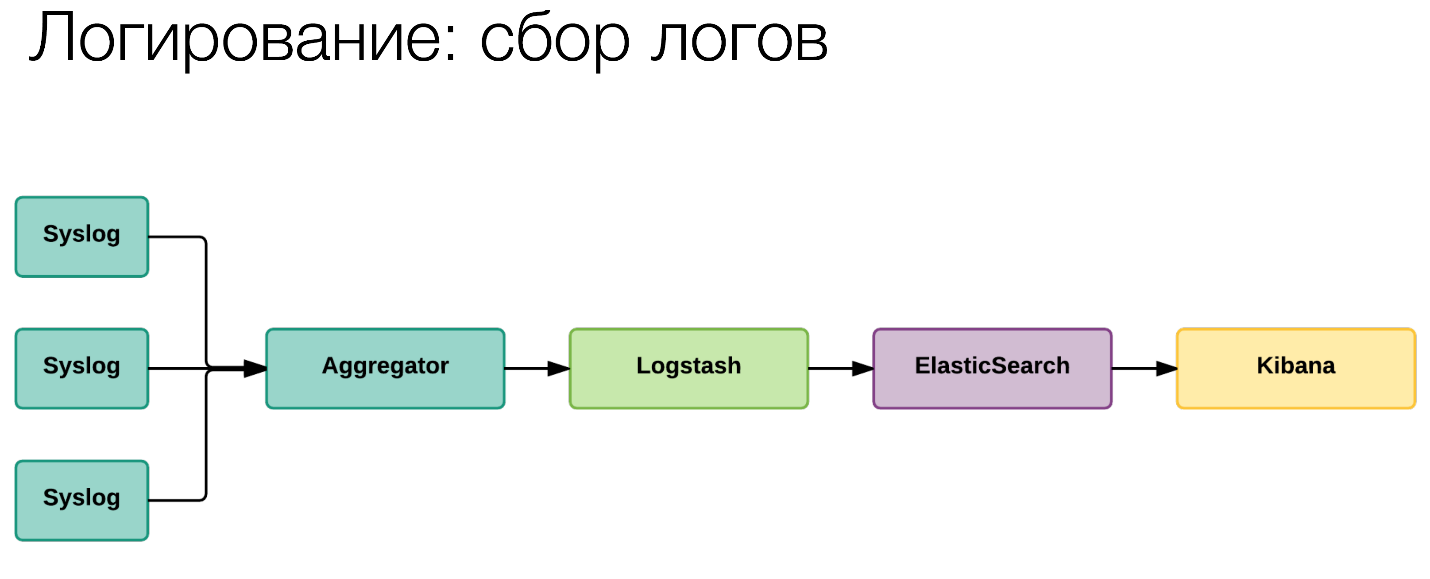
The fact is that wherever it is possible, where we really understand that this really relates to this particular request, we began to add the very TraceID that I showed on the screen with Zipkin to these logs.
As a result, we see the full execution context for a specific user on the Dashboard in Kibana in the logs. Obviously, if the service got into prod, then it is conditionally already working. He passed autotests, testers have already looked at him, if necessary. It should work. If he does not work in a particular situation, then, apparently, there were some prerequisites. These prerequisites in this detailed log, which we see with such filtering on a specific trace for a particular request, help to understand much faster what exactly is wrong in this situation. As a result, our understanding of the causes of the problem has been quite seriously reduced.
The next interesting point. We have introduced a dynamic debug mod. In principle, we now have not such a wild number of logs - about 100-150 gigabytes, I do not remember the exact number. But this is in the basic logging mode. If we wrote in general in super-detail, it would be terabytes. Handling them would be insanely expensive.
Therefore, when we see that we have some kind of problem, we go to specific services, enable them through the debug mod API and watch what happens. Sometimes we first see what happens. Sometimes we shoot a service that creates a problem for us, without turning it off, turn on the debug mod on it and then we already figure out what was wrong with it.
As a result, this helps us quite a bit from the point of view of the ELK stack, which is quite voracious. On some critical services, we additionally aggregate errors. That is, the service itself understands that it is a very critical mistake for it, that it is medium critical, and dumps it all in Sentry.
She is smart enough to be able to aggregate these errors, to summarize according to certain metrics, to make filters for basic things. We use this on a number of services. And we started using it from the time when we had monolithic applications, which we still have. Now we are introducing on some services specifically on the microservice architecture.
The most interesting thing. How do we scale this whole kitchen? Here you need to tell some introductory. For each of our machines that serves the project, we are treated like a kind of black box.
We have an orchestration system. We started with Nomad. Although not, we actually started with Ansible, with our scripts. At some point, this was not enough. By then, there was already some version of Nomad. We looked, she bribed us with her simplicity. We decided that this is the thing that we can now move to.
Along the way, Consul appeared with her, as a registry for service discovery. Also Vault, in which we store secret data: passwords, keys, everything secret that cannot be stored in Git.
Thus, it turned out that all the machines became conditionally the same. There is a Docker on the machine, on it there is a Consul agent, a Nomad agent. This, by and large, is a finished machine that you can take and copy one to one, at the right time to put into operation. When they become unnecessary, it can be decommissioned. Moreover, if you have a cloud, then at peak times you can prepare the machine in advance, turn it on. And when the load fell back, turn it off. This is quite a serious savings.
At some point, Nomad we outgrew. We moved to Kubernetes, and Consul began to play the role of a central configuration system for our services with all the consequences.
We came to the fact that we had some kind of stack in order to automatically scale. How do we do this?
First step. We introduced some limits on three characteristics: memory, processor, network.
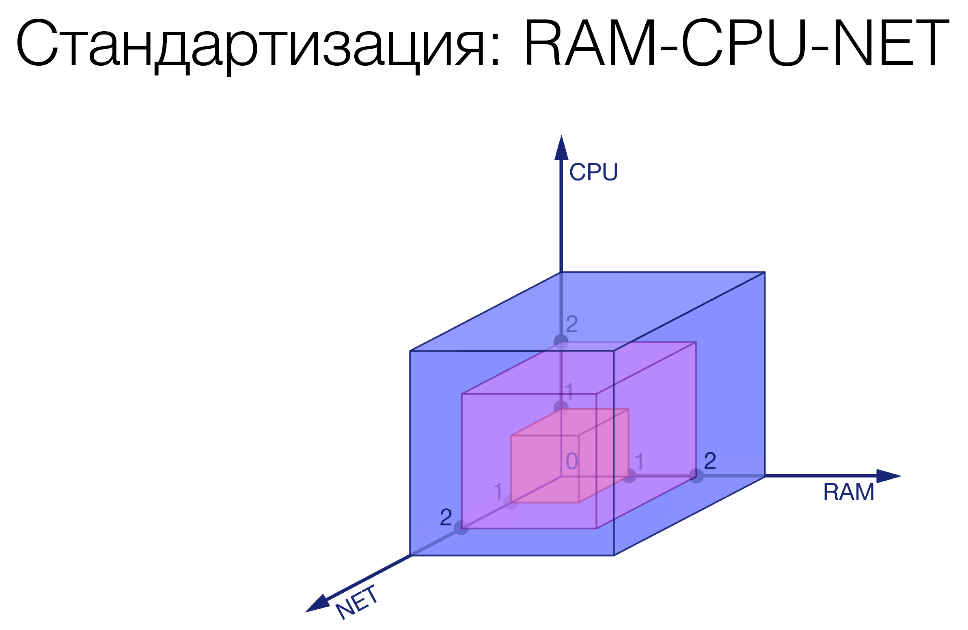
We recorded three gradations for each of these values. We cut some bricks. As an example:
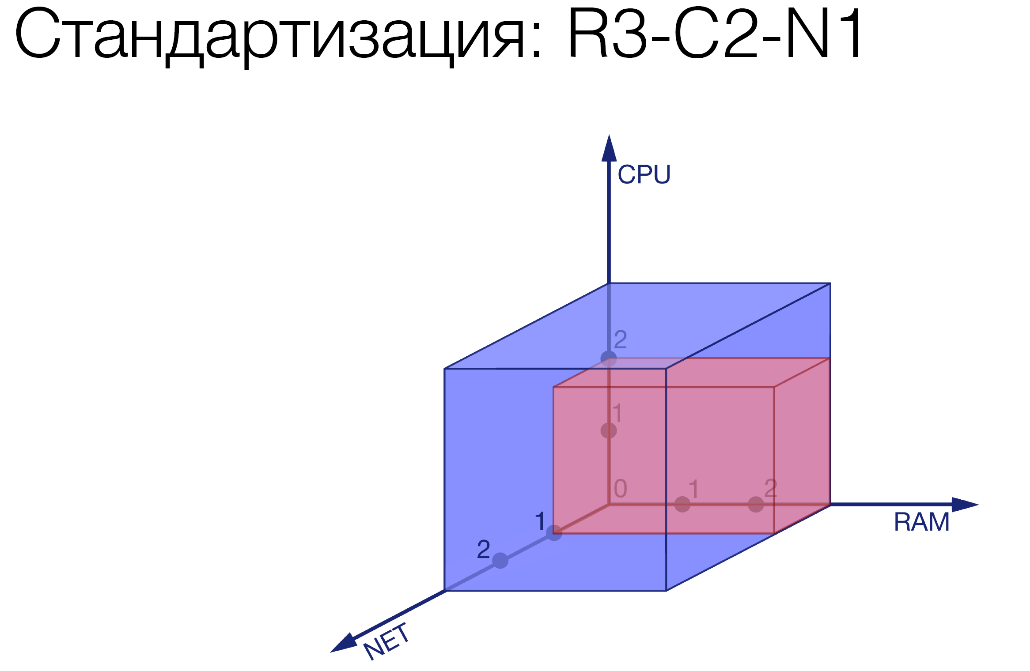
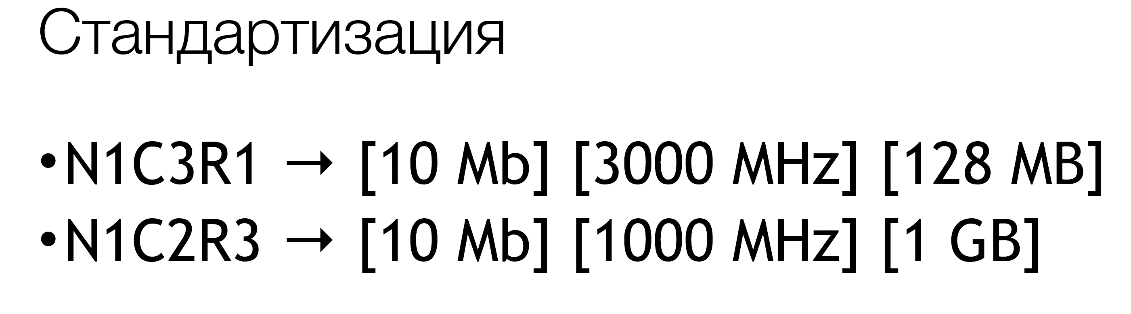
R3-C2-N1. We limited a certain service, gave it just a little bit of network, a little more processor and a lot of memory. There is some gluttonous service.
We introduce mnemonics, because we can dynamically twist specific values in a wide range already in our system, which we call decision service. At the moment, these values are approximately the following:
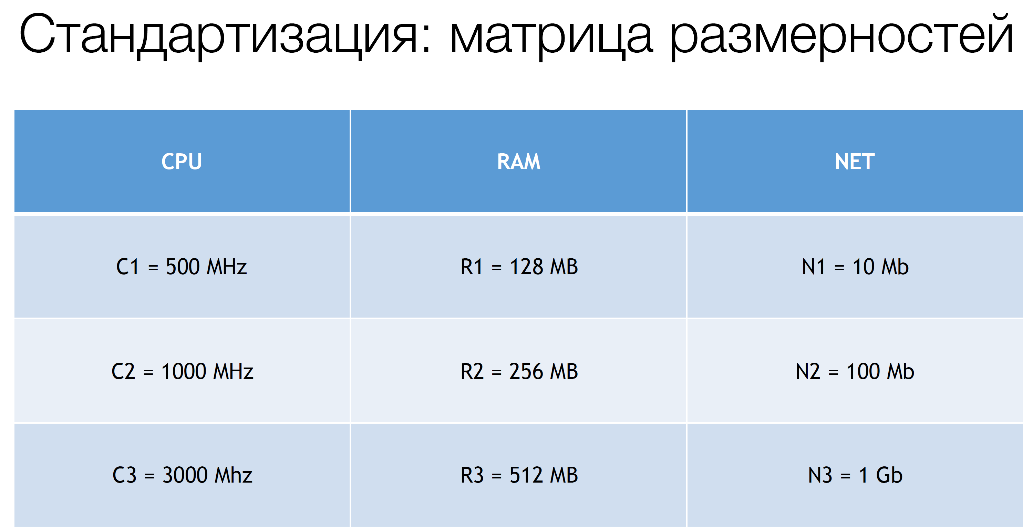
In fact, we still have C4, R4, but these are values that completely go beyond these standards. They are negotiated separately.
It looks something like this:
The next preparatory stage. We are looking at what type of scalability this service has.
The simplest is when your service is completely independent. You can rive this service linearly. 2 times more users came - you launched 2 times more instances. You are doing well again.
The second type is when your scalability depends on external resources. Roughly speaking, this service is included in the database. The base has a certain ability to serve a certain number of customers. You must consider this. Either you must understand when you will begin to degrade the system and you will not be able to add more instances, or simply somehow understand how much you can run into it now.
And the third, most interesting option is when you are limited by some external system. As an example, external billing. You know that he will not serve more than 500 requests. And even though you launch 100 of your services, all the same 500 requests for billing, and hello!
We must also take these limits into account. So we understood what type of service our service belongs to, put the appropriate tag and then look at how it goes in our pipeline.
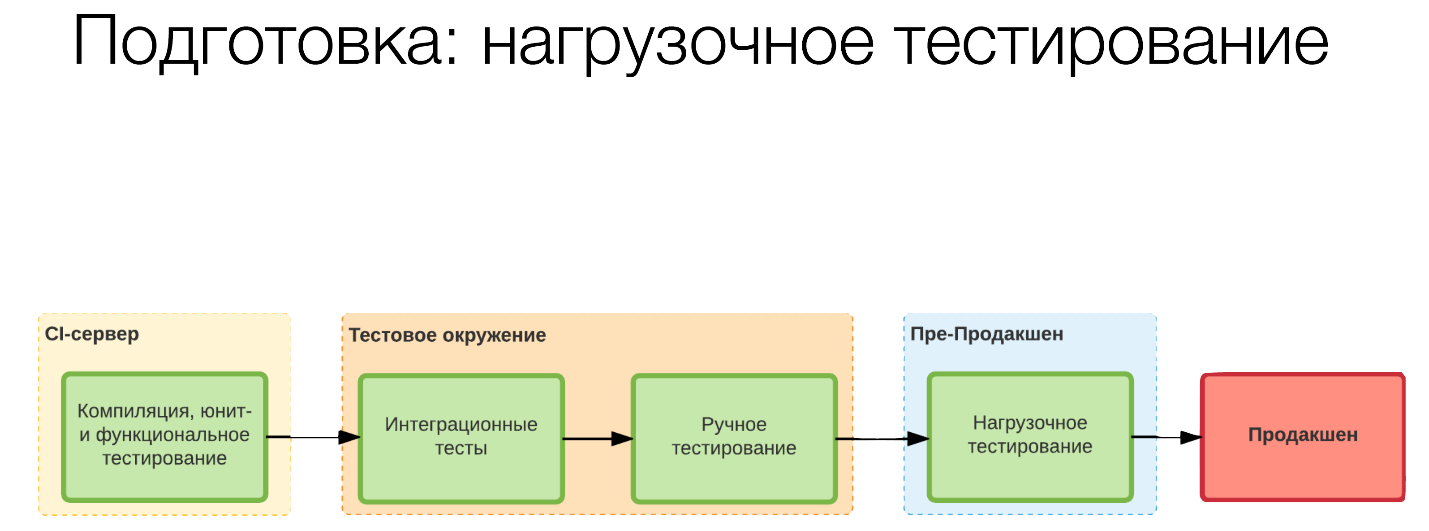
By default, we collected on the CI server, launched some unit tests. On the test environment, we passed integration tests, our testers checked something. Then we went on to stress testing in pre-production.
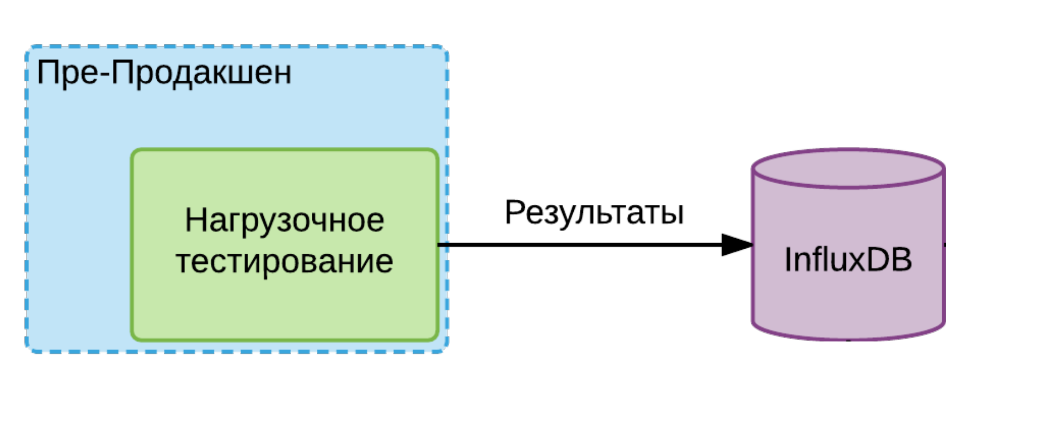
If we have a service of the first type, then we take an instance, run it in this isolated environment and give it the maximum load. We do a few rounds, take the minimum number of values obtained. We put it in InfluxDB and say that this is the limit that, in principle, is possible for this service.
If we have a service of the second type, then here we run these instances in increments in a certain amount until we see that the degradation of the system has begun. We evaluate how fast or slow it is. Here we draw conclusions, if we know some specific load on our systems, is that enough at all? Is there a stock we need? If it is not there, then we already put an alert at this stage and we do not release this service in production. We tell the developers: "Guys, you either need to shard something, or else introduce some kind of toolkit that would allow us to scale this service more linearly."

If we are talking about a service of the third type, then we know its limit, we launch one copy of our service, give the same load and see how much this service can serve. If we know, for example, that the limit of the same billing is 1000 requests, 1 instance serves 200, then we understand that 5 instances are the maximum that can correctly serve this.
We saved all this information in InfluxDB. The Decision service appears. He looks at 2 borders: upper and lower. Upon moving beyond the upper bound, he understands that it is necessary to add instances, and maybe even machines for these instances. The converse is also true. When the load drops (night), we don’t need so many cars, we can reduce the number of instances on some services, turn off the cars and thereby save a little money.
The general scheme looks something like this:
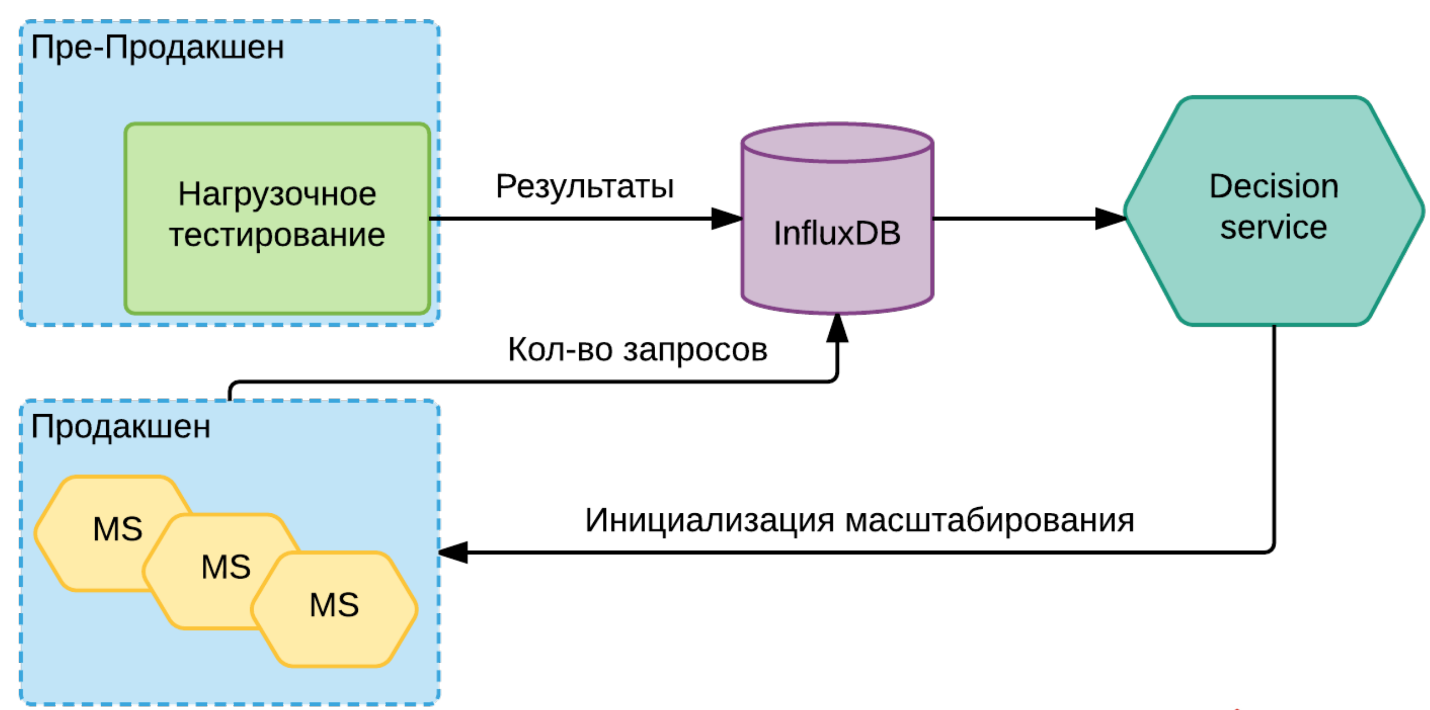
Each service through its metrics regularly says what current load is on it. She goes to the same InfluxDB. When the Decision service sees that we are on the threshold for this particular version of this particular instance, it already gives the Nomad or Kubernetes command to add new instances. Perhaps he before this initiates a new service in the cloud, perhaps he does some other preparatory work. But the bottom line is that he initiates the need to raise a new instance.
If it is clear that we will soon reach the limit for some limited services, then it raises the corresponding alert. Yes, we can do nothing with this, except save up a queue or something else, but at least we know that we may soon have such a problem and can already begin to prepare for it.
This is about scaling in some general things. And all this parsley with a bunch of services, it eventually led to the fact that we looked at something else a bit from the side - this is Gitlab CI.
Traditionally, we collected our services through TeamCity. At some point, we realized that we have one template for all services, because each service is unique, he knows how to roll himself into a container. It has become quite difficult to produce these projects, there are a lot of them. And to describe it in a yml-file and put together with the service itself turned out to be quite convenient. Therefore, we are gradually introducing this thing, so far for a little bit, but the prospects are interesting.
Well, actually what I would like to say to ourselves when we started this whole thing.
Firstly, if we are talking about the development of microservices, then the first thing I would advise is to start right away with some kind of orchestration system . Let it be as simple as the same Nomad that you run with the command
nomad agent -devand you get a complete turnkey orchestration system, right away with Consul raised, with Nomad himself and this whole kitchen. This makes it clear that you are working in a kind of black box. You try to immediately move away from being tied to a specific machine, tied to a file system on a specific machine. Something like this, it immediately rebuilds your thinking.
And, of course, right at the development stage, it should be laid down that each service has at least two instances , otherwise you will not be able to shoot off any problematic services so easily and painlessly, some things that create difficulties for you.
The next moment is, of course, some architectural things. Within microservices, one of the most important of these things is the message bus..
Classic example: you have a user registration. How to make it the simplest way? To register, you need to create an account, have a user in billing, you need to make him an avatar and something else. Here you have a certain number of services, you have a request for a certain such super service, and he is already starting to scatter requests with all his wards. As a result, every time he knows more and more about what services he needs to pull in order to fully register.
It is much easier, more reliable and more efficient to do it differently. Leave 1 service that does the registration. He registered the user. Then you throw out the event “I registered the user, ID such and such, minimal information such and such” into this shared bus. And it will get all the services to which this information is useful. One will go to the billing account, the other will send a welcome letter.
As a result, your system will lose such tight connectivity. You will not have such super services that know about everything and everyone. This actually makes it very easy to operate with such a system.
Well and what I already mentioned. No need to try to repair these services. If you have a problem with a specific instance, try to localize it, transfer traffic to other, maybe just raised, instances. And then understand what is wrong. The viability of the system from this will improve significantly.
Naturally, in order to understand what is happening with your system, how effective it is, you need to collect metrics .
Here is an important point: if you don’t understand some metric, if you don’t know how to use it, if it doesn’t tell you anything, then you don’t need to collect it. Because at some point these metrics become a billion. You spend a lot of processor time just to select what you need in them, spend tons of time to filter out what you do not need. It lies dead weight.
You understand that you need some kind of metric - start collecting it. Something is not necessary - do not collect. This greatly simplifies the handling of this data, because it really becomes very fast really fast.
If you see some kind of problem, then you don’t need to rush to do something for everyone. In most cases, the system itself must somehow respond . You really need an alert only in the situation when it requires some kind of your action. If you don’t need to run something there in the middle of the night, then it’s not an alert, but some kind of warning that you have taken into account and will be able to process in some conditionally standard mode.
Well that's all. Thanks.
Microservices: experience in a busy project