Create a Shape Map RF Map in Power BI
Hello! Today let's talk about the "spatial" analysis in Power BI. About the platform for business intelligence, you can read here . I will analyze one aspect in the post - how to draw the RF map in the Shape Map.
In Power BI, spatial analysis can be implemented using the following customizable visual elements:
Each has its own advantages and disadvantages, so they are best viewed on the basis of a specific task .
The article will cover the visual element Shape Map . Why didn't we use ArcGIS Maps for Power BI ? Because the administrator has blocked its use!

Taking advantage of the Shape Map was not so easy. The problems are related to the fact that the standard Desktop version of Power BI does not have embedded maps of the Russian Federation.

Figure. Customizable map
Solutions to the problem:
- Draw the map yourself online. For this, everything is already there . The code of the formed card is displayed on the right. Adding process
Own data can be automated by inserting pre-prepared code with the coordinates of objects. - Draw a map of the Russian Federation according to the instructions . To implement the required input files = shapefile . Download Shapefile RF by reference .
- Use the prepared report "Map of the Russian Federation (regions)". Report files can be downloaded from the link (Power BI Report - "Map.pbix", Source table for markup - "file.txt", Map of the Russian Federation in * .json format - "Map of RF.json"). If you need to merge regions into groups (for example), you do not need to redraw the map. It is enough to change the column "desc" in the file "file.txt" so that the regions of the same group have the same value (the name of the group).
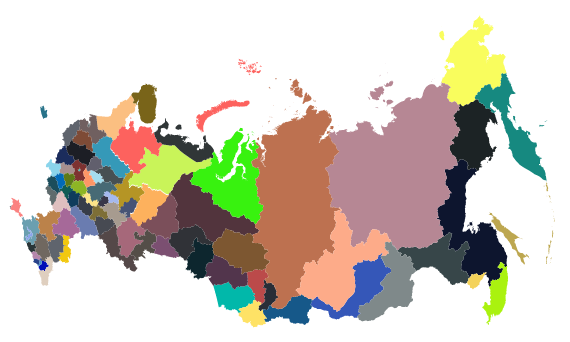
Regions of the Russian Federation

Grouping by region
Useful links
Editing maps
Shapefile
Draw maps
Download files