Experiment: looking for int i = 0xDEADBEEF in a physical memory dump
- Tutorial
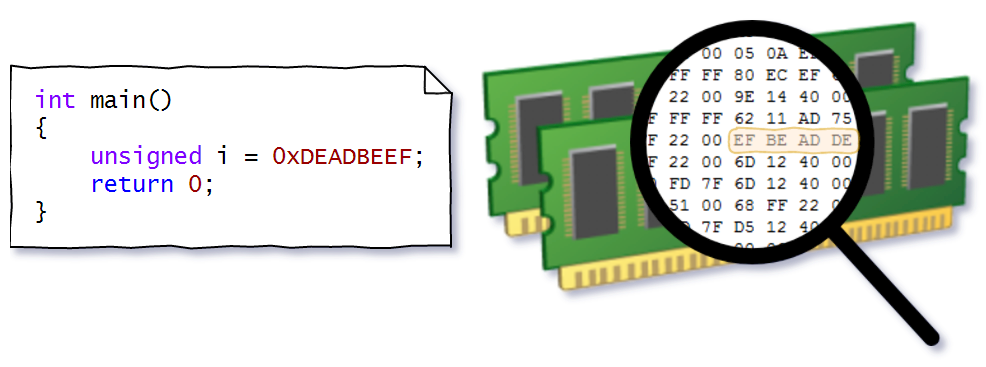
Studying the virtual address space and the address translation algorithm will be much easier if you start with a simple practical example. To do this, we write a simple program that displays the address of a local variable:
int main()
{
    unsigned i = 0xDEADBEEF;
    std::cout << "address of i is " << std::hex << &i;
    std::cin.get(); //Чтобы процесс не завершился
    return 0;
}
Then try to find the physical address and view the value at this address.
We will consider 32-bit Windows (without any Physical Address Extension), because 64-bit is more complicated. The description of the transformation is simplified, but enough for our experiment. I recommend checking in virtualka. It doesn't matter which one, but in the end I will show how to unload a memory dump in VirtualBox.
The basics
In my case, the address turned out to be 0x22FF2C. In general, it may vary each time the program starts (see ASLR) Other processes at this address may have some values of their own, because this is not a physical, but a virtual address. Perhaps the main purpose of the virtual address space is the ability to provide each process with its own address space, in which it would not interfere with others. The size of the virtual address space varies by platform. For x86, the theoretical maximum size is 4 GB. By default, the first half (0 - 0x7FFFFFFF) is the user’s process space, which contains the image of the executable file of the current process, its stack, heap and more. The second half (0x80000000 - 0xFFFFFFFF) - system. With some reservations, we can assume that the user process space is unique to each process, and the system is only one. Address 0x22FF2C is obviously
The virtual address space is divided into 0x100000 (1048576) pages each 4096 bytes in size. Physical memory is also divided into pages of the same size, called page blocks. Pages (not all, of course) are mapped to page blocks, so for each page you need information about its location in physical memory. All 0x100000 pages correspond to the same number of 4-byte entries called PTEs (page table entry). In virtual space, they are located in the address range 0xC0000000 - 0xC03FFFFF, and occupy 1,024 pages called page tables. Getting a record is easy: the k-th page corresponds to the k-th record.
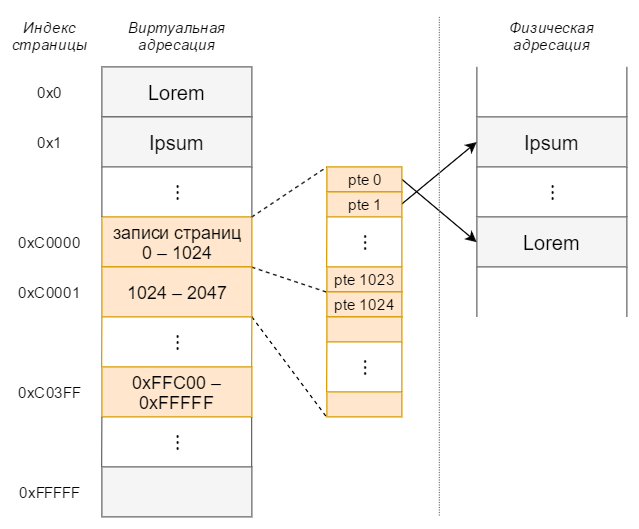
Orange indicates page tables.
virtual_address = 0x22FF2C
page_index = virtual_address / 4096
pte_addr = 0xC0000000 + page_index * 4
Multiply by 4 because PTEs are 4 bytes. We get that in our case pte_addr = 0xC00008BC
Naive attempt
There is a PTE address, try to find out what's there:
std::cout << "PTE is " << std::hex << *(unsigned*)0xC00008BC;Well, oh. Hardware exception. And all because we tried to read from the system space. ReadProcessMemory won't help either. A call to VirtualQuery will tell us PAGE_NOACCESS. You can only gain access by obtaining kernel mode privileges. Perhaps the easiest way for our research task is to use a kernel debugger.
Using the kernel debugger
We put KD and LiveKd . LiveKD allows you to run Microsoft Kd and Windbg kernel debuggers, which are part of the debugging tools package for Windows, in the current system in local mode. The last link also has a little help on installation and help.
We run our example (let it be called main.exe). Launch LiveKd. We write " !process 0 0" to display a list of all running processes, or immediately " !process 0 0 main.exe"
0: kd> !process 0 0 main.exe
PROCESS 86530118  SessionId: 1  Cid: 0dcc    Peb: 7ffdd000  ParentCid: 0428
    DirBase: 2402e000  ObjectTable: 8879f430  HandleCount:  16.
    Image: main.exe
We are interested in the address after the word PROCESS (this is the address to the EPROCESS structure containing the process attributes). We are connected to the process:
0: kd> .process 86530118
Implicit process is now 86530118
We check the contents at 0x22FF2C to make sure that everything is done correctly:
0: kd> dd 22FF2C L1
0022ff2c  deadbeef
By default, hexadecimal numbers are used. The command dddisplays several 4-byte values, starting with the specified virtual address. L1 - output of only one value.
Read PTE
0: kd> dd C00008BC L1
c00008bc  6612f847
It was possible not to consider:
dd C0000000 + (22FF2C >> 0xC) * 4 L1
c00008bc  6612f847
In the value of the PTE record 6612f847, the first 20 bits (5 hex-digits) are the index of the page block, the rest are various flags. To get the page block address, you need to multiply the index by the block size - 4096 bytes.
page_block_index = 0x6612F
page_block_address = page_block_index << 12 = 0x6612F000 //Умножение на 4096
The byte order inside the page and page block is the same, so you need to calculate the offset inside the page and add to the page block address:
virtual_adress = 0x22FF2C
offset = virtual_adress & 0xFFF = 0xF2C //Последние три hex-цифры
phisycal_address = page_block_address + offset = 0x6612FF2C
We check:
0: kd> !dd 6612FF2C L1
#6612ff2c deadbeef
The command is !ddsimilar dd, only accepts physical addresses.
We found out that our address can be represented as follows:
0x22FF2C = b 00000000001000101111 111100101100
             20 бит               12 бит
             page_index           byte_offset
But also note that the PTE found is in the 0th page table with the index 0x22F inside it. And our address can be represented as follows:
0x22FF2C = b 0000000000 1000101111 111100101100
             10 бит     10 бит     12 бит
             table_idx  PTE_index  byte_offset
We need to go deeper (PDE)
Using virtual PTE addresses is unsportsmanlike. After all, they are also ordinary pages that need to find page blocks. And if so, then we just find our PTE for these pages. In total, we have 1024 such pages (called page tables) and all PTEs for them are placed in one page. This page is called the page directory and it contains 1,024 entries (called PDEs - page directory entry) with addresses on the page tables.
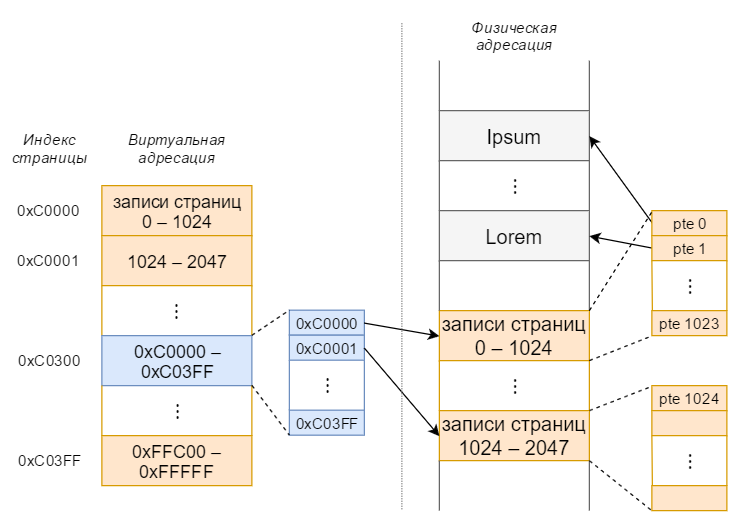
The table directory is blue, the page tables are orange.
We do exactly the same as already done:
pte_addr = 0xC00008BC
page_index = pte_addr / 4096 = 0xC0000
pde_addr = 0xC0000000 + page_index * 4 = 0xC0300000
Получили адрес PDE = 0xC0300000 (все PDE хранятся в странице по адресу 0xC0300000, мы попали в нулевую PDE). Проверяем содержимое:
0: kd> dd C0300000 L1
c0300000  0b21d867
Полностью аналогично: PDE, содержащая 0b21d867, дает нам адрес 0x0B21D000 страничного блока с таблицей страниц. Осталось найти в ней нужную PTE. Вспомним, что адресу 0x22FF2C соответствует PTE с индексом 0x22F в 0-й таблице (со смещением 0x22F * 4). Значит, PTE находится по адресу 0x0B21D000 + 0x22F * 4.
0: kd> !dd 0b21d000 + 0x22f * 4
# b21d8bc 6612f847
С адресом 6612f847 мы уже работали.
Осталось выяснить, где в физической памяти находится каталог (так как мы получали PDE с помощью виртуальной адресации). Адрес был указан в DirBase, когда мы просмотрели информацию о процессе командой "!process 0 0 main.exe". В нашем случае DirBase = 2402e000
0: kd> !dd 2402e000
#2402e000 0b21d867
Итоговая формула
0x22FF2C = b 0000000000 1000101111 111100101100
             10 бит     10 бит     12 бит
             PDE_index  PTE_index  byte_offset
pde_addr   = DirBase + PDE_index * 4
pte_addr   = ((*pde_addr) & 0xFFFFF000) | (PTE_index * 4)
value_addr = ((*pte_addr) & 0xFFFFF000) | byte_offset
Ищем в дампе
I think removing a dump from a running system is somewhat problematic, so let's remove it from VirtualBox. To do this, run in debug mode:
VirtualBox.exe --dbg --startvm VM_nameSelect in the menu "Debug" -> "Command line ..." and type:
.pgmphystofile "path_to_dump_file"Open the file (I use HxD), go to 6612ff2c:
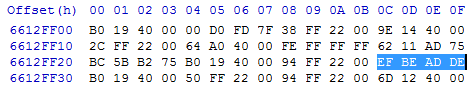
Knowing DirBase and the virtual address, you can search for the value immediately in the dump, without a debugger. In general, in the dump you can find the value of DirBase by the name of the process, but that's another story.