Virtual machine performance comparison of 6 cloud platforms: Selectel, MCS, Ya.Oblako, Google Cloud, AWS and Azure
Just now I came across two articles from one corporate blog about clouds - one about Kubernetes, and the second was an attempt to measure performance using a technique that seemed doubtful to me (spoiler - not for nothing).
About K8s, I also have something to say, but let's talk about performance.
The mistrust of the results was caused by many factors, but the main ones for me were the following: there were no test run parameters, the number of iterations was not announced, the machines chosen were not announced, there was no detailed configuration either. It is doubtful in general.
In general, I mainly use Google Cloud and AWS (a total of about ten years of experience has come to work with them) and I don’t work with domestic cloud providers, but, by coincidence, I have active accounts in Selectel, MCS, I. Cloud and, after this test, also in Azure.
Fortunately, all these platforms are public and, whatever I intend to, everyone can go, repeat and check if they wish.
The result of all this was the thought - why not spend a couple of hundred rubles, all weekends and really thoughtfully not to measure all six platforms and find out which of them gives the best performance relative to the cost and in absolute figures with the same configurations, and at the same time compare global suppliers with Russian.
And also, as it turned out, to clarify some of the "features" in the allocation of resources and remind ourselves and others that it is not always and not on all platforms for the same money you can get predictable performance.
The results were not to be said to be phenomenal, but in my opinion extremely curious.
I ask those interested under the cat.
Each cloud provider runs successively in different availability zones (if there are two zones, then 1 machine is the first zone and 2 is in the second) three virtual machines with 4 CPUs, 8 GB of RAM and a 50 GB system disk.
The type of processor / instance is the newest available, if there is a choice.
VM type - shared with full kernel allocation.
Type of disks - network SSD with the ability to remount to another VM.
Options for guaranteed allocation of IOPS or machines optimized for this are not used, unless it is provided for by standard conditions of use and cannot be waived.
The default file system is ext4.
No manual system settings were made.
A series of tests was run on each of the machines, the totals for each machine were averaged.
The total performance of the platform is expressed by the arithmetic average of the average test values for each of the virtual machines, but the standard deviation is also in the tables for those interested.
The operating system is Ubuntu 16.04 of the latest available patch level.
The calculation of the cost was made without taking into account any bonus charges from the provider, without taking into account the cost of traffic, at the rate of the virtual machine’s work for a full calendar month without stopping.
Also, some platforms allow, through certain restrictions (which you can skillfully survive), to significantly reduce the cost of resources.
For AWS, these are Spot instances, for GCE, Preemptible instances. With a suitable application architecture, they can be successfully used without harm to it, but with a benefit for the wallet, it has been verified by me personally, and by dozens of companies that use both.
To this category can be attributed the type of disk in the Selectel. Despite the fact that the main measurements involved disks of the type “Fast”, there is still significantly cheaper “Universal”, which does not shine with speed, but is suitable for a huge number of tasks. Options for its use were also taken into account in the final calculations.
To run the tests, this script was written, from which you can see all the launch parameters:
For all tests except Sysbench CPU, more is better.
The results of all launches were collected in Excel spreadsheets for further calculations.
Well, it seems like I did - I told, now I need to tell what happened.
Clouds are usually compared to ordinary iron servers. I do not see much sense in this, since the cloud is not only and not so much directly computing power, but first of all - an ecosystem, but, nevertheless, I think many people will still be interested in such a comparison. Well, in general, something must be compared. With something close, famous and understandable.
I didn’t have the iron machine at hand, but there is a very new non-Dell workstation, it’s also a home server with a well-known processor (E5-4650L @ 2.60GHz), a suitable amount of not the fastest DDR3 EEC memory (to be frank - the slowest of those that were generally compatible) and the SmartBuy SSD, bought 4 years ago and recently moved to this assembly.
Since all of this works under FreeBSD 11.2, a suitable virtual machine was created using bhyve tools and a test was run there.
If you translate the results into a table view, you get the following:
Well, there are reference data, now directly the results of testing providers.
Further, I will not give complete logs so as not to inflate the article, but they are stored with me, if you wish, ask for a link, I will share it, although the data from them are transferred to a table.
Results for ru-central1-a zone:
Results for ru-central1-b zone:
Results for ru-central1-c zone:
Summary results:
I want to draw special attention to one remarkable fact.
With a full load of all cores of virtual machines in zones A and B, the total performance is LOWER than with a load of only two cores out of four.
Moreover, I took additional cars in one of the zones and drove the test for them - the problem did not go anywhere.
I suppose that this is a technical problem and it is connected with the hardware features of the machines used for hypervisors and taking them into account when allocating resources (such an experience case is recalled). Well, or with something else, I can’t look inside, but I don’t want to guess much.
Hopefully, comrades from Ya. Oblak will read this article and do something with it, and if you are very lucky, they will tell you what it is, but it turns out somewhat insulting and sometimes unpleasant (many applications focus on the number of cores to calculate the number of threads) .
Mail.ru has only two availability zones, so two tests were performed on different machines in the same zone.
Results for the Moscow-East zone (the first VM):
Results for the zone "Moscow-East" (second VM):
Results for the zone "Moscow-North":
Summary results:
From the interesting, I would like to note that the performance degradation problems with the use of four threads are not here, and it seems that honest (though rather weak) kernels are issued.
Also, in the “North” zone, much more powerful processors are used than in the “East” zone, the difference in performance at full load reaches two times. For the same money. Draw your own conclusions.
The results of his testing were very interesting. In the absolute, it provides the most powerful 4-core machines from all the tested providers.
Results for the zone "Moscow - Berzarina-1":
Results for the zone "Moscow - Berzarina-2":
Results for the SPB - Dubrovka-1 zone:
Summary table with the results:
As I have already said, of all the tested, this provider provides the most efficient machines per 4 streams. But even here there is a feature - again, for the same money, we get performance that differs by almost 2 times - compare the results of Berezin-2 with the rest.
Also, I would like to note very fast drives at a reasonable price, the best of the three domestic providers that are available from the three tested. At the same time, the machine with the fastest processor has the slowest disk out of three.
It turns out a kind of lottery, however, taking into account that even if you are not lucky, everything will still be very, very decent.
GCE test results did not bring any special surprises.
Everything is completely predictable, homogeneous and in general corresponds to the declared.
Results for europe-west1-b zone:
Results for europe-west-1c zone:
Results for europe-west1-d zone:
Summary table with the results:
There is nothing to even comment on.
Performance in 4 threads hardly differs from two, but does not degrade.
In general, each core is very productive and half as powerful as the kernel of the test virtuals, which goes out-of-competition, and they are not to be said to be the weakest.
The disks of stars from the sky are not enough, but for most tasks there will be plenty of them.
The only thing worth mentioning is the excellent homogeneity. Each of the machines differs in performance by no more than the measurement error, which gives excellent predictability and ease of planning.
The market leader, his test surprised me somewhat, since they have the same problem that Ya.Oblak showed up.
Despite the fact that I have been working with him for quite a long time, I somehow didn’t have much time to figure out the difference in performance between full load and partial load, so the results were a surprise to me to some extent.
For testing, we used the c5.xlarge type, as the cheapest of the matching requirements.
Results for the eu-central-1a zone:
Results for the zone eu-central-1b:
Results for the eu-central-1c zone:
Summary table of results:
As I said above - the results surprised me.
Yes, I understand that the problem manifests itself explicitly only under certain types of load (it is not visible in Sysbench), but considering the results of other platforms, this is clearly not a problem with the test, but performance limitations.
In defense of AWS, I can say that when creating a machine, it allows you to disable HyperThreading, which at least helps to eliminate the problem with performance loss in some applications.
Otherwise, the disks do not guarantee such performance, but they support Burst to smooth the loads, so if you need to read / pee relatively much, quickly, but not very often (say, every few minutes), then everything will be fine.
Also, the homogeneity of the results is simply excellent, everything is predictable and without surprises.
Initially, I did not want to include it in the test, because I have never really worked with him, and even I didn’t have an account there. But, on reflection, I decided to test it all the same, for even bill, for which I paid .
At once I want to explain that the region was chosen from the principle “somewhere in Europe”, and the type of machine is 100% suitable for the conditions (4 processors, 8GB of memory).
In the first iteration of the test, it was A4 v2, marked as “General purpose”, with which this article was published. Experts who came to the comments explained to me what I did wrong and that Azure has a machine that is slower can cost more than the one that is faster and without reading the documentation or googling about it . After that, the results were updated based on the type F4s
Results for France-Central-1:
Results for France-Central-2:
Results for France-Central-3:
Summary table of results:
Good performance, one of the best among the platforms presented. True price spoils everything.
Let's start with a pivot table of results.
I insert it with an image, because I want to use colors, but the data there is from the tables presented above.

The smaller, the better.
Let's take a closer look at CPU performance:
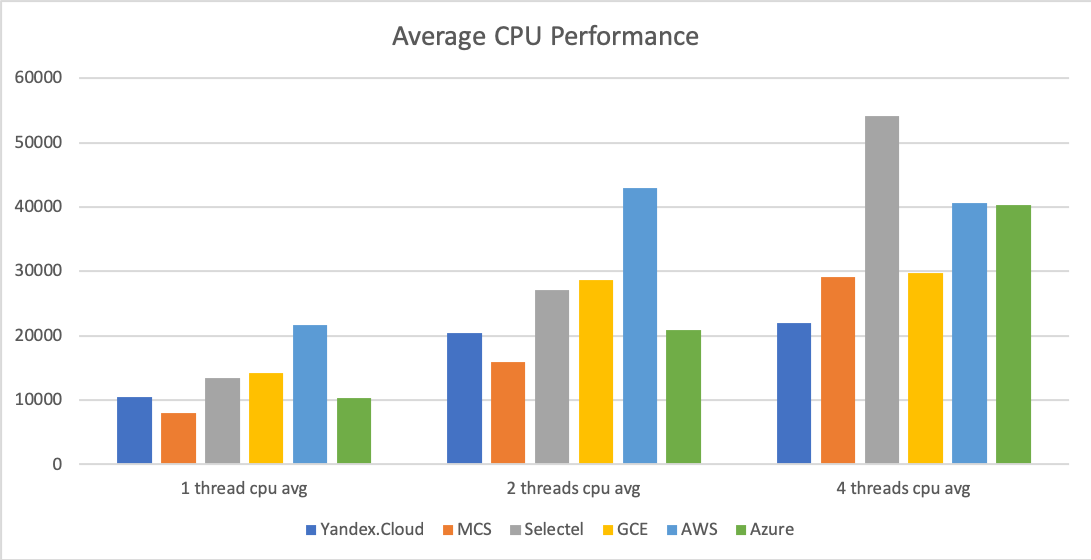
In general, the leadership in average measured performance for single and dual-core loads holds AWS firmly. In second place is Google Cloud.
Of the Russian providers, Selectel showed itself the best. In addition to the third place for incomplete load, it has an unambiguous first when all cores are loaded, even taking into account the non-uniformity of results between zones (which is unpleasant, but in this case does not affect).
Now Memory:
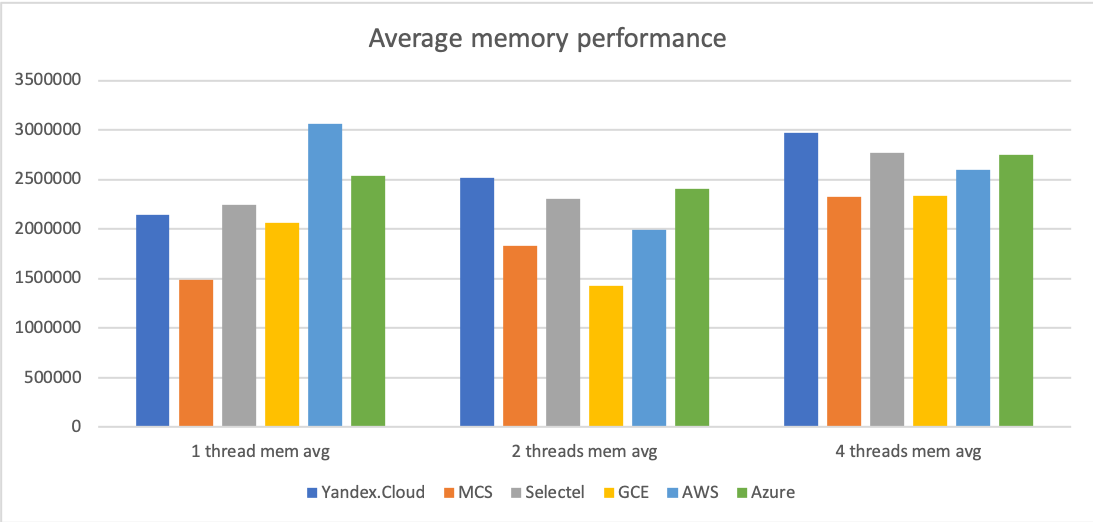
The speed of the memorydie memoryAWS for single-threaded mode holds the palm, for Azure and Ya.Oblako for four-flow for dual-flow mode.
Wheels:

The speed of the disks we have a clear winner - Selectel. For comparison, none of the participants in the comparison offers anything like this.
In second place - AWS due to the allowed Burst and generally decent speed.
Behind him are GCE and Azure, and Ya.Oblako and MSC close the list, which offer roughly the same performance solutions.
Now let's talk about another interesting factor - cost.
This comparison does not in any way cover the totality of the cost of solutions on different platforms, its purpose is simple - to compare the cost of a unit of productivity among different providers.
The calculation will take the stress-ng test.
Estimated prices for 1 month of using each instance (without VAT):
The cost table requires some explanation.
For those providers who have the opportunity to reduce the cost of resources described in the beginning of the article, there are two costs - the main and the alternative, calculated taking into account these possibilities.
Since this is not a discount and is tied to usage scenarios that are different, I’m considering a good idea to calculate the cost and with their consideration.
Also, because of the difference in currencies, the cost of AWS, Azure (yes, I know what it can show in rubles (somehow), their calculator showed me the values in dollars) and GCE is reduced to the ruble equivalent of the rate of 65.46 rubles for U.S. dollar.
Also, for Azure, I did not manage to allocate the cost of the disk, the standard instance disk there is 16 GB, how much the disk will actually cost from the calculator is not very clear (there is also the number of requests taken into account), so the price is indicated only for the instance itself , although the total this still does not change the situation, Azure remains the most expensive.
So, the cost of each decision, reduced to rubles for a parrot in the stress-ng test for the minimum amount of resources that were obtained in the test:

Less is better
If you count on the basis of average test results, the picture will not change fundamentally, but some things will change. will change:

Less is better
It turns out that in all categories, if you count without VAT, Selectel wins, and in the category of heavy load with almost double the gap.
Now let's see what happens if you re-read the cost, taking into account possible savings depending on the use case.
The alternative cost, taking into account the savings due to the use scenario, reduced to rubles for a parrot in the stress-ng test for the minimum amount of resources that were obtained in the test:

Less is better
It is the same, but to the average amount of resources:

Here the picture changes.
In all scenarios, except for the heavy, permanently full load, AWS and GCE come out ahead with a decent margin with almost identical cost per unit of resources.
In the case of a heavy load, Selectel is competing with them, offering resources for practically the same money, but with fewer “concessions” (yet its nodes are constant and do not turn off at an arbitrary point in time, unlike AWS Spot and Google Preemptible Instances).
So, if you carefully approach the architecture, you can save on seemingly empty space.
The test turned out to be long, but as for me - interesting.
For myself, I made some conclusions on the results, I hope it will help you to look at the issue of cloud platform performance a bit from the other side and perhaps make a little easier choice of flour, as well as help in diagnosing performance problems on some platforms due to the identified "features".
** UPDATE ** Selectel conclusions and prices have been updated. they would incorrectly include VAT
** UPDATE2 ** The results of Azure are updated for a new type of node, the conclusions are updated, but nothing has changed in principle anyway
About K8s, I also have something to say, but let's talk about performance.
The mistrust of the results was caused by many factors, but the main ones for me were the following: there were no test run parameters, the number of iterations was not announced, the machines chosen were not announced, there was no detailed configuration either. It is doubtful in general.
In general, I mainly use Google Cloud and AWS (a total of about ten years of experience has come to work with them) and I don’t work with domestic cloud providers, but, by coincidence, I have active accounts in Selectel, MCS, I. Cloud and, after this test, also in Azure.
Fortunately, all these platforms are public and, whatever I intend to, everyone can go, repeat and check if they wish.
The result of all this was the thought - why not spend a couple of hundred rubles
And also, as it turned out, to clarify some of the "features" in the allocation of resources and remind ourselves and others that it is not always and not on all platforms for the same money you can get predictable performance.
The results were not to be said to be phenomenal, but in my opinion extremely curious.
I ask those interested under the cat.
Technique
Virtual machines
Each cloud provider runs successively in different availability zones (if there are two zones, then 1 machine is the first zone and 2 is in the second) three virtual machines with 4 CPUs, 8 GB of RAM and a 50 GB system disk.
The type of processor / instance is the newest available, if there is a choice.
VM type - shared with full kernel allocation.
Type of disks - network SSD with the ability to remount to another VM.
Options for guaranteed allocation of IOPS or machines optimized for this are not used, unless it is provided for by standard conditions of use and cannot be waived.
The default file system is ext4.
No manual system settings were made.
A series of tests was run on each of the machines, the totals for each machine were averaged.
The total performance of the platform is expressed by the arithmetic average of the average test values for each of the virtual machines, but the standard deviation is also in the tables for those interested.
The operating system is Ubuntu 16.04 of the latest available patch level.
Cost calculation
The calculation of the cost was made without taking into account any bonus charges from the provider, without taking into account the cost of traffic, at the rate of the virtual machine’s work for a full calendar month without stopping.
Also, some platforms allow, through certain restrictions (which you can skillfully survive), to significantly reduce the cost of resources.
For AWS, these are Spot instances, for GCE, Preemptible instances. With a suitable application architecture, they can be successfully used without harm to it, but with a benefit for the wallet, it has been verified by me personally, and by dozens of companies that use both.
To this category can be attributed the type of disk in the Selectel. Despite the fact that the main measurements involved disks of the type “Fast”, there is still significantly cheaper “Universal”, which does not shine with speed, but is suitable for a huge number of tasks. Options for its use were also taken into account in the final calculations.
Tests
To run the tests, this script was written, from which you can see all the launch parameters:
Test script
#!/usr/bin/env bash
TIME=60
# Workload 70% read 30% write
cat > fio-rand.fio << EOL
[global]
name=fio-rand-RW
filename=fio-rand-RW
rw=randrw
rwmixread=70
rwmixwrite=30
bs=4K
direct=1
numjobs=1
time_based=1
runtime=${TIME}
[file1]
size=2G
iodepth=16
EOL
echo"Run FIO"for i in {1..3}; doecho"$i iter:"
  fio fio-rand.fio |grep -E "(read|write|bw|iops|READ|WRITE)" |grep -v "Disk"doneecho"Run stress-ng."for i in {1,2,4}; dofor z in {1..3}; doecho -n "$z iter. Stress-NG for $i CPU: "
    stress-ng --cpu $i --cpu-method matrixprod --metrics-brief -t $TIME  2>&1 |sed -n '6p'| awk '{print $5}'donedonefor i in {1,2,4}; dofor z in {1..3}; doecho -n "$z iter. Sysbench CPU for $i thread(s): "
    sysbench --num-threads=$i --max-time=$TIME --test=cpu run 2>&1|grep "total time:"|awk '{print $3}'donedonefor i in {1,2,4}; dofor z in {1..3}; doecho -n "$z iter. Sysbench Memory for $i thread(s): "
    sysbench --num-threads=$i --max-time=$TIME --test=memory run 2>&1| grep "Operations performed:"donedone
For all tests except Sysbench CPU, more is better.
The results of all launches were collected in Excel spreadsheets for further calculations.
Well, it seems like I did - I told, now I need to tell what happened.
Testing
The machine is an example outside the test.
Clouds are usually compared to ordinary iron servers. I do not see much sense in this, since the cloud is not only and not so much directly computing power, but first of all - an ecosystem, but, nevertheless, I think many people will still be interested in such a comparison. Well, in general, something must be compared. With something close, famous and understandable.
I didn’t have the iron machine at hand, but there is a very new non-Dell workstation, it’s also a home server with a well-known processor (E5-4650L @ 2.60GHz), a suitable amount of not the fastest DDR3 EEC memory (to be frank - the slowest of those that were generally compatible) and the SmartBuy SSD, bought 4 years ago and recently moved to this assembly.
Since all of this works under FreeBSD 11.2, a suitable virtual machine was created using bhyve tools and a test was run there.
Startup log
Run FIO
1 iter:
  read : io=891652KB, bw=14861KB/s, iops=3715, runt= 60001msec
    bw (KB  /s): min=  116, max=17520, per=100.00%, avg=15449.34, stdev=2990.83
  write: io=381908KB, bw=6365.3KB/s, iops=1591, runt= 60001msec
    bw (KB  /s): min=   49, max= 7752, per=100.00%, avg=6620.06, stdev=1290.46
   READ: io=891652KB, aggrb=14860KB/s, minb=14860KB/s, maxb=14860KB/s, mint=60001msec, maxt=60001msec
  WRITE: io=381908KB, aggrb=6365KB/s, minb=6365KB/s, maxb=6365KB/s, mint=60001msec, maxt=60001msec
2 iter:
  read : io=930228KB, bw=15504KB/s, iops=3875, runt= 60001msec
    bw (KB  /s): min= 5088, max=17144, per=99.98%, avg=15500.61, stdev=2175.23
  write: io=398256KB, bw=6637.6KB/s, iops=1659, runt= 60001msec
    bw (KB  /s): min= 2064, max= 7504, per=100.00%, avg=6639.82, stdev=979.69
   READ: io=930228KB, aggrb=15503KB/s, minb=15503KB/s, maxb=15503KB/s, mint=60001msec, maxt=60001msec
  WRITE: io=398256KB, aggrb=6637KB/s, minb=6637KB/s, maxb=6637KB/s, mint=60001msec, maxt=60001msec
3 iter:
  read : io=886780KB, bw=14779KB/s, iops=3694, runt= 60001msec
    bw (KB  /s): min= 1823, max=17248, per=100.00%, avg=15520.09, stdev=2453.59
  write: io=379988KB, bw=6333.3KB/s, iops=1583, runt= 60001msec
    bw (KB  /s): min=  731, max= 7488, per=100.00%, avg=6647.33, stdev=1054.67
   READ: io=886780KB, aggrb=14779KB/s, minb=14779KB/s, maxb=14779KB/s, mint=60001msec, maxt=60001msec
  WRITE: io=379988KB, aggrb=6333KB/s, minb=6333KB/s, maxb=6333KB/s, mint=60001msec, maxt=60001msec
Run stress-ng.
1 iter. Stress-NG for 1 CPU: 12227
2 iter. Stress-NG for 1 CPU: 12399
3 iter. Stress-NG for 1 CPU: 12134
1 iter. Stress-NG for 2 CPU: 23812
2 iter. Stress-NG for 2 CPU: 23558
3 iter. Stress-NG for 2 CPU: 21254
1 iter. Stress-NG for 4 CPU: 39495
2 iter. Stress-NG for 4 CPU: 39876
3 iter. Stress-NG for 4 CPU: 42370
1 iter. Sysbench CPU for 1 thread(s): 11.0566s
2 iter. Sysbench CPU for 1 thread(s): 11.0479s
3 iter. Sysbench CPU for 1 thread(s): 11.0451s
1 iter. Sysbench CPU for 2 thread(s): 5.6159s
2 iter. Sysbench CPU for 2 thread(s): 5.5664s
3 iter. Sysbench CPU for 2 thread(s): 5.5407s
1 iter. Sysbench CPU for 4 thread(s): 2.8368s
2 iter. Sysbench CPU for 4 thread(s): 2.8801s
3 iter. Sysbench CPU for 4 thread(s): 2.8244s
1 iter. Sysbench Memory for 1 thread(s): Operations performed: 104857600 (2537704.01 ops/sec)
2 iter. Sysbench Memory for 1 thread(s): Operations performed: 104857600 (2536025.17 ops/sec)
3 iter. Sysbench Memory for 1 thread(s): Operations performed: 104857600 (2472121.34 ops/sec)
1 iter. Sysbench Memory for 2 thread(s): Operations performed: 104857600 (3182800.43 ops/sec)
2 iter. Sysbench Memory for 2 thread(s): Operations performed: 104857600 (3379413.65 ops/sec)
3 iter. Sysbench Memory for 2 thread(s): Operations performed: 104857600 (3306495.59 ops/sec)
1 iter. Sysbench Memory for 4 thread(s): Operations performed: 104857600 (4300089.71 ops/sec)
2 iter. Sysbench Memory for 4 thread(s): Operations performed: 104857600 (4163689.93 ops/sec)
3 iter. Sysbench Memory for 4 thread(s): Operations performed: 104857600 (4163996.47 ops/sec)
If you translate the results into a table view, you get the following:
| Test | Iter 1 | Iter 2 | Iter 3 | Average | Stdev |
|---|---|---|---|---|---|
| FIO READ IOPS | 3715.00 | 3875.00 | 3694.00 | 3761.33 | 99.00 |
| FIO WRITE IOPS | 1591.00 | 1659.00 | 1583.00 | 1611.00 | 41.76 |
| STRESS-NG 1 CPU | 12227.00 | 12399.00 | 12134.00 | 12253.33 | 134.45 |
| STRESS-NG 2 CPU | 23812.00 | 23558.00 | 21254.00 | 22874.67 | 1409.27 |
| STRESS-NG 4 CPU | 39495.00 | 39876.00 | 42370.00 | 40580.33 | 1561.56 |
| Sysbench CPU for 1 | 11.06 | 11.05 | 11.05 | 11.05 | 0.01 |
| Sysbench CPU for 2 | 5.62 | 5.57 | 5.54 | 5.57 | 0.04 |
| Sysbench CPU for 4 | 2.84 | 2.88 | 2.82 | 2.85 | 0.03 |
| Sysbench Mem t 1 | 2537704.01 | 2536025.17 | 2472121.34 | 2515283.51 | 37388.96 |
| Sysbench mem t 2 | 3182800.43 | 3379413.65 | 3306495.59 | 3289569.89 | 99393.41 |
| Sysbench mem t 4 | 4300089.71 | 4163689.93 | 4163996.47 | 4209258.70 | 78662.11 |
Well, there are reference data, now directly the results of testing providers.
Further, I will not give complete logs so as not to inflate the article, but they are stored with me, if you wish, ask for a link, I will share it, although the data from them are transferred to a table.
Yandex.Oblako
Results for ru-central1-a zone:
Result table
| Test | Iter 1 | Iter 2 | Iter 3 | Average | StDev |
|---|---|---|---|---|---|
| FIO READ IOPS | 554.00 | 543.00 | 545.00 | 547.33 | 5.86 |
| FIO WRITE IOPS | 237.00 | 232.00 | 233.00 | 234.00 | 2.65 |
| STRESS-NG 1 CPU | 10236.00 | 10045.00 | 10161.00 | 10147.33 | 96.23 |
| STRESS-NG 2 CPU | 19756.00 | 19479.00 | 20291.00 | 19842.00 | 412.77 |
| STRESS-NG 4 CPU | 18743.00 | 17906.00 | 18192.00 | 18280.33 | 425.43 |
| Sysbench CPU for 1 | 11.94 | 11.95 | 11.98 | 11.96 | 0.02 |
| Sysbench CPU for 2 | 7.19 | 7.23 | 6.16 | 6.86 | 0.61 |
| Sysbench CPU for 4 | 3.72 | 3.72 | 3.70 | 3.71 | 0.01 |
| Sysbench Mem t 1 | 2080442.66 | 2085059.55 | 2079872.00 | 2081791.40 | 2844.64 |
| Sysbench Mem t 2 | 2460594.62 | 2715142.01 | 2536824.57 | 2570853.73 | 130641.04 |
| Sysbench Mem t 4 | 2978385.59 | 2928369.70 | 3020014.59 | 2975589.96 | 45886.36 |
Results for ru-central1-b zone:
Result table
| Test | Iter 1 | Iter 2 | Iter 3 | Average | StDev |
|---|---|---|---|---|---|
| FIO READ IOPS | 543.00 | 537.00 | 523.00 | 534.33 | 10.26 |
| FIO WRITE IOPS | 232.00 | 230.00 | 224.00 | 228.67 | 4.16 |
| STRESS-NG 1 CPU | 10634.00 | 10848.00 | 11870.00 | 11117.33 | 660.55 |
| STRESS-NG 2 CPU | 22109.00 | 20861.00 | 21020.00 | 21330.00 | 679.30 |
| STRESS-NG 4 CPU | 18964.00 | 19449.00 | 18992.00 | 19135.00 | 272.29 |
| Sysbench CPU for 1 | 11.30 | 11.35 | 11.34 | 11.33 | 0.03 |
| Sysbench CPU for 2 | 5.87 | 5.88 | 5.89 | 5.88 | 0.01 |
| Sysbench CPU for 4 | 3.56 | 3.55 | 3.54 | 3.55 | 0.01 |
| Sysbench Mem t 1 | 2190808.15 | 2197111.57 | 2197600.12 | 2195173.28 | 3788.20 |
| Sysbench Mem t 2 | 2442631.19 | 2433028.20 | 2415710.66 | 2430456.68 | 13643.25 |
| Sysbench Mem t 4 | 3010239.12 | 3168720.68 | 3088677.50 | 3089212.43 | 79242.13 |
Results for ru-central1-c zone:
Result table
| Test | Iter 1 | Iter 2 | Iter 3 | Average | StDev |
|---|---|---|---|---|---|
| FIO READ IOPS | 541.00 | 551.00 | 558.00 | 550.00 | 8.54 |
| FIO WRITE IOPS | 232.00 | 236.00 | 239.00 | 235.67 | 3.51 |
| STRESS-NG 1 CPU | 10424.00 | 10192.00 | 10325.00 | 10313.67 | 116.41 |
| STRESS-NG 2 CPU | 19637.00 | 20330.00 | 19585.00 | 19850.67 | 415.93 |
| STRESS-NG 4 CPU | 28884.00 | 28477.00 | 28750.00 | 28703.67 | 207.42 |
| Sysbench CPU for 1 | 11.67 | 11.64 | 11.68 | 11.67 | 0.02 |
| Sysbench CPU for 2 | 6.02 | 6.05 | 7.06 | 6.38 | 0.59 |
| Sysbench CPU for 4 | 3.40 | 3.40 | 3.40 | 3.40 | 0.00 |
| Sysbench Mem t 1 | 2131168.41 | 2130201.75 | 2142809.68 | 2134726.61 | 7016.81 |
| Sysbench Mem t 2 | 2777100.50 | 2592860.27 | 2226863.89 | 2532274.89 | 280076.82 |
| Sysbench Mem t 4 | 2834838.09 | 2935298.85 | 2753443.73 | 2841193.56 | 91093.99 |
Summary results:
| Test | Average | Avg min | Avg max | Stdev | StDev% |
|---|---|---|---|---|---|
| FIO READ IOPS | 543.89 | 534.33 | 550.00 | 8.38 | 1.5% |
| FIO WRITE IOPS | 232.78 | 228.67 | 235.67 | 3.66 | 1.6% |
| STRESS-NG 1 CPU | 10526.11 | 10147.33 | 11117.33 | 518.72 | 4.9% |
| STRESS-NG 2 CPU | 20340.89 | 19842.00 | 21330.00 | 856.61 | 4.2% |
| STRESS-NG 4 CPU | 22039.67 | 18280.33 | 28703.67 | 5786.99 | 26.3% |
| Sysbench CPU for 1 | 11.65 | 11.33 | 11.96 | 0.31 | 2.7% |
| Sysbench CPU for 2 | 6.37 | 5.88 | 6.86 | 0.49 | 7.7% |
| Sysbench CPU for 4 | 3.55 | 3.40 | 3.71 | 0.16 | 4.5% |
| Sysbench Mem t 1 | 2137230.43 | 2081791.40 | 2195173.28 | 56732.39 | 2.7% |
| Sysbench mem t 2 | 2511195.10 | 2430456.68 | 2570853.73 | 72533.45 | 2.9% |
| Sysbench mem t 4 | 2968665.32 | 2841193.56 | 3089212.43 | 124154.35 | 4.2% |
I want to draw special attention to one remarkable fact.
With a full load of all cores of virtual machines in zones A and B, the total performance is LOWER than with a load of only two cores out of four.
Moreover, I took additional cars in one of the zones and drove the test for them - the problem did not go anywhere.
I suppose that this is a technical problem and it is connected with the hardware features of the machines used for hypervisors and taking them into account when allocating resources (such an experience case is recalled). Well, or with something else, I can’t look inside, but I don’t want to guess much.
Hopefully, comrades from Ya. Oblak will read this article and do something with it, and if you are very lucky, they will tell you what it is, but it turns out somewhat insulting and sometimes unpleasant (many applications focus on the number of cores to calculate the number of threads) .
Mail.RU Cloud (MCS)
Mail.ru has only two availability zones, so two tests were performed on different machines in the same zone.
Results for the Moscow-East zone (the first VM):
Results table
| Test | Iter 1 | Iter 2 | Iter 3 | Average | StDev |
|---|---|---|---|---|---|
| FIO READ IOPS | 487.00 | 538.00 | 534.00 | 519.67 | 28.36 |
| FIO WRITE IOPS | 209.00 | 231.00 | 229.00 | 223.00 | 12.17 |
| STRESS-NG 1 CPU | 7359.00 | 6567.00 | 7022.00 | 6982.67 | 397.46 |
| STRESS-NG 2 CPU | 14144.00 | 14916.00 | 13137.00 | 14065.67 | 892.08 |
| STRESS-NG 4 CPU | 21381.00 | 21199.00 | 21032.00 | 21204.00 | 174.55 |
| Sysbench CPU for 1 | 15.54 | 16.20 | 14.98 | 15.57 | 0.61 |
| Sysbench CPU for 2 | 7.30 | 7.70 | 7.53 | 7.51 | 0.20 |
| Sysbench CPU for 4 | 4.02 | 4.09 | 3.79 | 3.96 | 0.16 |
| Sysbench Mem t 1 | 1117493.99 | 1161261.85 | 1423941.92 | 1234232.59 | 165744.17 |
| Sysbench Mem t 2 | 1819474.62 | 1692128.17 | 1668347.81 | 1726650.20 | 81262.88 |
| Sysbench Mem t 4 | 2357943.97 | 2379492.56 | 2312976.14 | 2350137.56 | 33938.38 |
Results for the zone "Moscow-East" (second VM):
Test results
| Test | Iter 1 | Iter 2 | Iter 3 | Average | StDev |
|---|---|---|---|---|---|
| FIO READ IOPS | 475.00 | 509.00 | 472.00 | 485.33 | 20.55 |
| FIO WRITE IOPS | 205.00 | 218.00 | 204.00 | 209.00 | 7.81 |
| STRESS-NG 1 CPU | 6953.00 | 7030.00 | 7127.00 | 7036.67 | 87.19 |
| STRESS-NG 2 CPU | 14623.00 | 13945.00 | 13523.00 | 14030.33 | 554.94 |
| STRESS-NG 4 CPU | 27022.00 | 27184.00 | 27670.00 | 27292.00 | 337.23 |
| Sysbench CPU for 1 | 14.88 | 13.44 | 14.45 | 14.26 | 0.74 |
| Sysbench CPU for 2 | 6.89 | 7.13 | 6.69 | 6.90 | 0.22 |
| Sysbench CPU for 4 | 3.52 | 3.49 | 3.68 | 3.57 | 0.10 |
| Sysbench Mem t 1 | 1129165.42 | 1238462.80 | 1344025.16 | 1237217.79 | 107435.28 |
| Sysbench Mem t 2 | 1904396.37 | 1740914.98 | 1733216.87 | 1792842.74 | 96684.92 |
| Sysbench Mem t 4 | 2416702.17 | 2437844.98 | 2384159.80 | 2412902.32 | 27043.55 |
Results for the zone "Moscow-North":
Test results
| Test | Iter 1 | Iter 2 | Iter 3 | Average | StDev |
|---|---|---|---|---|---|
| FIO READ IOPS | 510.00 | 647.00 | 613.00 | 590.00 | 71.34 |
| FIO WRITE IOPS | 218.00 | 277.00 | 262.00 | 252.33 | 30.66 |
| STRESS-NG 1 CPU | 9657.00 | 9742.00 | 9867.00 | 9755.33 | 105.63 |
| STRESS-NG 2 CPU | 19251.00 | 20069.00 | 19677.00 | 19665.67 | 409.12 |
| STRESS-NG 4 CPU | 39020.00 | 38665.00 | 38461.00 | 38715.33 | 282.88 |
| Sysbench CPU for 1 | 12.45 | 12.53 | 12.66 | 12.55 | 0.11 |
| Sysbench CPU for 2 | 6.25 | 6.20 | 6.22 | 6.22 | 0.02 |
| Sysbench CPU for 4 | 3.18 | 3.16 | 3.16 | 3.17 | 0.01 |
| Sysbench Mem t 1 | 2003899.51 | 1990350.38 | 1974380.86 | 1989543.58 | 14775.85 |
| Sysbench Mem t 2 | 1990419.20 | 2022621.53 | 1934822.52 | 1982621.08 | 44415.93 |
| Sysbench Mem t 4 | 2337084.52 | 2227633.06 | 2021779.21 | 2195498.93 | 160090.01 |
Summary results:
| Test | Average | Avg min | Avg max | Stdev | StDev% |
|---|---|---|---|---|---|
| FIO READ IOPS | 531.67 | 485.33 | 590.00 | 53.36 | 10.0% |
| FIO WRITE IOPS | 228.11 | 209.00 | 252.33 | 22.11 | 9.7% |
| STRESS-NG 1 CPU | 7924.89 | 6982.67 | 9755.33 | 1585.44 | 20.0% |
| STRESS-NG 2 CPU | 15920.56 | 14030.33 | 19665.67 | 3243.41 | 20.4% |
| STRESS-NG 4 CPU | 29070.44 | 21204.00 | 38715.33 | 8890.10 | 30.6% |
| Sysbench CPU for 1 | 14.13 | 12.55 | 15.57 | 1.52 | 10.7% |
| Sysbench CPU for 2 | 6.88 | 6.22 | 7.51 | 0.64 | 9.3% |
| Sysbench CPU for 4 | 3.57 | 3.17 | 3.96 | 0.40 | 11.2% |
| Sysbench Mem t 1 | 1486997.99 | 1234232.59 | 1989543.58 | 435219.81 | 29.3% |
| Sysbench mem t 2 | 1834038.01 | 1726650.20 | 1982621.08 | 132864.82 | 7.2% |
| Sysbench mem t 4 | 2319512.93 | 2195498.93 | 2412902.32 | 111890.39 | 4.8% |
From the interesting, I would like to note that the performance degradation problems with the use of four threads are not here, and it seems that honest (though rather weak) kernels are issued.
Also, in the “North” zone, much more powerful processors are used than in the “East” zone, the difference in performance at full load reaches two times. For the same money. Draw your own conclusions.
Selectel
The results of his testing were very interesting. In the absolute, it provides the most powerful 4-core machines from all the tested providers.
Results for the zone "Moscow - Berzarina-1":
Test results
| Test | Iter 1 | Iter 2 | Iter 3 | Average | StDev |
|---|---|---|---|---|---|
| FIO READ IOPS | 2319.00 | 2294.00 | 2312.00 | 2308.33 | 12.90 |
| FIO WRITE IOPS | 998.00 | 986.00 | 995.00 | 993.00 | 6.24 |
| STRESS-NG 1 CPU | 11320.00 | 11038.00 | 10936.00 | 11098.00 | 198.91 |
| STRESS-NG 2 CPU | 23164.00 | 22093.00 | 22558.00 | 22605.00 | 537.04 |
| STRESS-NG 4 CPU | 43879.00 | 44118.00 | 44086.00 | 44027.67 | 129.74 |
| Sysbench CPU for 1 | 12.01 | 11.96 | 11.97 | 11.98 | 0.02 |
| Sysbench CPU for 2 | 6.01 | 5.99 | 5.99 | 6.00 | 0.02 |
| Sysbench CPU for 4 | 3.01 | 3.00 | 3.00 | 3.00 | 0.01 |
| Sysbench Mem t 1 | 2158876.40 | 2162098.22 | 2158738.03 | 2159904.22 | 1901.32 |
| Sysbench Mem t 2 | 2413547.34 | 2340801.67 | 2569554.40 | 2441301.14 | 116874.54 |
| Sysbench Mem t 4 | 2858920.38 | 2935705.54 | 2714476.62 | 2836367.51 | 112325.57 |
Results for the zone "Moscow - Berzarina-2":
Results table
| Test | Iter 1 | Iter 2 | Iter 3 | Average | StDev |
|---|---|---|---|---|---|
| FIO READ IOPS | 1735.00 | 1729.00 | 1724.00 | 1729.33 | 5.51 |
| FIO WRITE IOPS | 745.00 | 742.00 | 740.00 | 742.33 | 2.52 |
| STRESS-NG 1 CPU | 18231.00 | 18462.00 | 18518.00 | 18403.67 | 152.13 |
| STRESS-NG 2 CPU | 36965.00 | 36495.00 | 37006.00 | 36822.00 | 283.93 |
| STRESS-NG 4 CPU | 74272.00 | 74428.00 | 74218.00 | 74306.00 | 109.05 |
| Sysbench CPU for 1 | 11.22 | 11.17 | 11.15 | 11.18 | 0.03 |
| Sysbench CPU for 2 | 5.60 | 5.60 | 5.60 | 5.60 | 0.00 |
| Sysbench CPU for 4 | 2.83 | 2.81 | 2.81 | 2.82 | 0.01 |
| Sysbench Mem t 1 | 2396762.92 | 2405750.19 | 2394240.05 | 2398917.72 | 6050.06 |
| Sysbench Mem t 2 | 1980511.45 | 2079328.96 | 1968664.26 | 2009501.56 | 60761.74 |
| Sysbench Mem t 4 | 2283159.05 | 2271698.71 | 2299665.98 | 2284841.25 | 14059.32 |
Results for the SPB - Dubrovka-1 zone:
Results table
| Test | Iter 1 | Iter 2 | Iter 3 | Average | StDev |
|---|---|---|---|---|---|
| FIO READ IOPS | 2550.00 | 2618.00 | 2666.00 | 2611.33 | 58.29 |
| FIO WRITE IOPS | 1096.00 | 1126.00 | 1147.00 | 1123.00 | 25.63 |
| STRESS-NG 1 CPU | 10801.00 | 10512.00 | 11175.00 | 10829.33 | 332.41 |
| STRESS-NG 2 CPU | 21418.00 | 21642.00 | 23179.00 | 22079.67 | 958.62 |
| STRESS-NG 4 CPU | 44183.00 | 44557.00 | 43012.00 | 43917.33 | 806.03 |
| Sysbench CPU for 1 | 11.97 | 11.99 | 11.99 | 11.99 | 0.01 |
| Sysbench CPU for 2 | 5.99 | 5.99 | 6.00 | 5.99 | 0.01 |
| Sysbench CPU for 4 | 3.02 | 3.00 | 3.00 | 3.01 | 0.01 |
| Sysbench Mem t 1 | 2159958.70 | 2162062.66 | 2158540.58 | 2160187.31 | 1772.13 |
| Sysbench Mem t 2 | 2430650.73 | 2512678.85 | 2417945.57 | 2453758.38 | 51420.53 |
| Sysbench Mem t 4 | 3171660.68 | 3018827.14 | 3343661.47 | 3178049.76 | 162511.39 |
Summary table with the results:
| Test | Average | Avg min | Avg max | Stdev | StDev% |
|---|---|---|---|---|---|
| FIO READ IOPS | 2216.33 | 1729.33 | 2611.33 | 448.14 | 20.2% |
| FIO WRITE IOPS | 952.78 | 742.33 | 1123.00 | 193.49 | 20.3% |
| STRESS-NG 1 CPU | 13443.67 | 10829.33 | 18403.67 | 4297.59 | 32.0% |
| STRESS-NG 2 CPU | 27168.89 | 22079.67 | 36822.00 | 8363.96 | 30.8% |
| STRESS-NG 4 CPU | 54083.67 | 43917.33 | 74306.00 | 17513.14 | 32.4% |
| Sysbench CPU for 1 | 11.72 | 11.18 | 11.99 | 0.46 | 4.0% |
| Sysbench CPU for 2 | 5.86 | 5.60 | 6.00 | 0.23 | 3.9% |
| Sysbench CPU for 4 | 2.94 | 2.82 | 3.01 | 0.11 | 3.7% |
| Sysbench Mem t 1 | 2239669.75 | 2159904.22 | 2398917.72 | 137912.86 | 6.2% |
| Sysbench mem t 2 | 2301520.36 | 2009501.56 | 2453758.38 | 252972.39 | 11.0% |
| Sysbench mem t 4 | 2766419.51 | 2284841.25 | 3178049.76 | 450693.81 | 16.3% |
As I have already said, of all the tested, this provider provides the most efficient machines per 4 streams. But even here there is a feature - again, for the same money, we get performance that differs by almost 2 times - compare the results of Berezin-2 with the rest.
Also, I would like to note very fast drives at a reasonable price, the best of the three domestic providers that are available from the three tested. At the same time, the machine with the fastest processor has the slowest disk out of three.
It turns out a kind of lottery, however, taking into account that even if you are not lucky, everything will still be very, very decent.
Google cloud
GCE test results did not bring any special surprises.
Everything is completely predictable, homogeneous and in general corresponds to the declared.
Results for europe-west1-b zone:
Test results
| Test | Iter 1 | Iter 2 | Iter 3 | Average | StDev |
|---|---|---|---|---|---|
| FIO READ IOPS | 924.00 | 910.00 | 888.00 | 907.33 | 18.15 |
| FIO WRITE IOPS | 396.00 | 391.00 | 380.00 | 389.00 | 8.19 |
| STRESS-NG 1 CPU | 14237.00 | 14137.00 | 14094.00 | 14156.00 | 73.37 |
| STRESS-NG 2 CPU | 28576.00 | 28419.00 | 28544.00 | 28513.00 | 82.96 |
| STRESS-NG 4 CPU | 29996.00 | 29880.00 | 29449.00 | 29775.00 | 288.22 |
| Sysbench CPU for 1 | 12.63 | 12.66 | 12.67 | 12.65 | 0.02 |
| Sysbench CPU for 2 | 6.52 | 6.41 | 6.38 | 6.44 | 0.08 |
| Sysbench CPU for 4 | 3.35 | 3.56 | 3.56 | 3.49 | 0.12 |
| Sysbench Mem t 1 | 2055240.49 | 2056617.63 | 2054720.94 | 2055526.35 | 980.13 |
| Sysbench Mem t 2 | 1377683.73 | 1346931.63 | 1397680.79 | 1374098.72 | 25563.81 |
| Sysbench Mem t 4 | 2279937.89 | 2275427.56 | 2278615.94 | 2277993.80 | 2318.63 |
Results for europe-west-1c zone:
Test results
| FIO READ IOPS | 946.00 | 995.00 | 984.00 | 975.00 | 25.71 |
|---|---|---|---|---|---|
| FIO WRITE IOPS | 406.00 | 428.00 | 422.00 | 418.67 | 11.37 |
| STRESS-NG 1 CPU | 14256.00 | 14250.00 | 14423.00 | 14309.67 | 98.20 |
| STRESS-NG 2 CPU | 28875.00 | 29057.00 | 29256.00 | 29062.67 | 190.56 |
| STRESS-NG 4 CPU | 30317.00 | 30462.00 | 29478.00 | 30085.67 | 531.23 |
| Sysbench CPU for 1 | 12.52 | 12.49 | 12.61 | 12.54 | 0.06 |
| Sysbench CPU for 2 | 6.28 | 6.30 | 6.31 | 6.29 | 0.02 |
| Sysbench CPU for 4 | 3.38 | 3.57 | 3.52 | 3.49 | 0.10 |
| Sysbench Mem t 1 | 2085832.84 | 2066794.24 | 2086303.39 | 2079643.49 | 11130.26 |
| Sysbench Mem t 2 | 1368168.11 | 1535725.51 | 1710618.59 | 1538170.74 | 171238.33 |
| Sysbench Mem t 4 | 2375534.54 | 2307610.22 | 2386046.89 | 2356397.22 | 42576.47 |
Results for europe-west1-d zone:
Test results
| Test | Iter 1 | Iter 2 | Iter 3 | Average | StDev |
|---|---|---|---|---|---|
| FIO READ IOPS | 885.00 | 910.00 | 943.00 | 912.67 | 29.09 |
| FIO WRITE IOPS | 379.00 | 390.00 | 405.00 | 391.33 | 13.05 |
| STRESS-NG 1 CPU | 14254.00 | 14230.00 | 14008.00 | 14164.00 | 135.63 |
| STRESS-NG 2 CPU | 28262.00 | 28321.00 | 28473.00 | 28352.00 | 108.86 |
| STRESS-NG 4 CPU | 29615.00 | 29312.00 | 29138.00 | 29355.00 | 241.39 |
| Sysbench CPU for 1 | 12.61 | 12.65 | 12.66 | 12.64 | 0.03 |
| Sysbench CPU for 2 | 6.37 | 6.35 | 6.35 | 6.36 | 0.01 |
| Sysbench CPU for 4 | 3.43 | 3.56 | 3.55 | 3.52 | 0.07 |
| Sysbench Mem t 1 | 2050031.60 | 2068677.64 | 2052707.70 | 2057138.98 | 10081.96 |
| Sysbench Mem t 2 | 1228313.90 | 1530374.73 | 1345581.79 | 1368090.14 | 152283.14 |
| Sysbench Mem t 4 | 2335035.15 | 2420871.72 | 2361505.39 | 2372470.75 | 43956.33 |
Summary table with the results:
| Test | Average | Avg min | Avg max | Stdev | StDev% |
|---|---|---|---|---|---|
| FIO READ IOPS | 931.67 | 907.33 | 975.00 | 37.62 | 4.0% |
| FIO WRITE IOPS | 399.67 | 389.00 | 418.67 | 16.50 | 4.1% |
| STRESS-NG 1 CPU | 14209.89 | 14156.00 | 14309.67 | 86.50 | 0.6% |
| STRESS-NG 2 CPU | 28642.56 | 28352.00 | 29062.67 | 372.63 | 1.3% |
| STRESS-NG 4 CPU | 29738.56 | 29355.00 | 30085.67 | 366.69 | 1.2% |
| Sysbench CPU for 1 | 12.61 | 12.54 | 12.65 | 0.06 | 0.5% |
| Sysbench CPU for 2 | 6.36 | 6.29 | 6.44 | 0.07 | 1.1% |
| Sysbench CPU for 4 | 3.50 | 3.49 | 3.52 | 0.01 | 0.4% |
| Sysbench Mem t 1 | 2064102.94 | 2055526.35 | 2079643.49 | 13482.64 | 0.7% |
| Sysbench mem t 2 | 1426786.53 | 1368090.14 | 1538170.74 | 96508.32 | 6.8% |
| Sysbench mem t 4 | 2335620.59 | 2277993.80 | 2372470.75 | 50549.23 | 2.2% |
There is nothing to even comment on.
Performance in 4 threads hardly differs from two, but does not degrade.
In general, each core is very productive and half as powerful as the kernel of the test virtuals, which goes out-of-competition, and they are not to be said to be the weakest.
The disks of stars from the sky are not enough, but for most tasks there will be plenty of them.
The only thing worth mentioning is the excellent homogeneity. Each of the machines differs in performance by no more than the measurement error, which gives excellent predictability and ease of planning.
AWS
The market leader, his test surprised me somewhat, since they have the same problem that Ya.Oblak showed up.
Despite the fact that I have been working with him for quite a long time, I somehow didn’t have much time to figure out the difference in performance between full load and partial load, so the results were a surprise to me to some extent.
For testing, we used the c5.xlarge type, as the cheapest of the matching requirements.
Results for the eu-central-1a zone:
Test results
| Test | Iter 1 | Iter 2 | Iter 3 | Average | StDev |
|---|---|---|---|---|---|
| FIO READ IOPS | 1839.00 | 1976.00 | 2083.00 | 1966.00 | 122.31 |
| FIO WRITE IOPS | 789.00 | 850.00 | 895.00 | 844.67 | 53.20 |
| STRESS-NG 1 CPU | 21422.00 | 21722.00 | 21736.00 | 21626.67 | 177.38 |
| STRESS-NG 2 CPU | 43305.00 | 43331.00 | 43197.00 | 43277.67 | 71.06 |
| STRESS-NG 4 CPU | 40876.00 | 40884.00 | 40888.00 | 40882.67 | 6.11 |
| Sysbench CPU for 1 | 8.77 | 8.77 | 8.77 | 8.77 | 0.00 |
| Sysbench CPU for 2 | 4.40 | 4.40 | 4.40 | 4.40 | 0.00 |
| Sysbench CPU for 4 | 2.52 | 2.52 | 2.52 | 2.52 | 0.00 |
| Sysbench Mem t 1 | 3063495.18 | 3064238.67 | 3063452.11 | 3063728.65 | 442.21 |
| Sysbench Mem t 2 | 1848705.16 | 1841708.24 | 1751938.22 | 1814117.21 | 53962.11 |
| Sysbench Mem t 4 | 2413033.89 | 2249609.19 | 2299986.20 | 2320876.43 | 83691.15 |
Results for the zone eu-central-1b:
Test results
| Test | Iter 1 | Iter 2 | Iter 3 | Average | StDev |
|---|---|---|---|---|---|
| FIO READ IOPS | 1723.00 | 1988.00 | 2101.00 | 1937.33 | 194.03 |
| FIO WRITE IOPS | 739.00 | 855.00 | 903.00 | 832.33 | 84.32 |
| STRESS-NG 1 CPU | 21785.00 | 21733.00 | 21741.00 | 21753.00 | 28.00 |
| STRESS-NG 2 CPU | 43370.00 | 43323.00 | 40351.00 | 42348.00 | 1729.61 |
| STRESS-NG 4 CPU | 40857.00 | 40864.00 | 40916.00 | 40879.00 | 32.23 |
| Sysbench CPU for 1 | 8.77 | 8.77 | 8.77 | 8.77 | 0.00 |
| Sysbench CPU for 2 | 4.39 | 4.40 | 4.39 | 4.39 | 0.00 |
| Sysbench CPU for 4 | 2.52 | 2.52 | 2.52 | 2.52 | 0.00 |
| Sysbench Mem t 1 | 3065227.23 | 3065688.95 | 3063830.23 | 3064915.47 | 967.78 |
| Sysbench Mem t 2 | 2032840.35 | 1987864.46 | 1968489.39 | 1996398.07 | 33013.31 |
| Sysbench Mem t 4 | 2684716.32 | 2654257.87 | 2618592.53 | 2652522.24 | 33096.05 |
Results for the eu-central-1c zone:
Test results
| Test | Iter 1 | Iter 2 | Iter 3 | Average | StDev |
|---|---|---|---|---|---|
| FIO READ IOPS | 1761.00 | 2003.00 | 2108.00 | 1957.33 | 177.95 |
| FIO WRITE IOPS | 756.00 | 861.00 | 906.00 | 841.00 | 76.97 |
| STRESS-NG 1 CPU | 21632.00 | 21708.00 | 21615.00 | 21651.67 | 49.52 |
| STRESS-NG 2 CPU | 43247.00 | 43236.00 | 43283.00 | 43255.33 | 24.58 |
| STRESS-NG 4 CPU | 39931.00 | 39359.00 | 40835.00 | 40041.67 | 744.20 |
| Sysbench CPU for 1 | 8.77 | 8.77 | 8.77 | 8.77 | 0.00 |
| Sysbench CPU for 2 | 4.40 | 4.40 | 4.40 | 4.40 | 0.00 |
| Sysbench CPU for 4 | 2.52 | 2.52 | 2.52 | 2.52 | 0.00 |
| Sysbench Mem t 1 | 3064343.66 | 3064434.20 | 2998820.16 | 3042532.67 | 37856.17 |
| Sysbench Mem t 2 | 2235882.60 | 2088501.51 | 2166875.91 | 2163753.34 | 73740.15 |
| Sysbench Mem t 4 | 2870035.79 | 2813221.50 | 2771999.66 | 2818418.98 | 49224.29 |
Summary table of results:
| Test | Average | Avg min | Avg max | Stdev | StDev% |
|---|---|---|---|---|---|
| FIO READ IOPS | 1953.56 | 1937.33 | 1966.00 | 14.70 | 0.8% |
| FIO WRITE IOPS | 839.33 | 832.33 | 844.67 | 6.33 | 0.8% |
| STRESS-NG 1 CPU | 21677.11 | 21626.67 | 21753.00 | 66.90 | 0.3% |
| STRESS-NG 2 CPU | 42960.33 | 42348.00 | 43277.67 | 530.41 | 1.2% |
| STRESS-NG 4 CPU | 40601.11 | 40041.67 | 40882.67 | 484.50 | 1.2% |
| Sysbench CPU for 1 | 8.77 | 8.77 | 8.77 | 0.00 | 0.0% |
| Sysbench CPU for 2 | 4.40 | 4.39 | 4.40 | 0.00 | 0.1% |
| Sysbench CPU for 4 | 2.52 | 2.52 | 2.52 | 0.00 | 0.1% |
| Sysbench Mem t 1 | 3057058.93 | 3042532.67 | 3064915.47 | 12594.10 | 0.4% |
| Sysbench Mem t 2 | 1991422.87 | 1814117.21 | 2163753.34 | 174871.16 | 8.8% |
| Sysbench Mem t 4 | 2597272.55 | 2320876.43 | 2818418.98 | 253330.90 | 9.8% |
As I said above - the results surprised me.
Yes, I understand that the problem manifests itself explicitly only under certain types of load (it is not visible in Sysbench), but considering the results of other platforms, this is clearly not a problem with the test, but performance limitations.
In defense of AWS, I can say that when creating a machine, it allows you to disable HyperThreading, which at least helps to eliminate the problem with performance loss in some applications.
Otherwise, the disks do not guarantee such performance, but they support Burst to smooth the loads, so if you need to read / pee relatively much, quickly, but not very often (say, every few minutes), then everything will be fine.
Also, the homogeneity of the results is simply excellent, everything is predictable and without surprises.
Azure
Initially, I did not want to include it in the test, because I have never really worked with him, and even I didn’t have an account there. But, on reflection, I decided to test it all the same, for even bill
At once I want to explain that the region was chosen from the principle “somewhere in Europe”, and the type of machine is 100% suitable for the conditions (4 processors, 8GB of memory).
In the first iteration of the test, it was A4 v2, marked as “General purpose”, with which this article was published. Experts who came to the comments explained to me what I did wrong and that Azure has a machine that is slower can cost more than the one that is faster and without reading the documentation or googling about it . After that, the results were updated based on the type F4s
Results for France-Central-1:
Test results
| Test | Iter 1 | Iter 2 | Iter 3 | Awerage | StDev |
|---|---|---|---|---|---|
| FIO READ IOPS | 1066.00 | 1102.00 | 1038.00 | 1068.67 | 32.08 |
| FIO WRITE IOPS | 457.00 | 473.00 | 445.00 | 458.33 | 14.05 |
| STRESS-NG 1 CPU | 9470.00 | 10059.00 | 10759.00 | 10096.00 | 645.30 |
| STRESS-NG 2 CPU | 20424.00 | 20502.00 | 20940.00 | 20622.00 | 278.14 |
| STRESS-NG 4 CPU | 39039.00 | 39294.00 | 39141.00 | 39158.00 | 128.35 |
| Sysbench CPU for 1 | 10.32 | 10.42 | 10.50 | 10.42 | 0.09 |
| Sysbench CPU for 2 | 5.35 | 5.35 | 5.33 | 5.35 | 0.01 |
| Sysbench CPU for 4 | 2.77 | 2.78 | 2.76 | 2.77 | 0.01 |
| Sysbench Mem t 1 | 2449793.14 | 2467589.35 | 2456056.19 | 2457812.89 | 9027.22 |
| Sysbench Mem t 2 | 2370286.78 | 2388077.81 | 2299377.92 | 2352580.84 | 46925.93 |
| Sysbench Mem t 4 | 2697042.08 | 2625447.20 | 2707918.64 | 2676802.64 | 44806.37 |
Results for France-Central-2:
Test results
| Test | Iter 1 | Iter 2 | Iter 3 | Awerage | StDev |
|---|---|---|---|---|---|
| FIO READ IOPS | 1037.00 | 1104.00 | 1102.00 | 1081.00 | 38.12 |
| FIO WRITE IOPS | 445.00 | 473.00 | 473.00 | 463.67 | 16.17 |
| STRESS-NG 1 CPU | 10159.00 | 10360.00 | 10452.00 | 10323.67 | 149.84 |
| STRESS-NG 2 CPU | 21027.00 | 20025.00 | 20415.00 | 20489.00 | 505.08 |
| STRESS-NG 4 CPU | 39530.00 | 40927.00 | 40170.00 | 40209.00 | 699.32 |
| Sysbench CPU for 1 | 10.39 | 9.95 | 9.91 | 10.08 | 0.27 |
| Sysbench CPU for 2 | 5.09 | 5.13 | 5.19 | 5.14 | 0.05 |
| Sysbench CPU for 4 | 2.69 | 2.75 | 2.66 | 2.70 | 0.04 |
| Sysbench Mem t 1 | 2568336.75 | 2450640.64 | 2567906.16 | 2528961.18 | 67827.92 |
| Sysbench Mem t 2 | 2401273.88 | 2362027.64 | 2372950.76 | 2378750.76 | 20255.79 |
| Sysbench Mem t 4 | 2740927.62 | 2787787.19 | 2770497.39 | 2766404.07 | 23696.44 |
Results for France-Central-3:
Test results
| Test | Iter 1 | Iter 2 | Iter 3 | Awerage | StDev |
|---|---|---|---|---|---|
| FIO READ IOPS | 1436.00 | 830.00 | 1136.00 | 1134.00 | 303.00 |
| FIO WRITE IOPS | 614.00 | 355.00 | 487.00 | 485.33 | 129.51 |
| STRESS-NG 1 CPU | 10834.00 | 10326.00 | 10763.00 | 10641.00 | 275.10 |
| STRESS-NG 2 CPU | 21505.00 | 21108.00 | 21428.00 | 21347.00 | 210.53 |
| STRESS-NG 4 CPU | 42194.00 | 41540.00 | 41427.00 | 41720.33 | 414.08 |
| Sysbench CPU for 1 | 9.87 | 9.75 | 9.79 | 9.80 | 0.06 |
| Sysbench CPU for 2 | 5.04 | 5.05 | 5.13 | 5.08 | 0.05 |
| Sysbench CPU for 4 | 2.67 | 2.65 | 2.67 | 2.66 | 0.01 |
| Sysbench Mem t 1 | 2622263.24 | 2616326.80 | 2632668.25 | 2623752.76 | 8271.93 |
| Sysbench Mem t 2 | 2495841.62 | 2438685.04 | 2556294.51 | 2496940.39 | 58812.43 |
| Sysbench Mem t 4 | 2814306.59 | 2783117.34 | 2846909.91 | 2814777.95 | 31898.90 |
Summary table of results:
| Test | Average | Avg min | Avg max | Stdev | StDev% |
|---|---|---|---|---|---|
| FIO READ IOPS | 1094.56 | 1068.67 | 1134.00 | 34.71 | 3.2% |
| FIO WRITE IOPS | 469.11 | 458.33 | 485.33 | 14.30 | 3.0% |
| STRESS-NG 1 CPU | 10353.56 | 10096.00 | 10641.00 | 273.73 | 2.6% |
| STRESS-NG 2 CPU | 20819.33 | 20489.00 | 21347.00 | 461.79 | 2.2% |
| STRESS-NG 4 CPU | 40362.44 | 39158.00 | 41720.33 | 1288.04 | 3.2% |
| Sysbench CPU for 1 | 10.10 | 9.80 | 10.42 | 0.31 | 3.0% |
| Sysbench CPU for 2 | 5.19 | 5.08 | 5.35 | 0.14 | 2.7% |
| Sysbench CPU for 4 | 2.71 | 2.66 | 2.77 | 0.05 | 2.0% |
| Sysbench Mem t 1 | 2536842.28 | 2457812.89 | 2623752.76 | 83250.19 | 3.3% |
| Sysbench mem t 2 | 2409424.00 | 2352580.84 | 2496940.39 | 76912.65 | 3.2% |
| Sysbench mem t 4 | 2752661.55 | 2676802.64 | 2814777.95 | 70006.71 | 2.5% |
Good performance, one of the best among the platforms presented. True price spoils everything.
Results
Performance
Let's start with a pivot table of results.
I insert it with an image, because I want to use colors, but the data there is from the tables presented above.
The smaller, the better.
Let's take a closer look at CPU performance:
In general, the leadership in average measured performance for single and dual-core loads holds AWS firmly. In second place is Google Cloud.
Of the Russian providers, Selectel showed itself the best. In addition to the third place for incomplete load, it has an unambiguous first when all cores are loaded, even taking into account the non-uniformity of results between zones (which is unpleasant, but in this case does not affect).
Now Memory:
The speed of the memory
Wheels:
The speed of the disks we have a clear winner - Selectel. For comparison, none of the participants in the comparison offers anything like this.
In second place - AWS due to the allowed Burst and generally decent speed.
Behind him are GCE and Azure, and Ya.Oblako and MSC close the list, which offer roughly the same performance solutions.
Cost relative to performance
Now let's talk about another interesting factor - cost.
This comparison does not in any way cover the totality of the cost of solutions on different platforms, its purpose is simple - to compare the cost of a unit of productivity among different providers.
The calculation will take the stress-ng test.
Estimated prices for 1 month of using each instance (without VAT):
| Provider | Yandex.Cloud | MCS | Selectel | GCE | AWS | Azure |
|---|---|---|---|---|---|---|
| Price (cur) | 3799.12 | 3608 | 4050.624 | 103.08 | 147.57 | 147.46 |
| Price (rub) | 3799.12 | 3608 | 4050.624 | 6747.6168 | 9659.9322 | 9652.7316 |
| Alt price (cur) | 3799.12 | 3608 | 3,454.94 | 35.6 | 56.07 | 9652.7316 |
| Alt price (rub) | 3799.12 | 3608 | 3,454.94 | 2330.376 | 3670.3422 | 9652.7316 |
The cost table requires some explanation.
For those providers who have the opportunity to reduce the cost of resources described in the beginning of the article, there are two costs - the main and the alternative, calculated taking into account these possibilities.
Since this is not a discount and is tied to usage scenarios that are different, I’m considering a good idea to calculate the cost and with their consideration.
Also, because of the difference in currencies, the cost of AWS, Azure (yes, I know what it can show in rubles (somehow), their calculator showed me the values in dollars) and GCE is reduced to the ruble equivalent of the rate of 65.46 rubles for U.S. dollar.
Also, for Azure, I did not manage to allocate the cost of the disk, the standard instance disk there is 16 GB, how much the disk will actually cost from the calculator is not very clear (there is also the number of requests taken into account), so the price is indicated only for the instance itself , although the total this still does not change the situation, Azure remains the most expensive.
So, the cost of each decision, reduced to rubles for a parrot in the stress-ng test for the minimum amount of resources that were obtained in the test:
Less is better
If you count on the basis of average test results, the picture will not change fundamentally, but some things will change. will change:
Less is better
It turns out that in all categories, if you count without VAT, Selectel wins, and in the category of heavy load with almost double the gap.
Now let's see what happens if you re-read the cost, taking into account possible savings depending on the use case.
The alternative cost, taking into account the savings due to the use scenario, reduced to rubles for a parrot in the stress-ng test for the minimum amount of resources that were obtained in the test:
Less is better
It is the same, but to the average amount of resources:
Here the picture changes.
In all scenarios, except for the heavy, permanently full load, AWS and GCE come out ahead with a decent margin with almost identical cost per unit of resources.
In the case of a heavy load, Selectel is competing with them, offering resources for practically the same money, but with fewer “concessions” (yet its nodes are constant and do not turn off at an arbitrary point in time, unlike AWS Spot and Google Preemptible Instances).
So, if you carefully approach the architecture, you can save on seemingly empty space.
Instead of conclusions
The test turned out to be long, but as for me - interesting.
For myself, I made some conclusions on the results, I hope it will help you to look at the issue of cloud platform performance a bit from the other side and perhaps make a little easier choice of flour, as well as help in diagnosing performance problems on some platforms due to the identified "features".
** UPDATE ** Selectel conclusions and prices have been updated. they would incorrectly include VAT
** UPDATE2 ** The results of Azure are updated for a new type of node, the conclusions are updated, but nothing has changed in principle anyway
Only registered users can participate in the survey. Sign in , please.