Windows Defender Advanced Threat Protection Service
In early February, we told you about the detection of criminals using the ATP service in Windows Defender. Various questions appeared in the comments regarding the operation of the service, so we decided to share a detailed description of its functionality.

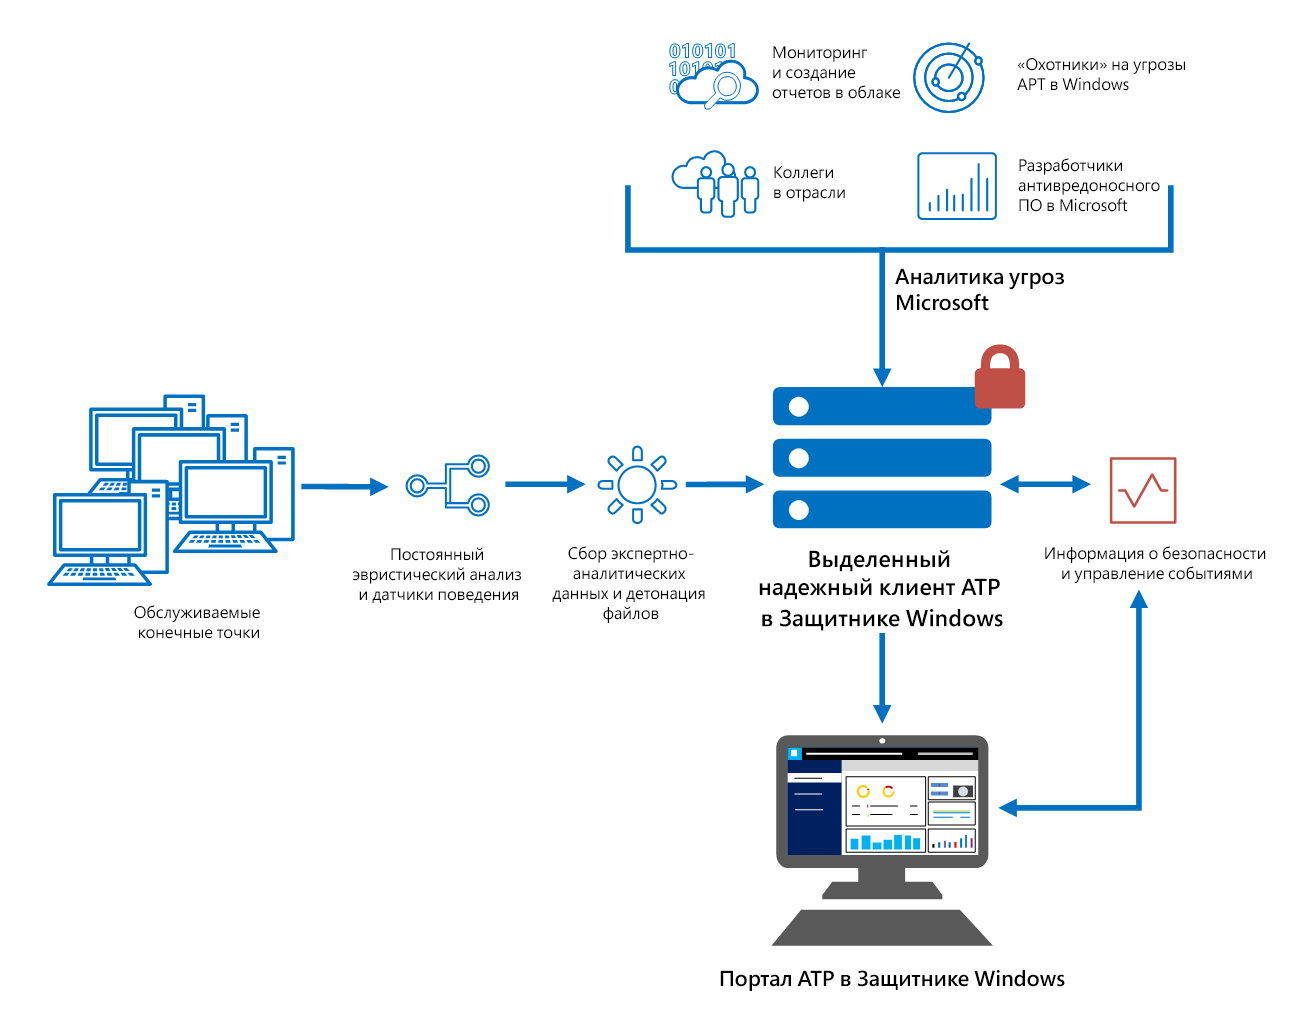
In short, Windows Defender ATP is a security service that can be used to detect security threats on your networks, investigate them and take action. The service is based on the combination of technologies and Microsoft cloud service built into Windows 10. Such technologies include:
Schematically, these service components are presented below.
Host exploration capabilities allow you to receive detailed alerts, understand the nature and extent of a possible intrusion.
Windows Defender ATP Service works with various Windows security technologies:
It can also work in parallel with third-party security solutions.
You can use the ATP portal to monitor and respond to threats. It solves the following tasks:
The portal interface includes four main workspaces:
With the settings, everything is quite obvious.
In the Navigation Panel, views such as:

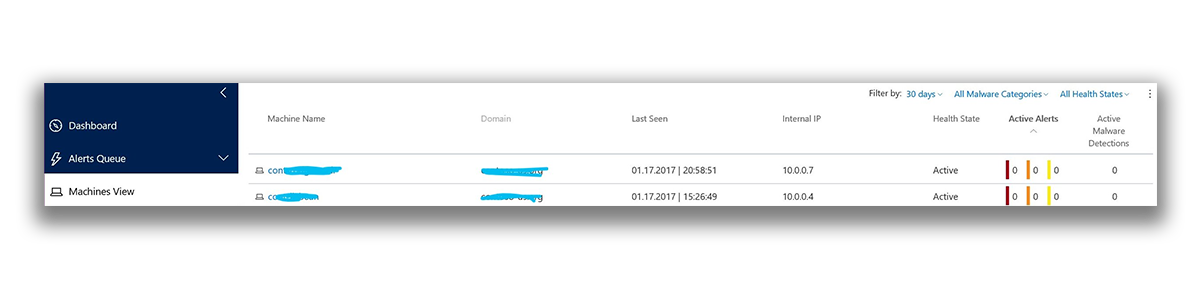
The computers section displays a list of computers that the ATP service protects and some information about them.
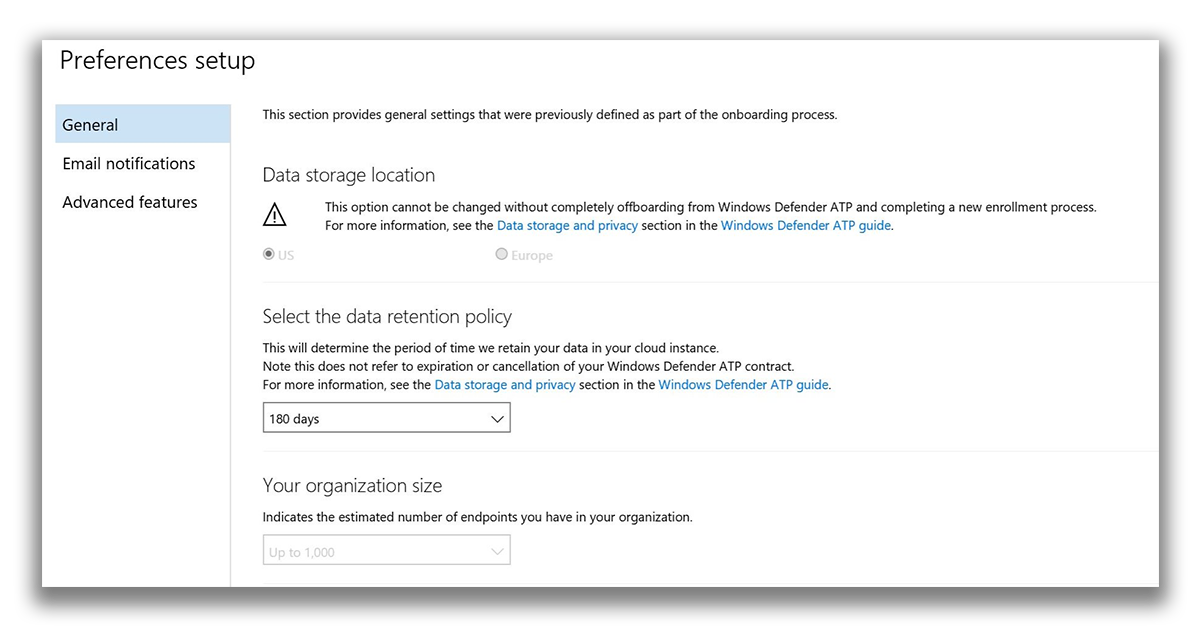
Priority setting allows you to configure email notifications or data storage policies (in other words, how much data will be stored in tenant).
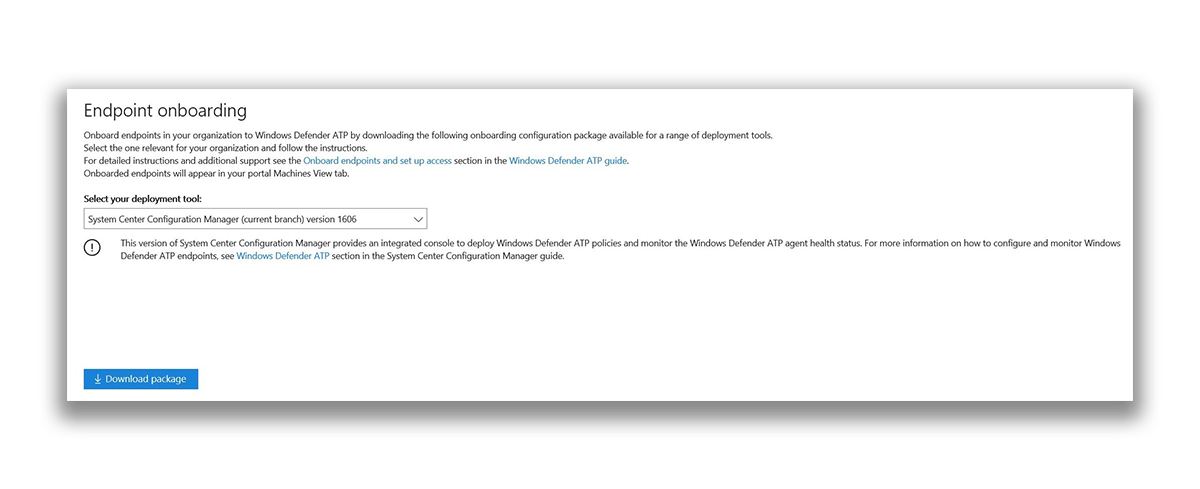
In the host management section , you can download the package for preparing machines for working with ATP.
ATP service and uses the following conventions:
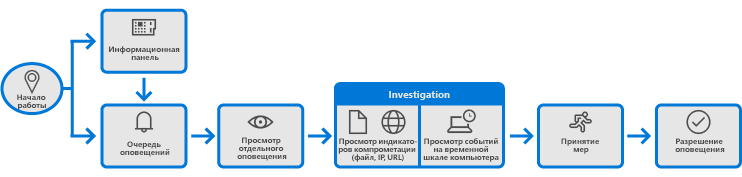
In general, the approach to investigating security holes using ATP can be divided into the following stages:
Since we start working with ATP by analyzing the data in the information panel, we will consider it in more detail. Data on alerts and computers allows you to quickly establish the fact, place and time of suspicious activity on the network - this provides the necessary context for understanding the situation. An event summary is also displayed here to help identify significant events or behavior on the computer. You can also open detailed information about events and indicators at a lower level. Active tiles provide visual clues to assess the overall state of security systems. Clicking on such a tile opens a detailed view of the corresponding component.
When you click on the ATP Alerts tile , the total number of active ATP service alerts on the network for the last 30 days is displayed. Alerts are divided into two groups: New and Running.
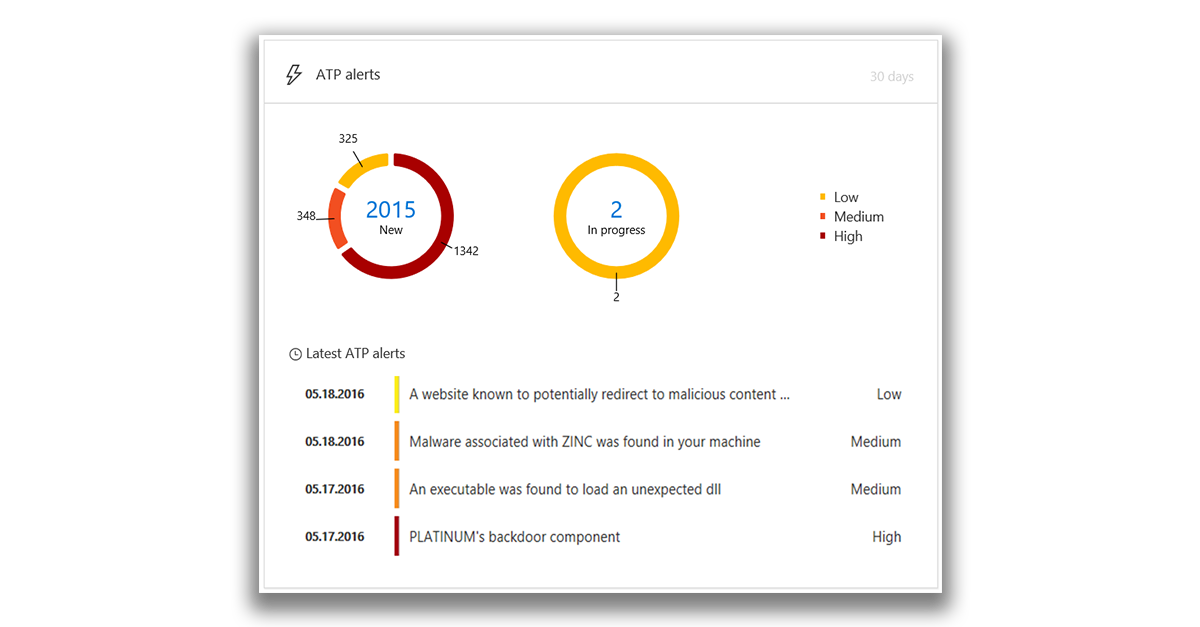
Each group has subcategories by severity level. By clicking on the number inside each, you can display the queue view of the corresponding category.
This tile shows the list of computers with the most active alerts. The total number of alerts for each computer is shown in a circle next to the computer name. On the opposite side of the tile is the number of alerts grouped by severity level. It is not difficult to guess that a dark color is more dangerous, and a lighter color is less.
The Status tile contains information about whether the service is active and whether there are problems, as well as the number of computers that sent reports to the service over the past 30 days.
Tile Computer Reportscontains a histogram that shows the number of computers that sent alerts by day. You can see the exact number of computers that sent alerts on a specific day by hovering over individual columns of the histogram.
The Computers tile with active malware detected is displayed only if Windows Defender is used at your endpoints. Active malware refers to threats that were actively executing at the time of detection. By moving the mouse cursor over each of the columns, you can see the number of active malware detected and the number of hosts on which at least one active malware has been detected in the last 30 days.

The scheme contains five categories of malware:
Threats are considered active if there is a very high probability that the malware was running on your network and not just locally stored on disk.
By clicking on any of these categories, you can go to the Computers view , where the data will be filtered for the corresponding category. This way you can get detailed information about which computers detected active malware and how many threats are registered on each of them.
Windows Defender ATP service alerts can be managed as part of regular daily tasks. Alerts are queued according to their current status. By default, alerts in the queue are sorted from last to oldest. The following table and screenshot show the main areas of the Alert Queues .

You can filter and sort the alert queue (make a summary) to identify the necessary alerts based on certain criteria. Three mechanisms are available for this:
To change the sort order (for example, displaying the oldest alerts first instead of the newest ones), you can click the sort order icon.
To start the analysis, and get detailed information you need to click on the notification in any queue.
Alert details include the following:
For alerts that have been correlated with the actions of the attacker or subject, a colored tile with the subject’s name is displayed.
By clicking on the name of the subject, you can view the profile of the threat analytics for him, including a brief overview of the subject, information about his interests or goals, tactics, methods and procedures, as well as information about his activity around the world. A set of recommended response actions will also be displayed.

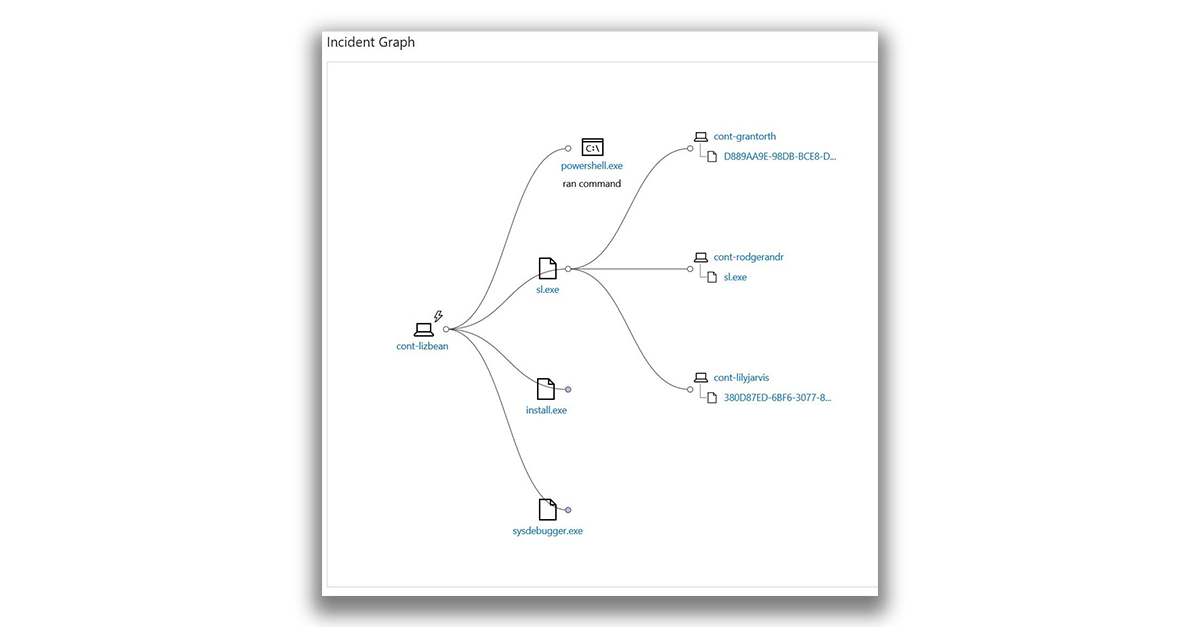
The incident graph includes a visual representation of the location of the alert, the events that led to its creation, and other computers affected by the event. The graph shows the effect of alerts on the source computer, as well as how this event affected the alerts on other computers.
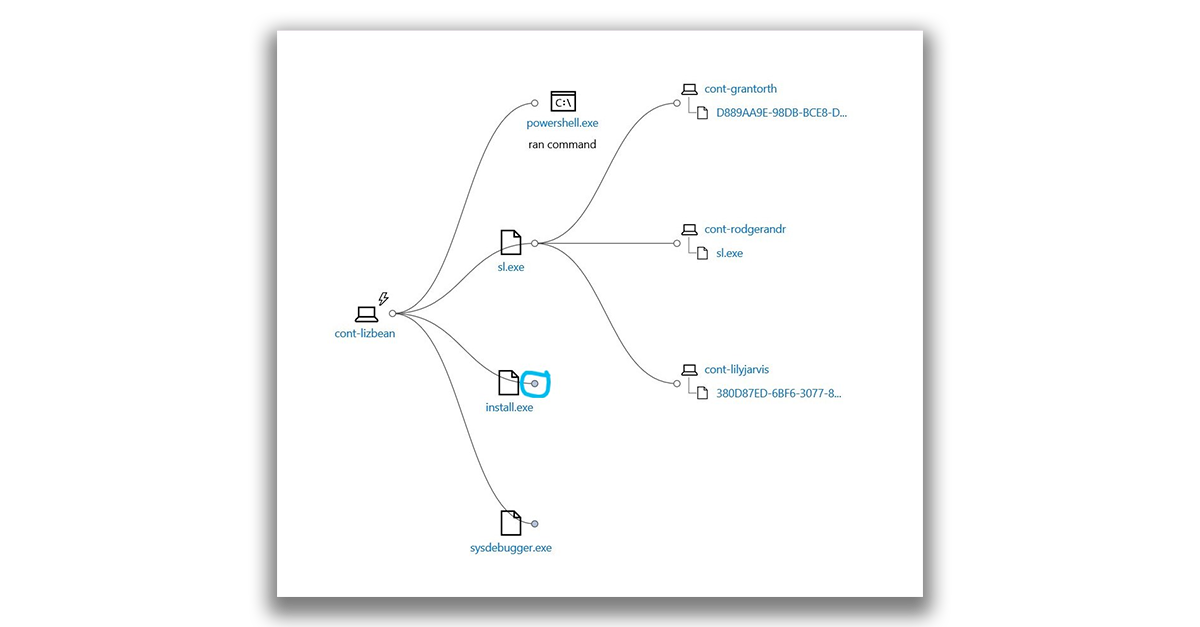
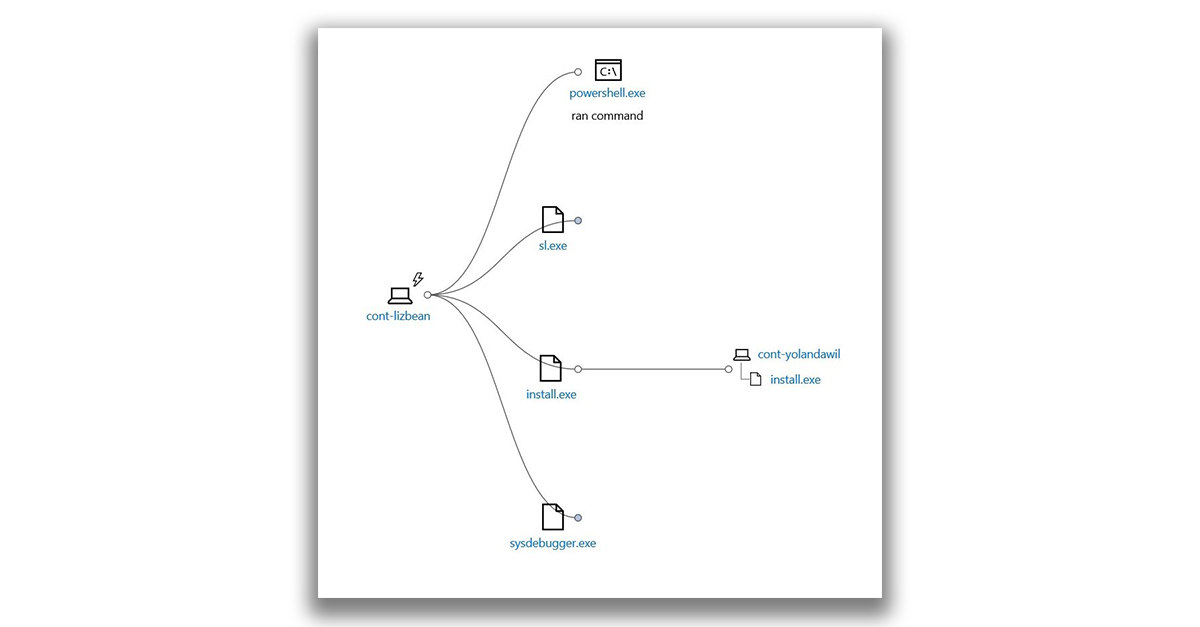
You can click the circle on the incident graph to expand the nodes and view the events or files that are associated with the alert.
We remind you that the ATP service in Windows Defender is built into the core of Windows 10 Enterprise, its work can be evaluated for free.
In short, Windows Defender ATP is a security service that can be used to detect security threats on your networks, investigate them and take action. The service is based on the combination of technologies and Microsoft cloud service built into Windows 10. Such technologies include:
- Host behavior sensors . These sensors are built into Windows 10. They collect and process operating system signals about behavior (such as process, registry, file, and network interactions) and send data to your private, isolated cloud instance of the ATP service.
- Cloud security analysis . In essence, it makes it possible to convert behavioral signals into analytical data to identify threats, and also helps with recommendations for their elimination.
- Threat Analytics . Microsoft has individual specialists and data security departments, in addition to this, analytic data on threats from partners is used. This allows the ATP service to identify means, technologies, and methods of attack. Alert users when they detect relevant signs in the data being collected.
Schematically, these service components are presented below.
Host exploration capabilities allow you to receive detailed alerts, understand the nature and extent of a possible intrusion.
Windows Defender ATP Service works with various Windows security technologies:
- Windows Defender
- Applocker
- Device guard
It can also work in parallel with third-party security solutions.
Windows Defender Advanced Threat Protection Portal Overview
You can use the ATP portal to monitor and respond to threats. It solves the following tasks:
- View, sort, and classify alerts from hosts.
- Search for additional information related to detected indicators. These can be specific files or IP addresses.
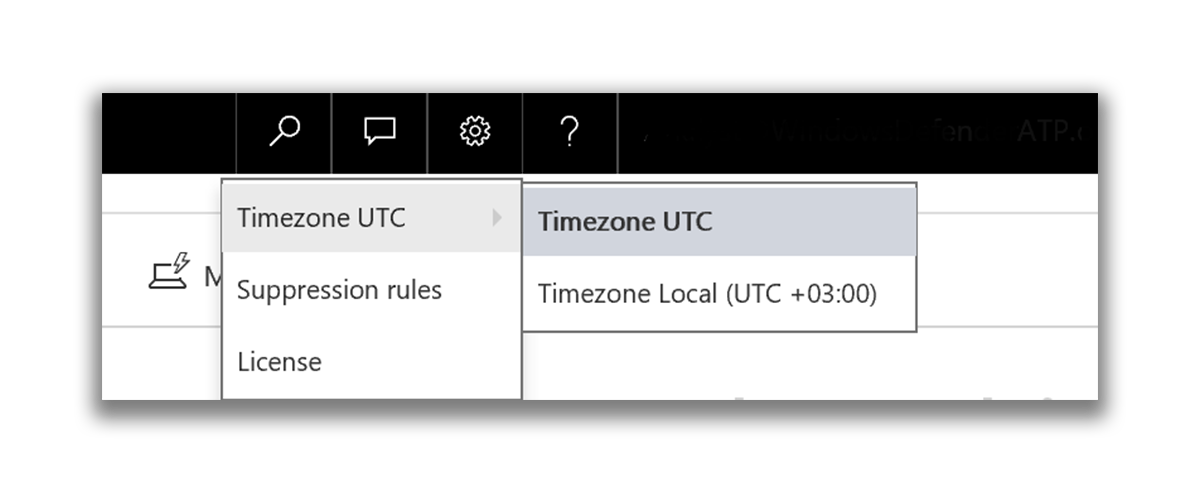
- Change various service settings: time zone and alert rules.
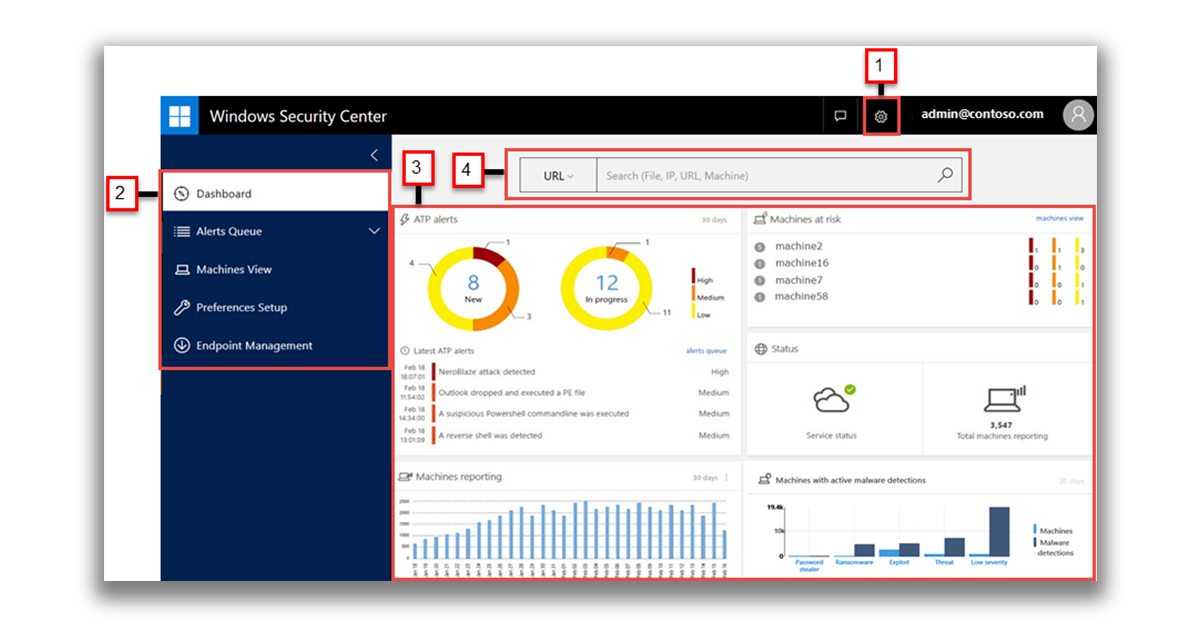
The portal interface includes four main workspaces:
- (1) Settings Area
- (2) Navigation area
- (3) Main portal
- (4) Search
With the settings, everything is quite obvious.
In the Navigation Panel, views such as:
- Information panel (the dashboard itself, which displays basic information);
- Alert queue (New, In progress, Allowed, and so on).
The computers section displays a list of computers that the ATP service protects and some information about them.
Priority setting allows you to configure email notifications or data storage policies (in other words, how much data will be stored in tenant).
In the host management section , you can download the package for preparing machines for working with ATP.
ATP service and uses the following conventions:
Alert is an activity message that correlates with advanced attacks.
Detection - A sign of a detected malware threat.
Active threat - threats that were actively executed at the time of detection.
Resolved - The threat has been removed from the computer.
Not resolved - the threat has not been removed from the computer.
In general, the approach to investigating security holes using ATP can be divided into the following stages:
- View alerts in the dashboard or in the alert queue.
- Analysis of indicators of compromise (IOC) or attack (IOA).
- Analysis of the timeline of alerts, behavior and computer events.
- Managing alerts, understanding the threat or potential hack, gathering information to determine what’s needed and handling the alert.
View Windows Defender Advanced Threat Protection dashboard
Since we start working with ATP by analyzing the data in the information panel, we will consider it in more detail. Data on alerts and computers allows you to quickly establish the fact, place and time of suspicious activity on the network - this provides the necessary context for understanding the situation. An event summary is also displayed here to help identify significant events or behavior on the computer. You can also open detailed information about events and indicators at a lower level. Active tiles provide visual clues to assess the overall state of security systems. Clicking on such a tile opens a detailed view of the corresponding component.
ATP Service Alerts
When you click on the ATP Alerts tile , the total number of active ATP service alerts on the network for the last 30 days is displayed. Alerts are divided into two groups: New and Running.
Each group has subcategories by severity level. By clicking on the number inside each, you can display the queue view of the corresponding category.
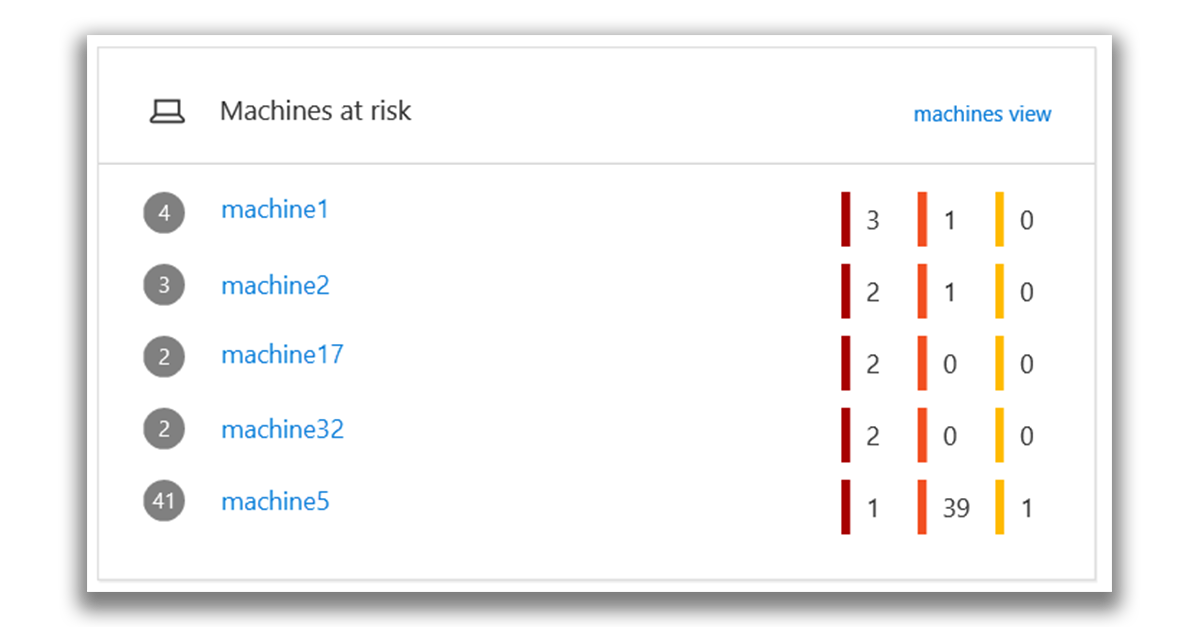
Computers at Risk
This tile shows the list of computers with the most active alerts. The total number of alerts for each computer is shown in a circle next to the computer name. On the opposite side of the tile is the number of alerts grouped by severity level. It is not difficult to guess that a dark color is more dangerous, and a lighter color is less.
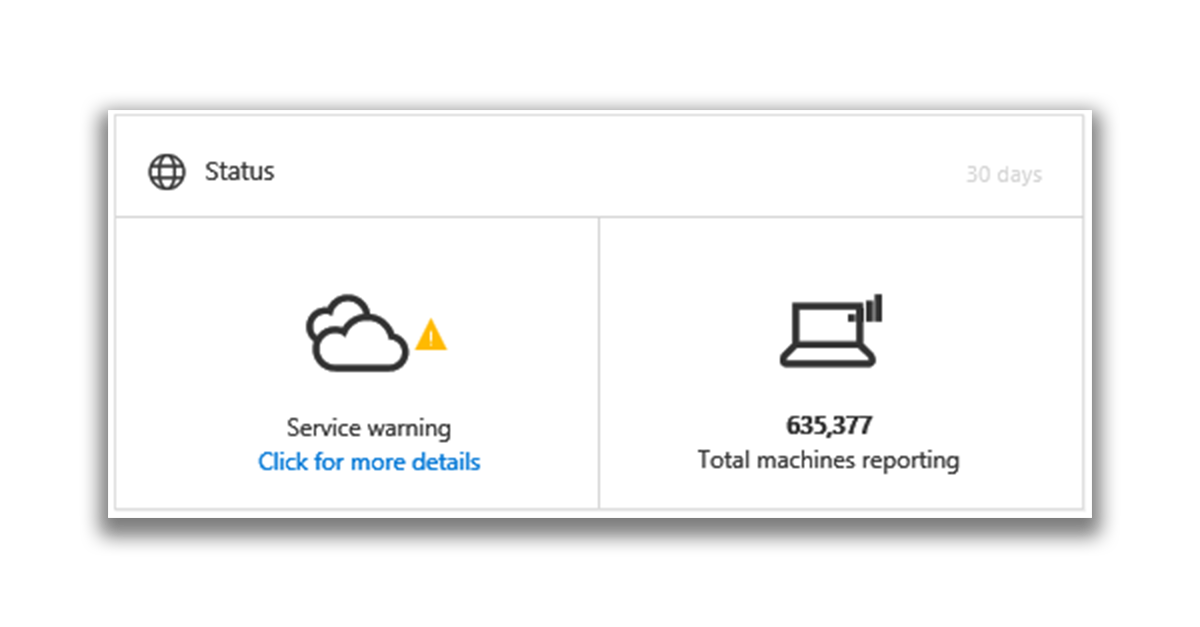
The Status tile contains information about whether the service is active and whether there are problems, as well as the number of computers that sent reports to the service over the past 30 days.
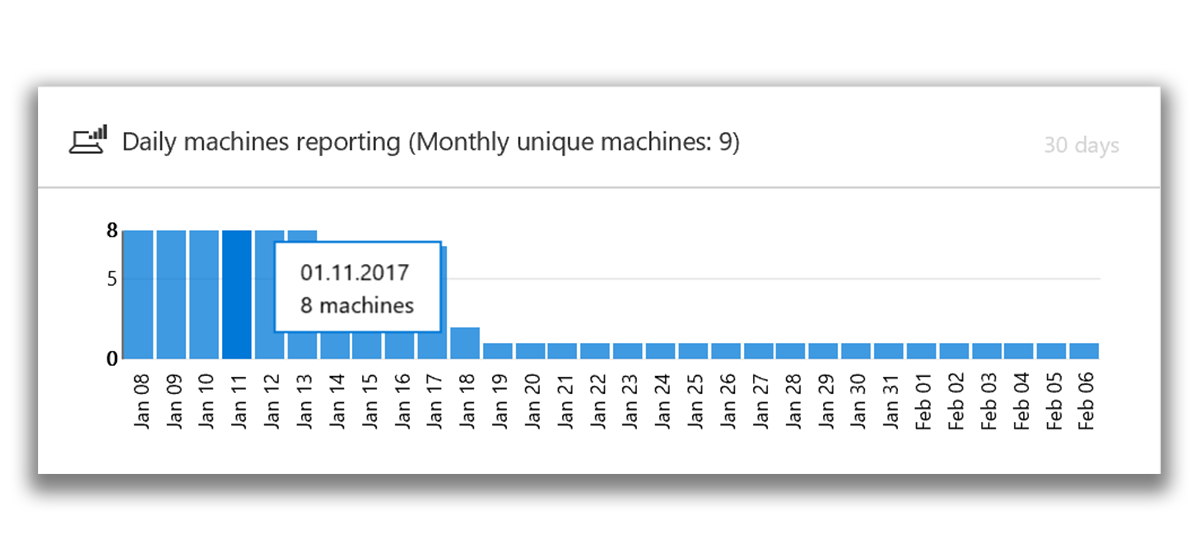
Tile Computer Reportscontains a histogram that shows the number of computers that sent alerts by day. You can see the exact number of computers that sent alerts on a specific day by hovering over individual columns of the histogram.
Computers with Active Malware Detected
The Computers tile with active malware detected is displayed only if Windows Defender is used at your endpoints. Active malware refers to threats that were actively executing at the time of detection. By moving the mouse cursor over each of the columns, you can see the number of active malware detected and the number of hosts on which at least one active malware has been detected in the last 30 days.
The scheme contains five categories of malware:
- Password theft program - threats aimed at stealing credentials.
- Blackmailer - threats aimed at blocking a user's access to a computer or files and extorting money to restore access.
- Exploit - threats that exploit software vulnerabilities to infect computers.
- Threat - all other threats that do not belong to the categories of programs for stealing passwords, blackmail programs and exploits. This category includes trojans, worms, backdoors (backdoors) and viruses.
- Low severity - low severity threats, including adware and potentially unwanted programs, such as browser modifiers.
Threats are considered active if there is a very high probability that the malware was running on your network and not just locally stored on disk.
By clicking on any of these categories, you can go to the Computers view , where the data will be filtered for the corresponding category. This way you can get detailed information about which computers detected active malware and how many threats are registered on each of them.
View and organize Advanced Threat Protection alert queues
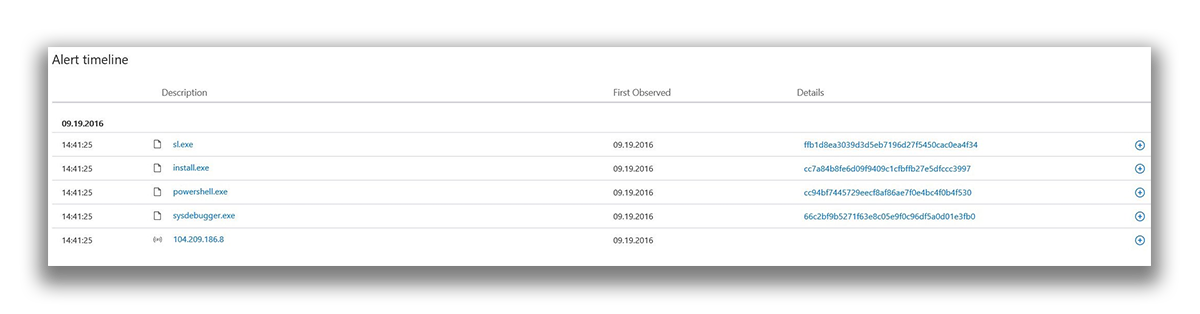
Windows Defender ATP service alerts can be managed as part of regular daily tasks. Alerts are queued according to their current status. By default, alerts in the queue are sorted from last to oldest. The following table and screenshot show the main areas of the Alert Queues .
Selected Area | Area Name | Description |
|---|---|---|
| (1) | Alert Queue | Select to display New , Running, or Allowed alerts |
| (2) | Alerts | Each alert contains the following data:
When you click on an alert, additional information about the threat is revealed, and the timeline moves to the date the alert was created. |
| (3) | Sort and alert filters | Alerts can be sorted by the following parameters:
In addition, the displayed alerts can be filtered by the parameters:
|
You can filter and sort the alert queue (make a summary) to identify the necessary alerts based on certain criteria. Three mechanisms are available for this:
- Sort the queue using the drop-down menu in the Sort by field with a choice of one of the following parameters:
- Newest - Sort alerts by the date they last appeared at the endpoints.
- Queue time - sort alerts by the length of time in the queue.
- Severity - sort by severity level.
- To filter alerts by severity level, you can set one or more flags in the drop-down menu in the Filter by field :
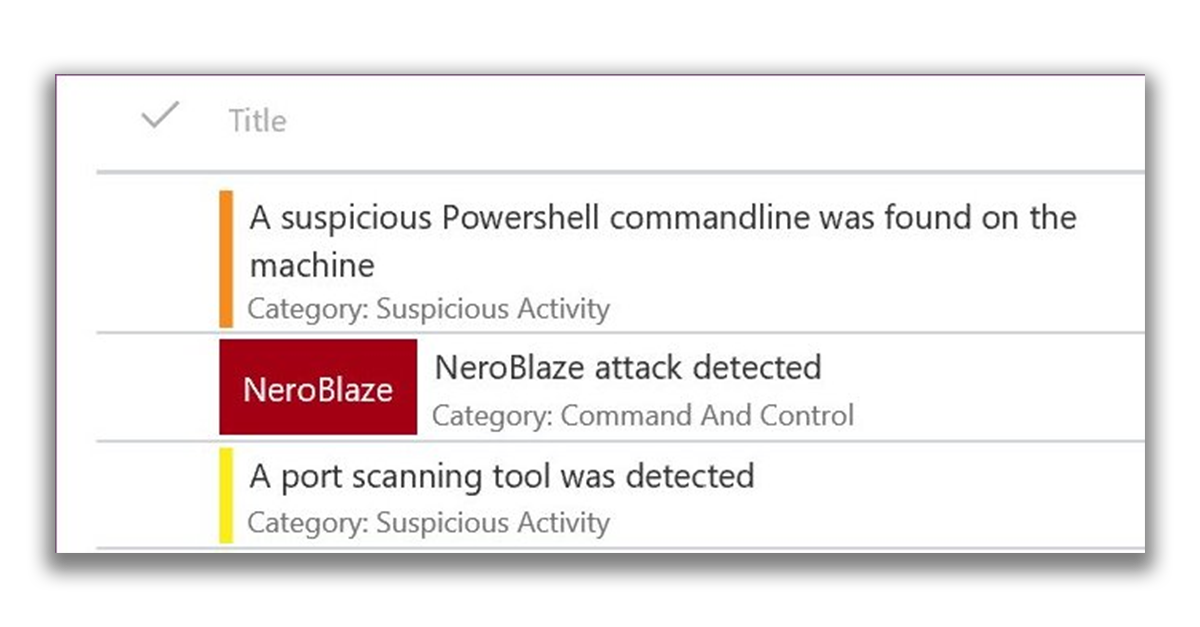
- High (red): Threats typically associated with persistent advanced threats (APT). Such alerts indicate a high risk due to the seriousness of the damage that may be caused to the hosts.
- Medium (orange): Rarely occurring threats, such as abnormal registry changes, execution of suspicious files, and behavior typical of different stages of an attack.
- Low (yellow): threats associated with common malware and hacking tools that do not indicate a threat of increased complexity.
- The displayed part of the queue can be limited by various specified periods using the drop-down menu in the date range field (the default value is 6 months ).
To change the sort order (for example, displaying the oldest alerts first instead of the newest ones), you can click the sort order icon.
Windows Defender Advanced Threat Protection Alert Analysis
To start the analysis, and get detailed information you need to click on the notification in any queue.
Alert details include the following:
- The date and time the alert was last created.
- Description of the alert.
- Recommended Actions.
- Count incident.
- The indicators that led to the creation of the alert.
For alerts that have been correlated with the actions of the attacker or subject, a colored tile with the subject’s name is displayed.
By clicking on the name of the subject, you can view the profile of the threat analytics for him, including a brief overview of the subject, information about his interests or goals, tactics, methods and procedures, as well as information about his activity around the world. A set of recommended response actions will also be displayed.
The incident graph includes a visual representation of the location of the alert, the events that led to its creation, and other computers affected by the event. The graph shows the effect of alerts on the source computer, as well as how this event affected the alerts on other computers.
You can click the circle on the incident graph to expand the nodes and view the events or files that are associated with the alert.
We remind you that the ATP service in Windows Defender is built into the core of Windows 10 Enterprise, its work can be evaluated for free.