Fighting stress in the HPE Vertica
- Tutorial
A typical “just in time” scenario for a data warehouse looks like this: dozens (ETL) of sessions almost continuously capture data from sources and insert them into the storage. In parallel, many other (ELT) sessions track the flow of data, fill out the consolidated layer and calculate aggregates and storefronts. At the same time, users, BI and other systems fulfill requests on incoming primary and calculated data. All this porridge should be cooked well within the data warehouse server, without brakes and plugs, no matter what the peak loads are.
In HPE Vertica, a special mechanism called resource pools has been developed for scheduling a server under load. Its idea is that each server user operates within a dedicated resource pool, which regulates the priority of access to cluster resources, limits the competitiveness of query execution and describes the rules of reservation and working with server memory.
By default, after installing the Vertica server on the created database, it looks something like this:

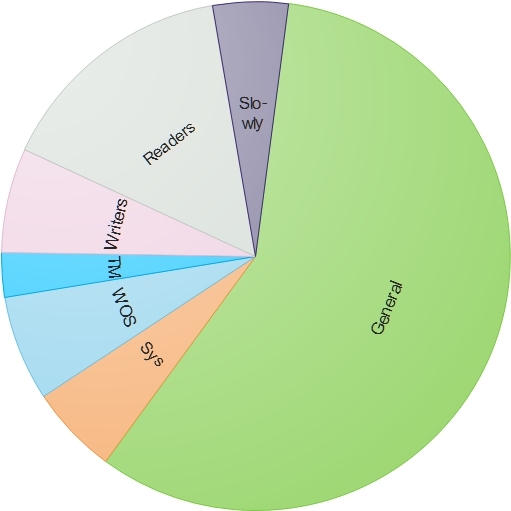
On each server (node) of the cluster, the memory available to Vertica is designated as the General resource pool. For various server needs, service pools are automatically created that cut off pieces of memory from General for themselves:
By default, server users spin under the control of the General pool itself. You can see its current settings:
I will decrypt some parameters:
Such "default" settings give virtually a 100% guarantee for Vertica operation brakes:
Let's help the grief:
Now, each session, at the start of the request, 0.5 GB is allocated in the pool, and in total no more than 10 sessions can be performed simultaneously. At the start of 10 sessions, 5 GB of pool memory will be used up, another 25 GB will remain as a reserve for memory allocation to heavy requests and other resource pools.
I want to pay attention to the MAXCONCURRENCY parameter - the lower it is, the faster your queries will work. Each hardware has a load limit, when it is exceeded, everything “rises with a stake”. The higher the competitiveness, the greater the load on processors and disk arrays, the lower their speed. It is more efficient to complete 10 requests and then to execute the next 10 requests from the queue than to try to execute 20 requests simultaneously. Naturally, MAXCONCURRENCY will primarily depend on the tasks set for solving the pool problems and on the characteristics of the iron of the cluster, your task is to identify the limits and set it just below the limits, so that in the case of peak loads of simultaneous execution of many heavy requests, the cluster does not suddenly slow down for all its users .
So what about pools? So far we have only set up General, however, keeping users in it is actually a bad practice. Let's make sample pools for user task groups:
General now has "lost weight":
What have we done:
Now we assign the necessary pools to users and the job is done:
Here, in addition to the pool, the user_analytical user was limited to one hour for queries and allowed to use no more than 10 GB of space in TEMP.
I want to note that all of the above in the article is a "where to dig" action, and not an example of "what to configure." How many and what resource pools will be, with what characteristics - all this must be decided by you. You can start small - by example, create similar 3 pools and then look at the cluster loads, gradually balancing the parameters of the pools and highlighting user groups for different pools. The main thing to remember is that:
In HPE Vertica, a special mechanism called resource pools has been developed for scheduling a server under load. Its idea is that each server user operates within a dedicated resource pool, which regulates the priority of access to cluster resources, limits the competitiveness of query execution and describes the rules of reservation and working with server memory.
By default, after installing the Vertica server on the created database, it looks something like this:
On each server (node) of the cluster, the memory available to Vertica is designated as the General resource pool. For various server needs, service pools are automatically created that cut off pieces of memory from General for themselves:
- WOS - for storing portion-inserted data in the memory area
- TM - for the Tuple Mover background service process that performs moveoute and mergeout operations
- Other service - Vertica has additional resource pools for performing cluster node recovery operations, projecting, performing service requests, etc.
By default, server users spin under the control of the General pool itself. You can see its current settings:
dbadmin=> SELECT * FROM resource_pools WHERE name = 'general';
-[ RECORD 1 ]------------+------------------
pool_id                  | 45035996273721212
name                     | general
is_internal              | t
memorysize               |
maxmemorysize            | 30G
executionparallelism     | AUTO
priority                 | 0
runtimepriority          | MEDIUM
runtimeprioritythreshold | 2
queuetimeout             | 00:05
plannedconcurrency       | 10
maxconcurrency           | 20
runtimecap               |
singleinitiator          | f
cpuaffinityset           |
cpuaffinitymode          | ANY
cascadeto                |
I will decrypt some parameters:
- memorysize - the size of the reserved memory of the pool, this size is cut off from the General pool, reducing its size of available memory, for General it is not specified accordingly.
- maxmemorysize - the maximum allowed size of memory usage by the pool. If the memory pool uses more than the specified memorysize, the missing memory is temporarily taken from the General pool, if there is of course something to pick up.
- plannedconcurrency - a divisor for setting the size of the memory allocated to the session when starting a request in the pool, in this case for the General maxmemorysize pool: 30 GB divide 10 plannedconcurrency = 3 GB of the pool memory is allocated for each session at startup, which is to say the least bold.
- maxconcurrency - the maximum number of concurrent sessions running on the pool.
Such "default" settings give virtually a 100% guarantee for Vertica operation brakes:
- 10 sessions starts query execution
- 3 GB of pool memory is allocated for each session, even if so much is not needed
- If the sessions have not had time to work out yet and new sessions have launched more requests, then instead of 30 GB memory they get work in swap
- If some session in the course of work ate the entire memory of the pool, then other sessions also end up in swap
Let's help the grief:
ALTER RESOURCE POOL general PLANNEDCONCURRENCY 60 MAXCONCURRENCY 10;Now, each session, at the start of the request, 0.5 GB is allocated in the pool, and in total no more than 10 sessions can be performed simultaneously. At the start of 10 sessions, 5 GB of pool memory will be used up, another 25 GB will remain as a reserve for memory allocation to heavy requests and other resource pools.
I want to pay attention to the MAXCONCURRENCY parameter - the lower it is, the faster your queries will work. Each hardware has a load limit, when it is exceeded, everything “rises with a stake”. The higher the competitiveness, the greater the load on processors and disk arrays, the lower their speed. It is more efficient to complete 10 requests and then to execute the next 10 requests from the queue than to try to execute 20 requests simultaneously. Naturally, MAXCONCURRENCY will primarily depend on the tasks set for solving the pool problems and on the characteristics of the iron of the cluster, your task is to identify the limits and set it just below the limits, so that in the case of peak loads of simultaneous execution of many heavy requests, the cluster does not suddenly slow down for all its users .
So what about pools? So far we have only set up General, however, keeping users in it is actually a bad practice. Let's make sample pools for user task groups:
-- Пул для писателей
CREATE RESOURCE POOL writers
MEMORYSIZE '2G'
MAXMEMORYSIZE '10G'
PLANNEDCONCURRENCY 10
MAXCONCURRENCY 10
PRIORITY -50
RUNTIMECAP '3 MINUTE'
RUNTIMEPRIORITYTHRESHOLD 0;
-- Пул для тяжелых длинных запросов
CREATE RESOURCE POOL slowly
MEMORYSIZE '0%'
MAXMEMORYSIZE '20G'
MAXCONCURRENCY 7
RUNTIMEPRIORITY LOW
QUEUETIMEOUT '15 MINUTE'
RUNTIMEPRIORITYTHRESHOLD 0;
--  Пул для читателей
CREATE RESOURCE POOL readers
MEMORYSIZE '4G'
MAXMEMORYSIZE '10G'
PLANNEDCONCURRENCY 20
MAXCONCURRENCY 10
RUNTIMECAP '5 MINUTE'
PRIORITY 50
RUNTIMEPRIORITYTHRESHOLD 3
CASCADE TO slowly;
General now has "lost weight":
What have we done:
- Scattered among the groups of the session squealers reading and fulfilling long heavy requests.
- We allocated the initial memory to the pools of readers and writers, so that for most short queries, the memory was taken immediately from the reserved pool for the pool without swapping with General.
- They did not begin to allocate memory to the pool of heavy requests, all the same, his sessions would want a lot of memory and reserve for them, cutting off precious memory from General, it makes no sense, but this pool was allowed to take up to 20 GB of memory from General if necessary.
- Set the heavy request pool to a lower priority for LOW execution.
- For the pool of writers and readers, access to resources was prioritized so that, according to MEDIUM execution priority, the writers pool was an outsider (-50 priority), the General pool was in the middle (zero priority) and the pool for readers was higher than these pools (50 priority).
- Rationally set the competitiveness values for pools, where at the same time 10 requests from writers, 10 requests from readers and 7 heavy requests can be executed.
- For situations when the user launched a heavy request in the readers pool, which lasts more than 5 minutes, they indicated a cascade of such requests to the heavy request pool. This ensures that the reader pool will not creep when executing long requests on it, which will clog competitor execution slots and slow down the execution pipeline from the quick request queue. For the pool of writers, the query execution limits were set to no more than 3 minutes, so that unoptimized insert or update data requests could fail.
- For the heavy request pool, the queue timeout was 15 minutes. If all competing slots in the pool are busy, then after 15 minutes of waiting, queued requests will be terminated with an error. This will make it clear to users that the server is not hanging, but simply that everything is busy within their pool.
- For the readers pool, they set a time of 3 seconds, during which the request after launch has the highest priority for resources. This will allow you to quickly execute short requests, freeing up space in the pool for other requests.
Now we assign the necessary pools to users and the job is done:
ALTER USER user_writer RESOURCE POOL writers;
ALTER USER user_reader RESOURCE POOL readers;
ALTER USER user_analytical RESOURCE POOL slowly RUNTIMECAP '1 HOUR' TEMPSPACECAP '10G';
Here, in addition to the pool, the user_analytical user was limited to one hour for queries and allowed to use no more than 10 GB of space in TEMP.
I want to note that all of the above in the article is a "where to dig" action, and not an example of "what to configure." How many and what resource pools will be, with what characteristics - all this must be decided by you. You can start small - by example, create similar 3 pools and then look at the cluster loads, gradually balancing the parameters of the pools and highlighting user groups for different pools. The main thing to remember is that:
- The General pool is a common storehouse of memory for all pools and it is better not to use it directly for user sessions
- The fewer competitors, the lower the rate of subsidence of iron in peak loads
- The sum of the maximum allowed memory of all pools should not overlap the memory of General