What happened when we got tired of looking at the graphs of 5,000 servers under monitoring (and when there were more than 10,000 servers)

We at Odnoklassniki are looking for bottlenecks in the infrastructure, which consists of more than 10 thousand servers. When we were a bit sick of monitoring 5000 servers manually, we needed an automated solution.
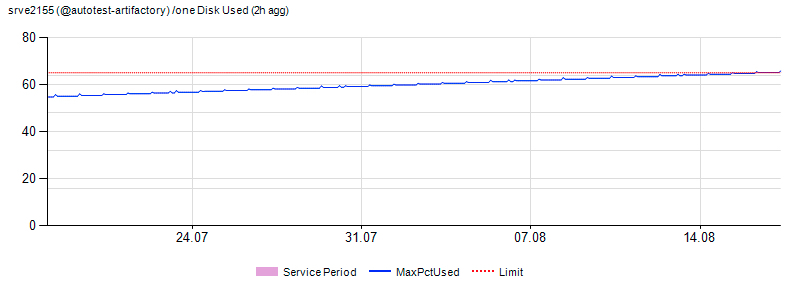
More precisely, not so. When about the 20th server appeared in hoary antiquity, they started using Big Brother - the simplest monitoring, which simply collects statistics and shows it in the form of small pictures. Everything is very, very simple. Neither approximate nor somehow enter the range of permissible changes is impossible. Just watch the pictures. Like these ones:
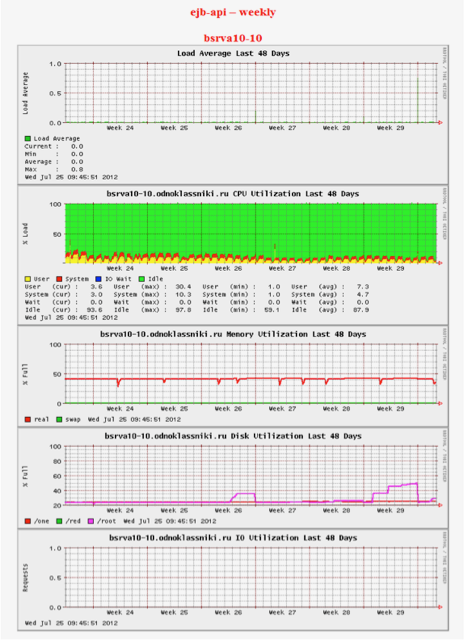
Two engineers spent one working day a week, just looking at them and putting tickets where the schedule seemed “wrong”. I understand that it sounds really strange, but it started with a few cars, and then somehow suddenly grew up to 5000 instances.
Therefore, we made a new monitoring system - and now we spend 1-2 hours a week working with 10 thousand servers to process alerts. I’ll tell you how it works.
Why is it necessary
Incident management was set for us long before the start of work. In the "iron" part, the servers worked normally and were well maintained. Difficulties were with predicting bottlenecks and identifying atypical errors. In 2013, a failure in Odnoklassniki led to the fact that the site was unavailable for several days, which we already wrote about . We learned from this, and paid a lot of attention to the prevention of incidents.
With the growing number of servers, it became important not only to effectively manage all resources, monitor and take them into account, but also to quickly record dangerous trends that could lead to bottlenecks in the site’s infrastructure. And also to prevent the escalation of detected problems. It is about how we analyze and predict the state of our IT resources that will be discussed.
Some statistics
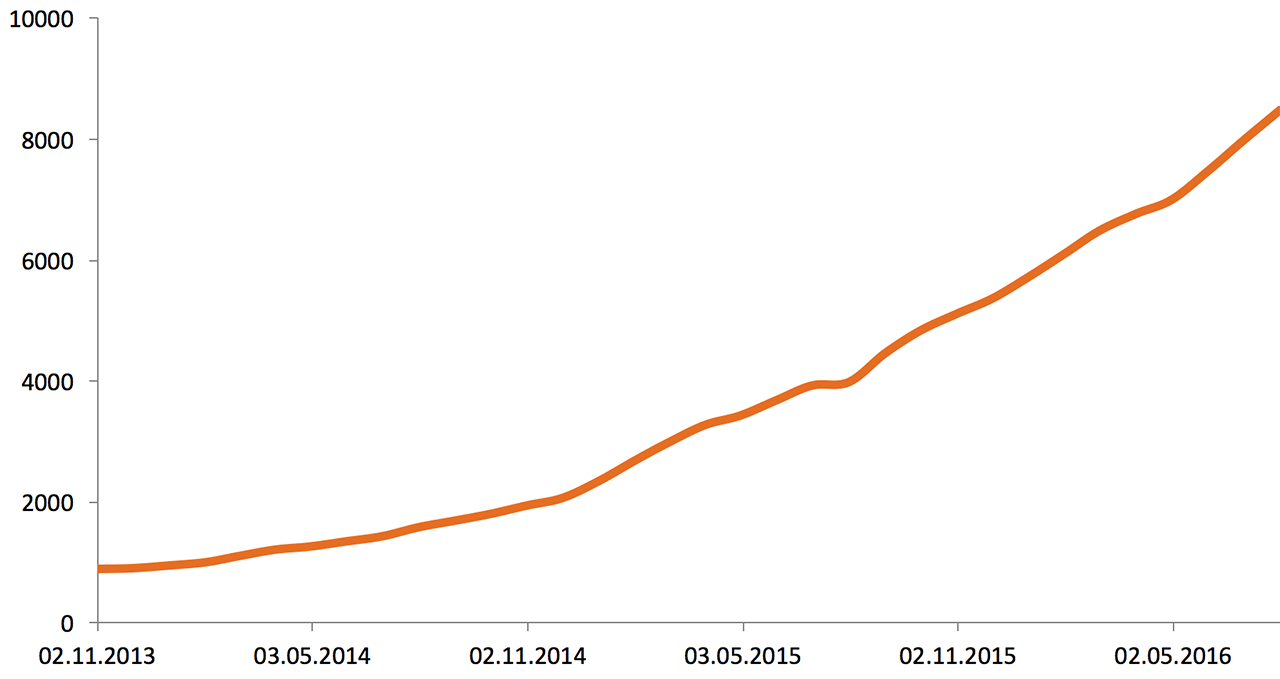
At the beginning of 2013, Odnoklassniki infrastructure consisted of 5,000 servers and storage systems. Here is the growth over two and a half years:
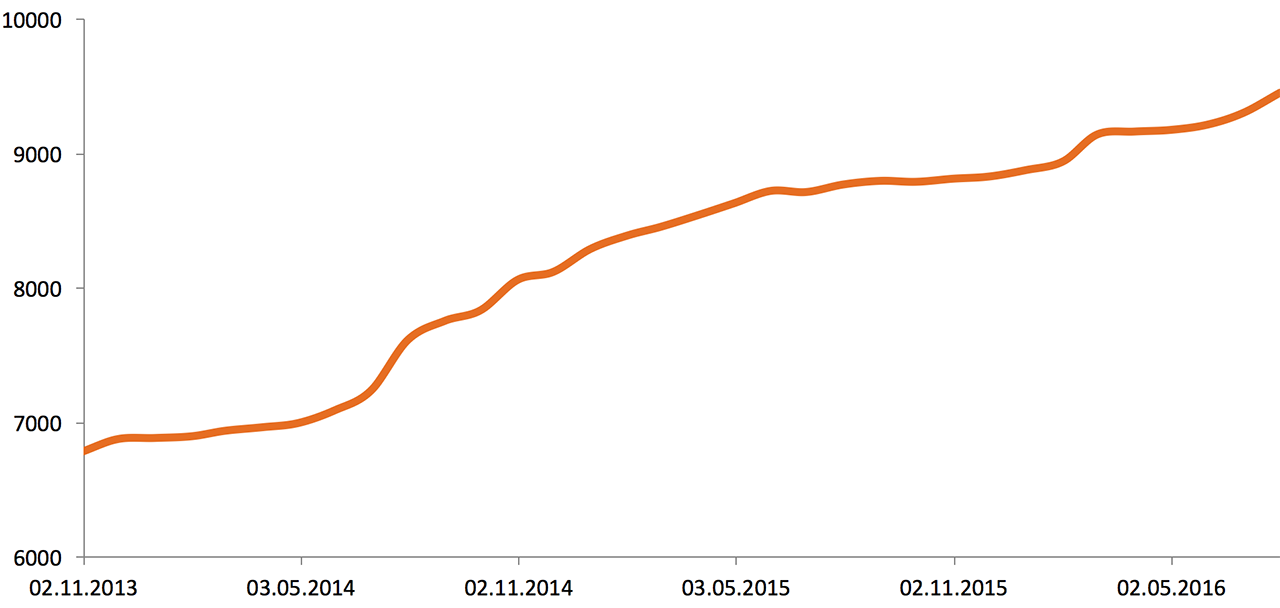
The volume of external network traffic (2013—2016), Gbit / s:
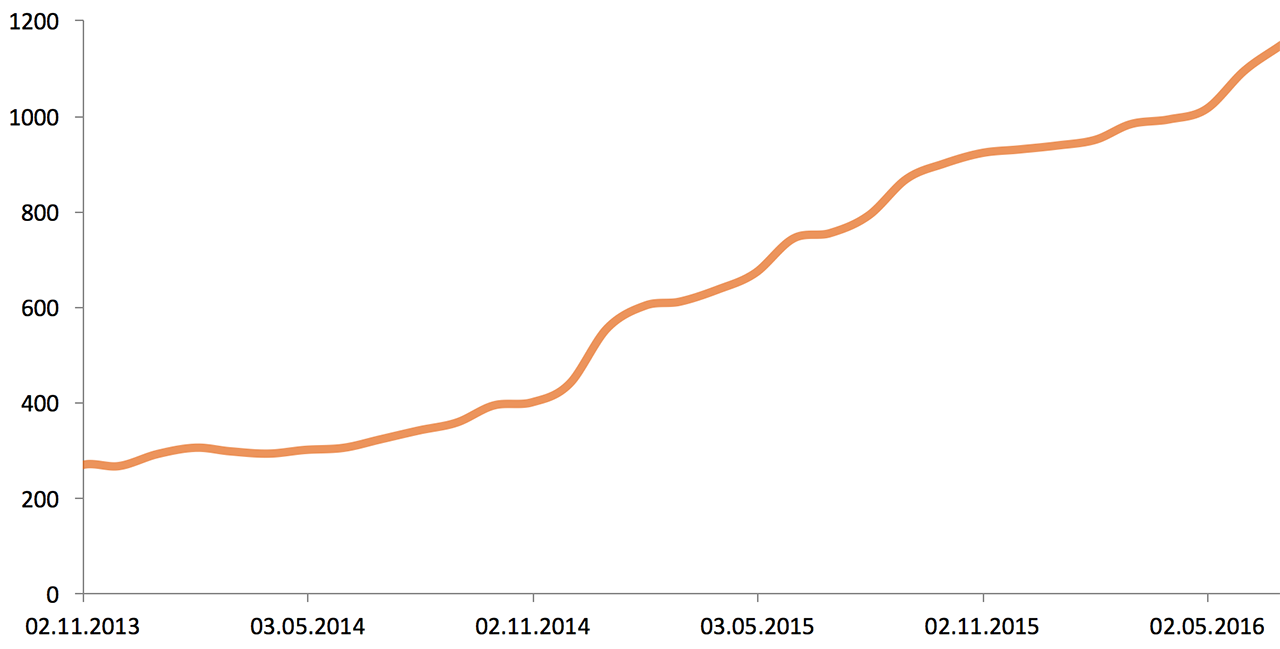
The volume of stored data (2013—2016), Tb:
The performance of applications, equipment, and business metrics is monitored by the monitoring team 24/7. Due to the fact that the already large infrastructure continues to grow rapidly, solving problems with bottlenecks in it can take a considerable time. That is why operational monitoring alone is not enough. To deal with troubles as quickly as possible, you need to predict the growth of the load. This is done as follows: the monitoring team once a week starts an automatic check of the operational indicators of all servers, arrays and network devices, following which it receives a list of all possible problems with the equipment. The list is passed to system administrators and network specialists.
What is monitored
On all servers and their arrays, we check the following parameters:
- the total load on the processor, as well as the load on a single core;
- disk utilization (I / O Utilization) and disk queue (I / O Queue). The system automatically determines the SSD / HDD, since the limits on them are different;
- free space on each disk partition;
- memory utilization, as different services use memory in different ways. There are several formulas that calculate the used / free memory for each server group, taking into account the specifics of the tasks that need to be solved on a particular group (default formula: Free + Buffers + Cached + SReclaimable - Shmem);
- using swap and tmpfs;
- Load average;
- traffic on server network interfaces;
- GC Count, Full GC Count and GC Time (talk about Java Garbage Collection).
On central switches (core) and routers, memory usage, CPU load and, of course, traffic are checked. We do not monitor access-port traffic on the access level switches, since we test it directly at the server network interface level.
Analytics
Data is collected from all hosts using SNMP and then accumulated in a DWH (Data Warehouse) system. We talked about DWH on Habr earlier - in the BI article in Odnoklassniki: data collection and its delivery to DWH . Each data center has its own servers to collect these statistics. Statistics from devices are collected every minute. Data is uploaded to DWH every 90 minutes. Each data center generates its own set of data, their volume is 300-800 Mb per upload, and this is 300 GB per week. The data are not approximated, so it is possible to find out the exact time the problem started, which helps to find its cause.
All servers, depending on their role in the infrastructure, are divided into groups on which thresholds (limits) are hung. After exceeding the limit, the device will be reported. All hosts are grouped in a specially developed Service Catalog system. Since the limits are hung on a group of servers, new servers in the group automatically begin to be monitored at the same limits. If the administrator created a new group, then hard limits are automatically hung on it, and if the servers of the new group get checked, then a decision is made whether this is normal or not. If programmers think this is normal behavior for a group of servers, the limit goes up. For convenient limit management, a control panel has been created that looks like this:
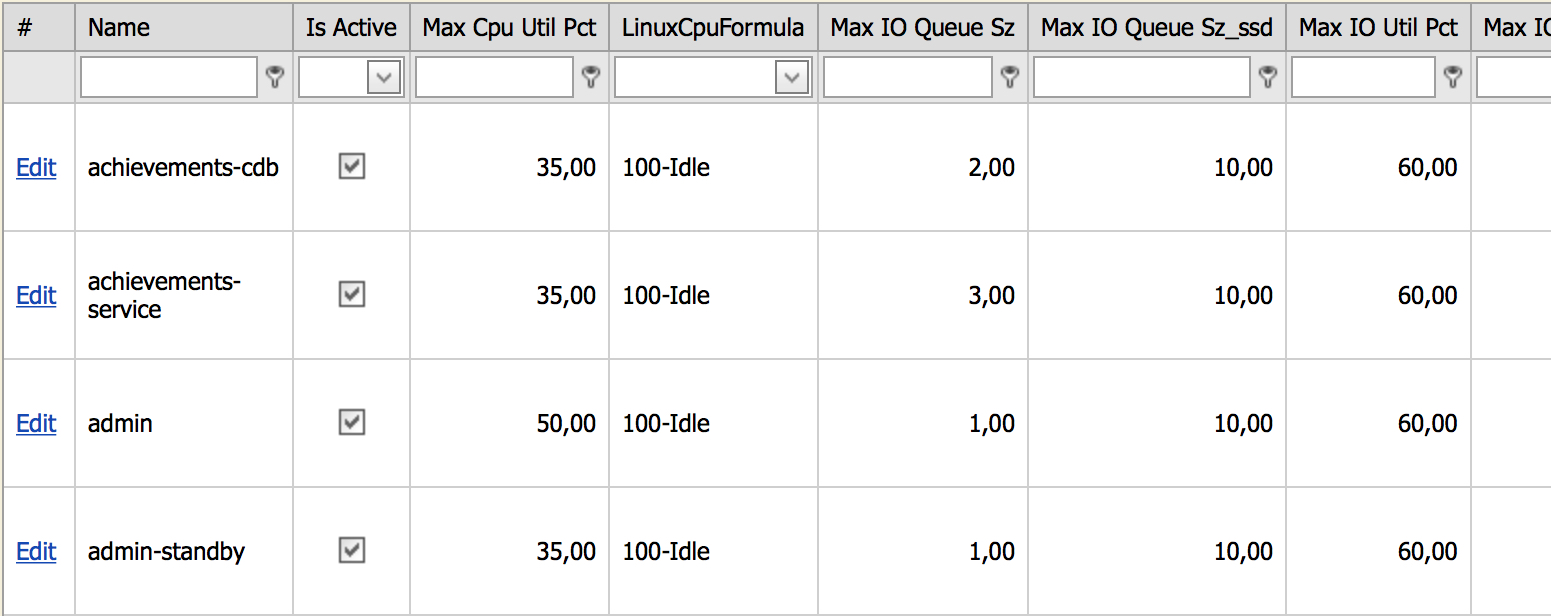
In this admin panel you can see all the unique server groups and their limits. For example, the screenshot shows the limits for the achievements-cdb group:
- maximum processor load should not exceed 35%;
- formula for calculating the load on the processor 100% - idle;
- the limit on the disk queue for HDDs is 2, for SSDs - 10.
Etc. You can fix any limit only by referring to a task that describes the reasons for the change. Limit change window:
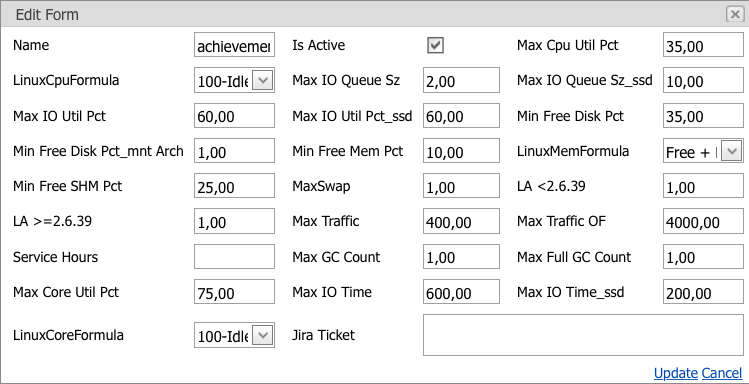
The screenshot shows all current limits for a group of servers with the possibility of changing them. Changes can only be applied if the Jira Ticket field is filled in; the task is written in it, within the framework of which the problem was solved.
At night, when the load on the servers is much lower, various service and calculation tasks are performed that create additional load, but they do not affect the users or the portal’s functionality in any way, therefore we consider such responses to be false, and an additional parameter was introduced to combat them - the service window . The service window is a time interval in which a limit is exceeded, which is not considered a problem and does not appear in the report. False positives also include short-term jumps. Network and server checks are separated, as server and network problems are solved by different departments.
What happens to the report
The report is collected on Wednesdays in one click. Then one of the five “daytime” engineers withdraws from the usual “patrol” of the resource and work on ticket management, and begins to read the report. Checking takes no more than one and a half hours. The report contains a list of all possible problems in the infrastructure, both new and old, which have not yet been resolved. Each problem can become an alert to the administrator, and the system administrator already solves - immediately correct or start a ticket.
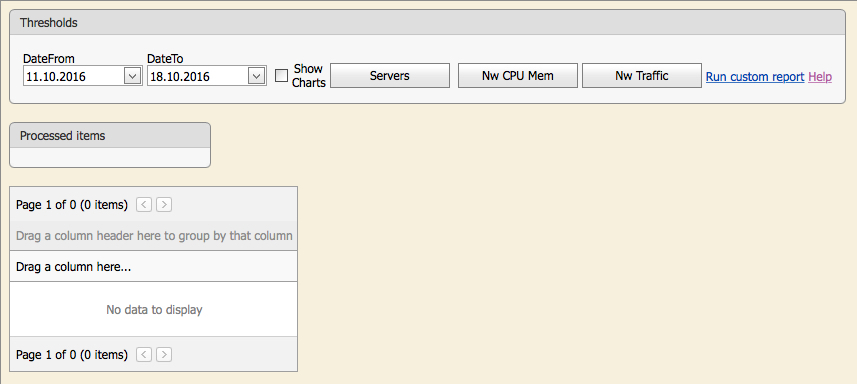
The picture shows the initial verification window. The user can click on the corresponding button and run an automatic check: “Servers” - all servers, “Nw CPU Mem” - memory and processor usage on network devices, “Nw Traffic” - traffic on central switches and routers.
The system is integrated with JIRA (task management system). If the problem (the limit is exceeded) is already being resolved, in front of it there is a link to the ticket, within which work is carried out on the problem or by which it is called with the ticket status. So we see, within the framework of what problem the problem was solved earlier - i.e. there will be a ticket with the status of Resolve.
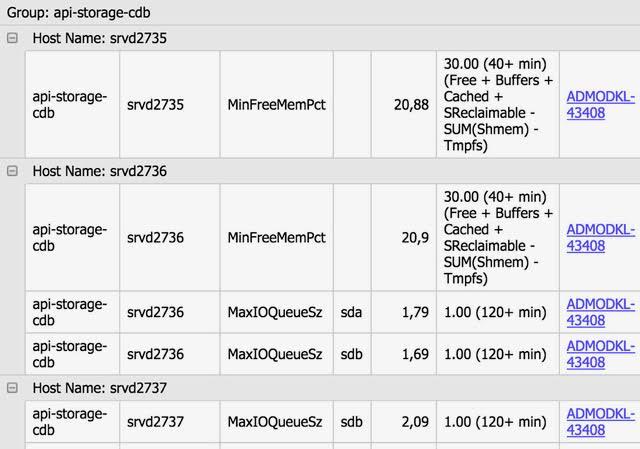
All new problems are transferred to senior system administrators and senior network specialists who create tickets in JIRA to solve each problem individually, then these tickets are linked to the corresponding problems. The system administrator has the ability to run a special check on any parameter, it is enough to specify the group (s) of servers, parameter and limit, and the system itself will display all servers that have exceeded the limit. You can also see the graph for any parameter of any server with a limit line.
An example of a server getting on radars:
For the largest server groups (web - front end, business logic level and user data cache), in addition to the usual verification, a long-term forecast is made, as significant resources (equipment, time) are required to solve problems with these groups.
The monitoring team also makes a long-term forecast; it takes about five minutes to do this. In the report generated by the system, the monitoring specialist sees graphs of the main indicators for subgroups and for the group as a whole with a forecast for the future, and if the established limit is exceeded within two to three months, then a ticket is also created for solving the problem. Here is an example of what the forecast looks like:
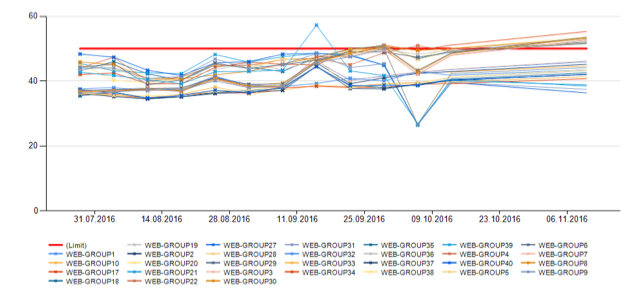
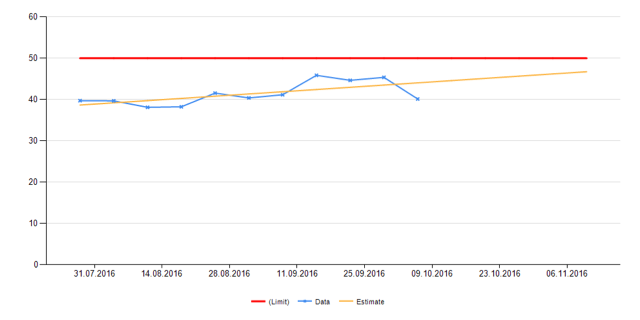
In the first picture we see the CPU usage of all groups of web-servers separately, in the second - general. The red line indicates the limit. Yellow is the forecast.
The forecast is based on fairly simple algorithms. Here is an example of a CPU load prediction algorithm.
For each server group, in seven-day increments, we build points using the following formula (example for the front end group):
∑ (n - max load - min load) / (n - 2) , where:
- n - number of servers in the group;
- max load - the maximum value of the load, which lasted more than 30 minutes on each server separately for the whole week. Add up all the load values for the server group;
- min load - the minimum value of the load, calculated similarly to the maximum.
To get a more accurate forecast, we remove one server with a maximum load and one with a minimum. This algorithm may seem simple, but it is very close to realities, and that is why it makes no sense to invent complex analysis. Thus, for each group of servers, we obtain weekly points by which the approximated linear function is constructed.
On the resulting chart, you can see the estimated date when the expansion or upgrade of the group is required. The date when the place in large clusters ends will be similarly predicted. The clusters of photos, videos and music are checked: the
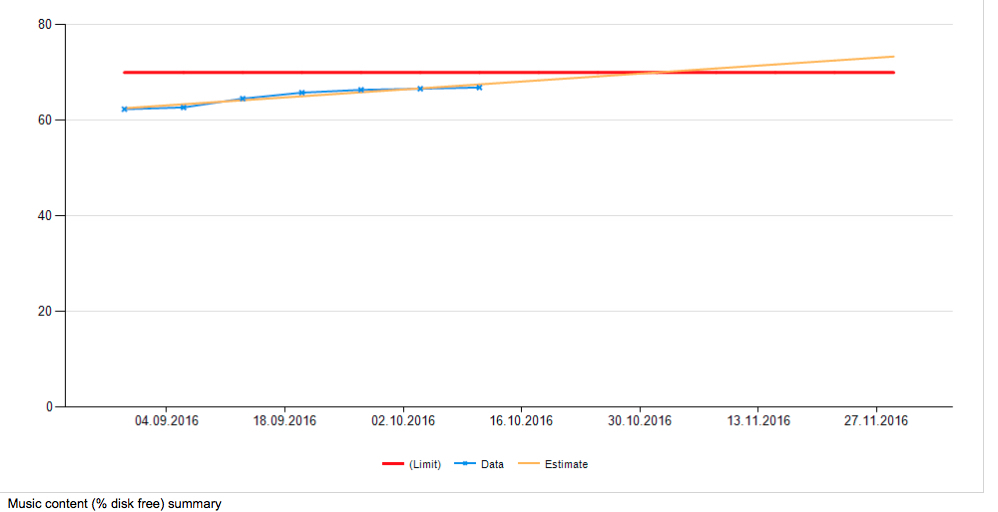
system discards spare disks (spare disks in the array), and they do not fall into these statistics.
As a result, after the engineer from the monitoring team creates a report and draws up all the problems, the managers entrust the following tasks to administrators:
- expand the cluster photo;
- increase drives in group1 and group2;
- solve the queue problem on group3;
- deal with GC on group4;
- solve the problem with traffic and load on server1 and server2;
- solve the problem with swap on group5 and group6.
All these tasks at the time of their formulation were not critical, since the system detected problems in advance, which greatly simplified the work of system administrators: they did not have to drop everything to solve problems in a short period of time.
New metrics
Sometimes we need new metrics. This is one or two new indicators per year. We start them, most often, on incidents, assuming that if something had been notified in advance by the administrator, the incident might not have happened. However, sometimes crutches of some kind are needed - for example, on a server cluster with storage for large photographs, 80% of the space was somehow utilized. With the expansion, we could not technically redistribute the photos, and we wanted to monitor at 70% coverage. Two groups formed - almost complete servers that would generate an alert constantly, and new, pristine clean ones. Instead of individual rules, a virtual “fake” group of machines had to be started, which corrected the issue. Another example is that when switching to SSD in bulk, it was necessary to properly monitor the disk queue, where typical behavior is very different from ordinary HDDs.
In general, the work is well-established, this part is beautiful, easily maintained and easily scalable. Using the forecasting system, we have several times already avoided the undesirable situation when the server had to be purchased suddenly. This is a very well felt business. And admins got another layer of protection against various minor troubles.