How to run SQL Profiler Trace at night, at a specific time?
How to start the SQL profiler trace when the problem needs to be caught from 3:00 to 3:30 in the morning? This can be done using server-side tracing, but this is extremely inconvenient. It is not difficult, but inconvenient, and always lazy. Finally, I decided to automate this once and for all. Like this:

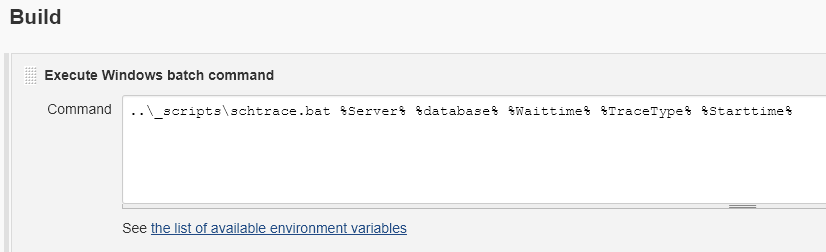
Jenkins here, by the way, is completely optional and serves only as an interface to invoke the script with the necessary parameters:
I will show the solution with large strokes, anyway there are a lot of specifics related specifically to our infrastructure. That is, I will do what is shown on the left:

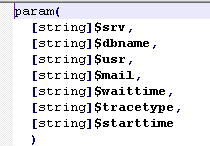
So, the bat file does something and transfers the action already to the PowerShell script, to which all parameters and two other variables,% BUILD_USER_ID%,% BUILD_USER_EMAIL%, received from Jenkins are transferred. They will be useful to us later:
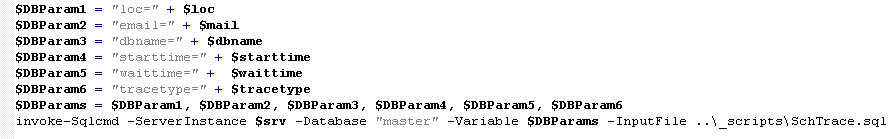
Strangely enough, in the ps1 itself, very little of what is really valuable happens: a certain procedure is called there that, by the server name, creates and returns the directory name on a special share where this file will be put. The server where this directory will be created depends on the datacenter, where the server on which the trace will be launched is located. In addition, the user is granted the right to read the trace, and there is a process that cleans these directories after a couple of days. As you can see, you may not need it and you can safely skip all this.
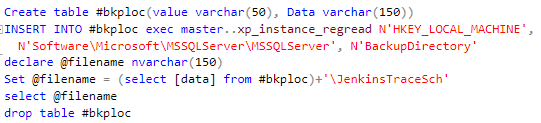
Now the action is transferred to the server where the trace will be launched, into the SQL file. loc is just a parameter containing the path to which the finished trace will be copied. You can replace it with a constant.
First we need to find a place where we will write the trace file locally. For example:
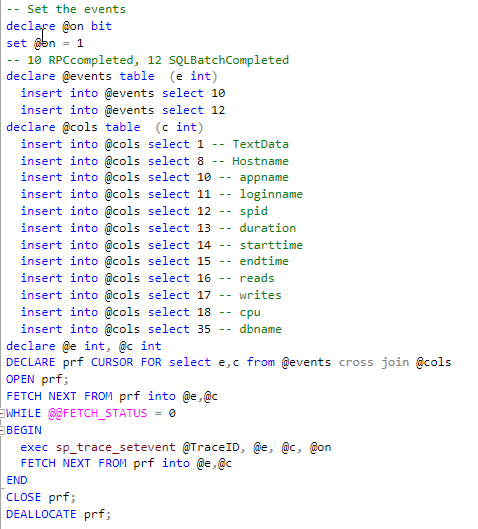
Next, a little cleaning. Suddenly, such a file already exists, or did it start earlier? You will need to check sys.traces and stop / delete the writer in% jenkinsTraceSch% if this is already present. Next we create a trace (limit its size!) And a bit of tediousness with sp_trace_setevent calls. You can make your life easier by making a CROSS JOIN between events and columns:
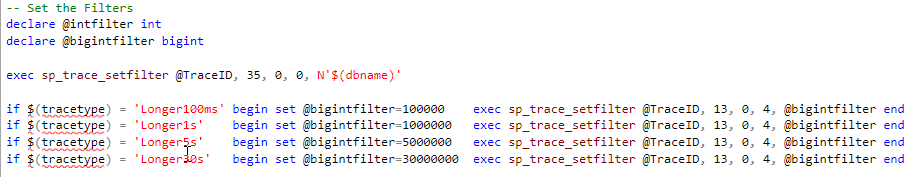
Now add filters to taste. Here you are just drawing your owl. This is the first place where we use the script parameters - the type of the filter and the name of the database:
Now
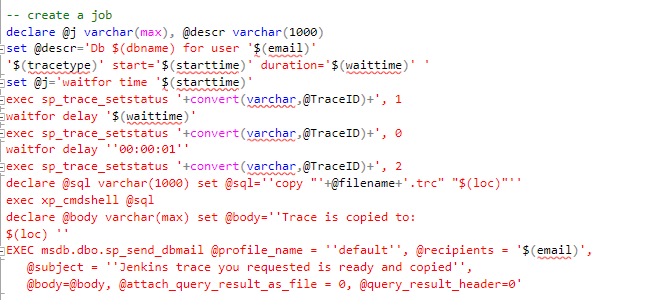
I’ve gone for thrash: In @j you form a command for Job, which will be:
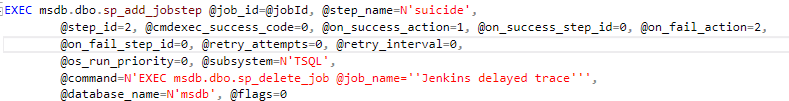
Now you need to create a Job in step 1, described in @j. However, I still add suicide to this Job, so that the job disappears without a trace upon completion of work:
I hear cries about xp_cmdshell here ... I don’t want to comment on this. In the end, no one should testify against himself in court. But you can do otherwise. It is unlikely that you will be able to send the trail by mail - it is big. Although you can pack it. Well, either leave it on the server itself and allow the user to pick it up independently or pull it out to the user-accessible place by UNC.
So, you have:
I would never have thought that such a long chain would work. But it works ...
PS: And yes, even if xp_cmdshell is prohibited and you cannot enable it, you have at least 2 ways to write my_xp_cmdshell. So this “protection” does not protect against anything.
Jenkins here, by the way, is completely optional and serves only as an interface to invoke the script with the necessary parameters:
I will show the solution with large strokes, anyway there are a lot of specifics related specifically to our infrastructure. That is, I will do what is shown on the left:
So, the bat file does something and transfers the action already to the PowerShell script, to which all parameters and two other variables,% BUILD_USER_ID%,% BUILD_USER_EMAIL%, received from Jenkins are transferred. They will be useful to us later:
Strangely enough, in the ps1 itself, very little of what is really valuable happens: a certain procedure is called there that, by the server name, creates and returns the directory name on a special share where this file will be put. The server where this directory will be created depends on the datacenter, where the server on which the trace will be launched is located. In addition, the user is granted the right to read the trace, and there is a process that cleans these directories after a couple of days. As you can see, you may not need it and you can safely skip all this.
Now the action is transferred to the server where the trace will be launched, into the SQL file. loc is just a parameter containing the path to which the finished trace will be copied. You can replace it with a constant.
First we need to find a place where we will write the trace file locally. For example:
Next, a little cleaning. Suddenly, such a file already exists, or did it start earlier? You will need to check sys.traces and stop / delete the writer in% jenkinsTraceSch% if this is already present. Next we create a trace (limit its size!) And a bit of tediousness with sp_trace_setevent calls. You can make your life easier by making a CROSS JOIN between events and columns:
Now add filters to taste. Here you are just drawing your owl. This is the first place where we use the script parameters - the type of the filter and the name of the database:
Now
I’ve gone for thrash: In @j you form a command for Job, which will be:
- Wait for the right time with WAITFOR
- Run a trace
- Wait for the time ordered
- Stop tracing
- Wait another second just in case - asynchronous operations
- To form a command to copy the trace to the right place
- Do it
- Form Subject and body letters
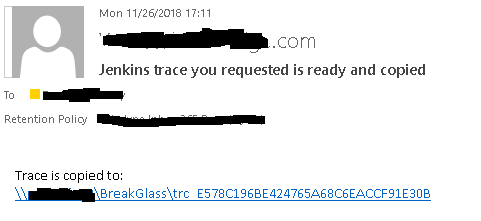
- Send a letter to the customer via sp_send_dbmail with a link to the trace
Now you need to create a Job in step 1, described in @j. However, I still add suicide to this Job, so that the job disappears without a trace upon completion of work:
I hear cries about xp_cmdshell here ... I don’t want to comment on this. In the end, no one should testify against himself in court. But you can do otherwise. It is unlikely that you will be able to send the trail by mail - it is big. Although you can pack it. Well, either leave it on the server itself and allow the user to pick it up independently or pull it out to the user-accessible place by UNC.
So, you have:
- Jenkins calls bat
- bat calls powershell
- powershell calls SQL script through sqlcmd
- The script creates a job
- Job creates a trace and, before the killing, sends mail:
I would never have thought that such a long chain would work. But it works ...
PS: And yes, even if xp_cmdshell is prohibited and you cannot enable it, you have at least 2 ways to write my_xp_cmdshell. So this “protection” does not protect against anything.