HTML5 Canvas Speedometer
The network has several similar examples of creating a speedometer, but I decided to share mine with you.

First, we need to create a canvas object in the DOM:
Writing inline styles is a sin, but if you set the width and height of the canvas with css, we will face a lot of problems, and to be more precise, it just won’t work. Now go directly to the script. First we need to get a 2d context, with which we will continue to work:
The following is a series of settings that we will need in the calculations. I calculate all dimension values relative to the width of the canvas. Thus, when changing the size of the canvas, the proportions of the speedometer will not change
I would also like to dwell on the variables startAngleIndex and endAngleIndex . To better understand where such values came from, I will show a picture taken from the site www.html5canvastutorials.com

Next, we will implement several methods that will draw speedometer elements on canvas.
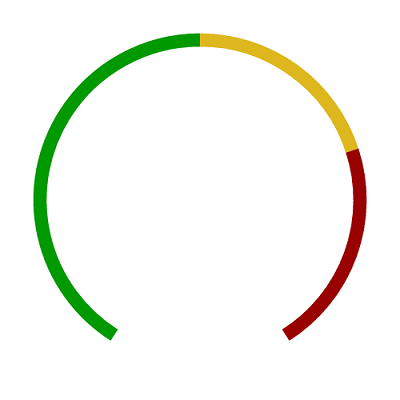
In this method, I parse the digits array and determine how many green, yellow, and red zones should be.
The DrawTicks method draws serifs on an arc with a step calculated earlier

The next method will draw the numbers on the future speedometer.

The last two methods are designed to draw the center circle and, in fact, the arrows. If desired, the DrawArrow method can be taught to accept normal values and implement logic that will determine where the arrow will show
It remains to call our methods in the correct order
Of course, the order of the call matters, just like, for example, the order of the layers in Photoshop (only in reverse order)
Result:
Sources:
First, we need to create a canvas object in the DOM:
Writing inline styles is a sin, but if you set the width and height of the canvas with css, we will face a lot of problems, and to be more precise, it just won’t work. Now go directly to the script. First we need to get a 2d context, with which we will continue to work:
var canvas = document.getElementById("canvas");
var ctx = canvas.getContext("2d");
The following is a series of settings that we will need in the calculations. I calculate all dimension values relative to the width of the canvas. Thus, when changing the size of the canvas, the proportions of the speedometer will not change
// general settings
var middleX = canvas.width / 2;
var middleY = canvas.height / 2;
var radius = canvas.width / 2 - canvas.width / 10;
// beginning and ending of our arc. Sets by rad * pi
var startAngleIndex = 0.7;
var endAngleIndex = 2.3;
// zones settings
var zoneLineWidth = canvas.width / 30;
var counterClockwise = false;
// ticks settings
var tickWidth = canvas.width / 100;
var tickColor = "#746845";
var tickOffsetFromArc = canvas.width / 40;
// Center circle settings
var centerCircleRadius = canvas.width / 20;
var centerCircleColor = "#efe5cf";
var centerCircleBorderWidth = canvas.width / 100;
// Arrow settings
var arrowValueIndex = 1.29;
var arrowColor = "#464646";
var arrowWidth = canvas.width / 50;
// Digits settings
var digits = [0, 20, 40, 60, 80, 100, 120, 140, 160, 180, 200, 220, 240];
var digitsColor = "#746845";
var digitsFont = "bold 20px Tahoma";
var digitsOffsetFromArc = canvas.width / 12;
var zonesCount = digits.length - 1;
var step = (endAngleIndex - startAngleIndex) / zonesCount;
I would also like to dwell on the variables startAngleIndex and endAngleIndex . To better understand where such values came from, I will show a picture taken from the site www.html5canvastutorials.com
Next, we will implement several methods that will draw speedometer elements on canvas.
var DrawZones = function() {
        var greenZonesCount = Math.ceil(zonesCount / 2);
        var yellowZonesCount = Math.ceil((zonesCount - greenZonesCount) / 2);
        var redZonesCount = zonesCount - greenZonesCount - yellowZonesCount;
        var startAngle = (startAngleIndex - 0.02) * Math.PI;
        var endGreenAngle = (startAngleIndex + greenZonesCount * step) * Math.PI;
        var endYellowAngle = (startAngleIndex + (greenZonesCount + yellowZonesCount) * step) * Math.PI;
        var endRedAngle = (endAngleIndex + 0.02) * Math.PI;
        var sectionOptions = [
            {
                startAngle: startAngle,
                endAngle: endGreenAngle,
                color: "#090"
            },
            {
                startAngle: endGreenAngle,
                endAngle: endYellowAngle,
                color: "#cc0"
            },
            {
                startAngle: endYellowAngle,
                endAngle: endRedAngle,
                color: "#900"
            }
        ];
        this.DrawZone = function(options) {
            ctx.beginPath();
            ctx.arc(middleX, middleY, radius, options.startAngle, options.endAngle, counterClockwise);
            ctx.lineWidth = zoneLineWidth;
            ctx.strokeStyle = options.color;
            ctx.lineCap = "butt";
            ctx.stroke();
        };
        sectionOptions.forEach(function(options) {
            DrawZone(options);
        });
    };
In this method, I parse the digits array and determine how many green, yellow, and red zones should be.
The DrawTicks method draws serifs on an arc with a step calculated earlier
var DrawTicks = function() {
        this.DrawTick = function(angle) {
            var fromX = middleX + (radius - tickOffsetFromArc) * Math.cos(angle);
            var fromY = middleY + (radius - tickOffsetFromArc) * Math.sin(angle);
            var toX = middleX + (radius + tickOffsetFromArc) * Math.cos(angle);
            var toY = middleY + (radius + tickOffsetFromArc) * Math.sin(angle);
            ctx.beginPath();
            ctx.moveTo(fromX, fromY);
            ctx.lineTo(toX, toY);
            ctx.lineWidth = tickWidth;
            ctx.lineCap = "round";
            ctx.strokeStyle = tickColor;
            ctx.stroke();
        };
        for (var i = startAngleIndex; i <= endAngleIndex; i += step) {
            var angle = i * Math.PI;
            this.DrawTick(angle);
        }
    };
The next method will draw the numbers on the future speedometer.
var DrawDigits = function() {
        var angleIndex = startAngleIndex;
        digits.forEach(function(digit) {
            var angle = angleIndex * Math.PI;
            angleIndex += step;
            var x = middleX + (radius - digitsOffsetFromArc) * Math.cos(angle);
            var y = middleY + (radius - digitsOffsetFromArc) * Math.sin(angle);
            ctx.font = digitsFont;
            ctx.fillStyle = digitsColor;
            ctx.textAlign = "center";
            ctx.textBaseline = "middle";
            ctx.fillText(digit, x, y);
        });
    };
The last two methods are designed to draw the center circle and, in fact, the arrows. If desired, the DrawArrow method can be taught to accept normal values and implement logic that will determine where the arrow will show
var DrawArrow = function() {
        var arrowAngle = arrowValueIndex * Math.PI;
        var toX = middleX + (radius) * Math.cos(arrowAngle);
        var toY = middleY + (radius) * Math.sin(arrowAngle);
        ctx.beginPath();
        ctx.moveTo(middleX, middleY);
        ctx.lineTo(toX, toY);
        ctx.strokeStyle = arrowColor;
        ctx.lineWidth = arrowWidth;
        ctx.stroke();
    };
    var DrawCenterCircle = function() {
        ctx.beginPath();
        ctx.arc(middleX, middleY, centerCircleRadius, 0, 2 * Math.PI, false);
        ctx.fillStyle = centerCircleColor;
        ctx.fill();
        ctx.lineWidth = centerCircleBorderWidth;
        ctx.strokeStyle = arrowColor;
        ctx.stroke();
    };
It remains to call our methods in the correct order
DrawTicks();
DrawZones();
DrawDigits();
DrawArrow();
DrawCenterCircle();
Of course, the order of the call matters, just like, for example, the order of the layers in Photoshop (only in reverse order)
Result:
Sources: