Desmos - Online Graphic Calculator

Have you ever had to quickly draw a graph of a function, and you don’t have a favorite desktop program on hand? I have been saved more than once by a free online graphing calculator from Desmos . Multilingual interface, incl. with the support of the Russian language.
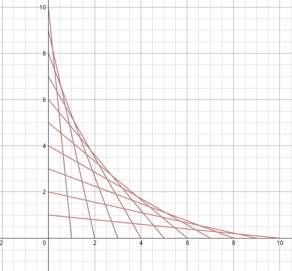
Desmos is an online service that allows you to create graphs using the function formula. The function itself fits into the left column, and the graph is automatically plotted on the right side. The service will be useful for those who need to quickly and easily build a function graph, for whom the construction of function graphs is difficult or for those who need to check the correctness of the graph construction at the lowest cost.

In addition to the fact that Desmos Calculator can perform all the functions of conventional graphing calculators, it also has several additional features that conventional graphing calculators do not have.
What can be done in DC:
- draw by functions;
- create animated pictures by binding objects to functions with parameters;
- create dynamic visibility;
- Quickly create screenshots with formulas and functions.
Desmos Calculator can build the following graphs:
- Permanent function
- X versus y
- Inequalities
- Graphs in the polar coordinate system
- Piecewise defined functions
- Point
- Point group
- Moving point
- Functions with Parameter
- Complex functions
When plotting, you can use the following functions:
- Power, exponential and logarithmic functions
- Trigonometric functions
- Inverse trigonometric functions
- Hyperbolic functions
- Statistical and Probability Functions
- Other functions
In the library of ready-made applications you can find many dynamic applets for functions of various types (from linear to trigonometric) with built-in “sliders”.
Authorization in the service allows you to save created applets and share them in the form of links, embedded code or pictures.
You will find detailed information on plotting functions in the sources published in the footer of the article.
Guidelines for quickly publishing a graph of a function created in Desmos:
- Follow the link https://www.desmos.com/calculator
- Register or log in to your account (upper right corner)

- Build a graph of the desired function

- Save schedule

- Post a link to your schedule or save as a picture

Sources:
