8 with ½ ways to prioritize functionality
In 99% of all cases, do not try, do not close all tasks, do not fix all the bugs. One of the key skills is to choose from the whole flow those tasks whose solution will give maximum benefit.
Prioritization methods and common sense help to choose such tasks.
I share the methods of prioritization that I collected from a number of articles. I have little experience in translations. I would welcome comments and suggestions to the wording.
1. Analogue of the Eisenhower matrix (complexity - benefit)
One of the simplest and most common prioritization techniques. The horizontal axis is complexity, the vertical is benefit. The goal is to single out simple tasks with maximum benefit.
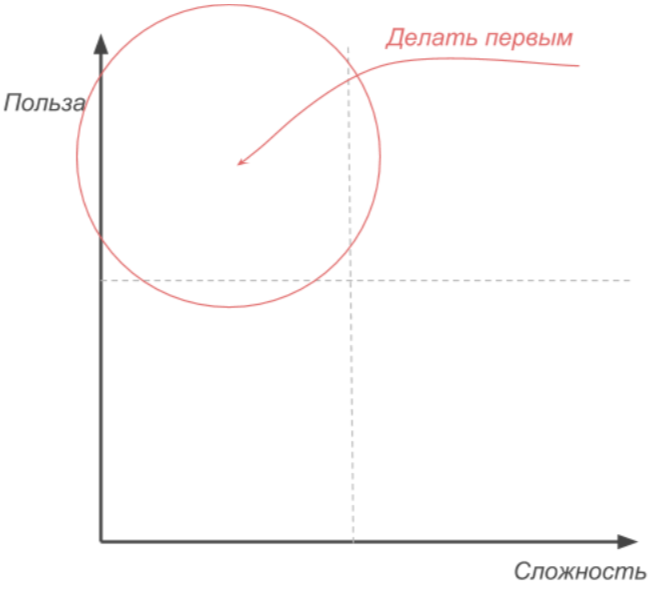
Example axes: development cost and increase conversion. That is, among all the tasks, we single out tasks with a minimum development cost and a maximum increase in conversion.
2. Estimation by parameters
Select the parameters by which we will rank the functionality. For example, two groups of parameters:
Benefit:
- increase turnover
- customer value
- value for the company.
Cost:
- complexity of implementation
- development cost
- risks.
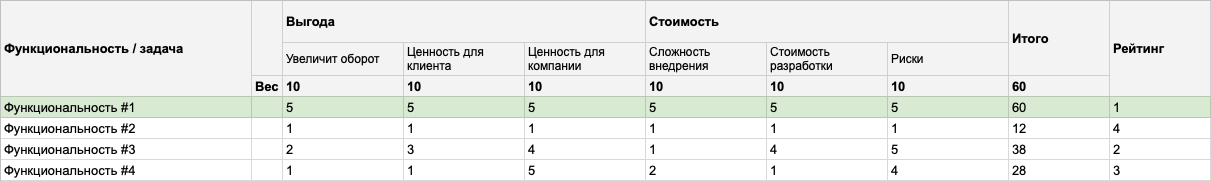
Calculation of the parameters in Google Spreadsheet .
For each parameter, we specify the weight and evaluate the functionality on a five-point scale:
- 1 point: few benefits, high cost;
- ...
- 5 points: maximum benefit, low cost.
The functionality that scores the most points is the desired important functionality.
Please note that in the “Cost” group the maximum score means the minimum cost.
2.1 Pirate Metrics (AARRR)
A special case of evaluation by parameters. We use AARRR as parameters and estimate the contribution of the task to each metric:
- attraction,
- activation,
- retention
- Spread
- and income.

Calculation in Google Spreadsheet .
As in the general case, we assign weights to metrics.
The most important task is the task with the maximum number of points.
3. Model Kano
The Kano model is a method for evaluating consumers' emotional responses to specific product characteristics.
Omitting the details, conclusions from this model:
- basic functionalities for the current product, the audience should be by default and stable;
- Having basic and basic functionality, invest in developing exciting functionality. They will highlight competitors, thanks to them they tell each other about the product.

Forming a list of works, ask yourself:
- We have implemented all the basic functions?
- And how many of our core?
- Explore the audience, looking for exciting features?
- Remember that admirers will be the main later, and later the base?
4. Buy functionality
The bottom line:
- assign a cost to each functionality, for example, in rubles (link the cost to the development cost);
- distribute to the stakeholders, clients a certain amount of money and offer them to buy the functionality you like;
- sales results and there is a ranked list of functionalities.
5. Affinity grouping
- Each team member writes his ideas on stickers (one idea - one sticker);
- then teams combine similar ideas into groups and give names to groups;
- at the end of the event, each team member votes or indicates the importance of the group in points.
Outcome: ranked groups with ideas for new tasks.
6. Hierarchy of user needs
Aaron Walter proposed Maslow's version of the pyramid for the user's needs. Salt: do not go to the next level until you satisfy the need for the current one.
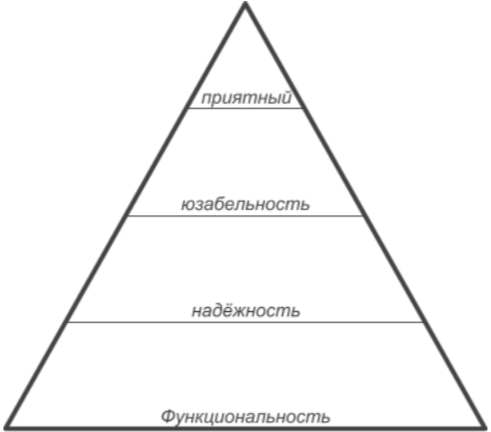
When choosing tasks to develop, ask yourself:
- at what level are we now?
- What to do now, so that tomorrow we will move to a new level?
- The results of the tasks we have chosen are needed by users?
7. Ask Sales
Communicate with sales managers: ask about what functionalities people ask, what do they lack in the product.
When you receive a request for functionality from the sales department, ask them:
- Why do consumers ask about it?
- Is the task part of a larger trend?
8. RICE
For each functionality, we evaluate:
- coverage (Reach). How many users will this be for a specific period of time?
- Impact. How much will this affect the conversion? (maximum - 3, strongly - 2, medium - 1, low - 0.5 and minimum - 0.25).
- Reliability (Confidence). How confident are you in your assumptions? (Maximum - 100%, medium - 80% and low - 50%).
- The complexity (Effort). How many person-months will this require? (At least a fortnight and integers).
Collect the data in the table and calculate the estimate according to the formula:

The meaning of the resulting metric is a general increase in conversion over a certain development time. Functionality with the maximum rating - the most important.
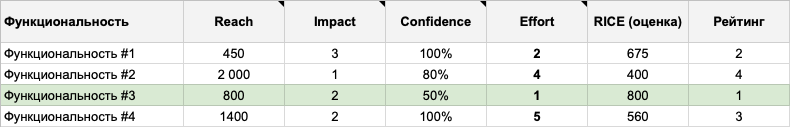
Calculation in Google Spreadsheet .
Summing up
The above methods will not help to create a product, determine the need and willingness to pay for its satisfaction. The maximum number of RICE points does not guarantee that a miracle will occur after the introduction of the functionality.
There are no ready-made recipes for success, but knowledge of the tools, common sense, and a culture of ranking tasks in a team increase the chances of success.