Floors: 3D navigation on WebGL at 2gis.ru
In 2014, 2GIS released Floors - this is a feature that allows you to look at the floor plan of the building and find the right organization on it. For a long time, it existed only in 2GIS mobile applications. Now this feature has appeared in the online version .
Floors for the web are made on WebGL technology: they are completely three-dimensional, they can be twisted and brought closer. This is the first project of the company, made on this technology, and we would like to share the experience of implementation.
Technological stack
WebGL technology, which allows you to make full three-dimensional graphics with hardware acceleration in the browser, is rapidly gaining popularity in web mapping. As good examples of its application, we can cite the already mentioned Google Maps , as well as the Mapbox GL library .
The advantage of cards made on WebGL in smoother transitions and animations, as well as the ability to flexibly control the appearance of the map. For example, Google maps can draw shadows from houses on the earth, the shape and size of which correspond to the current time of day. Obviously, this is not possible in traditional web cards that work on tiles: once you have changed the tiles, you can’t change them in any way, you can only show them as they are.
The disadvantage of WebGL is its great complexity and high entry threshold. Therefore, despite the fact that the technology is already 5 years old, its popularity is still low. We have long wanted to try WebGL on some not-so-difficult task, and Floors have become a great opportunity to do this.
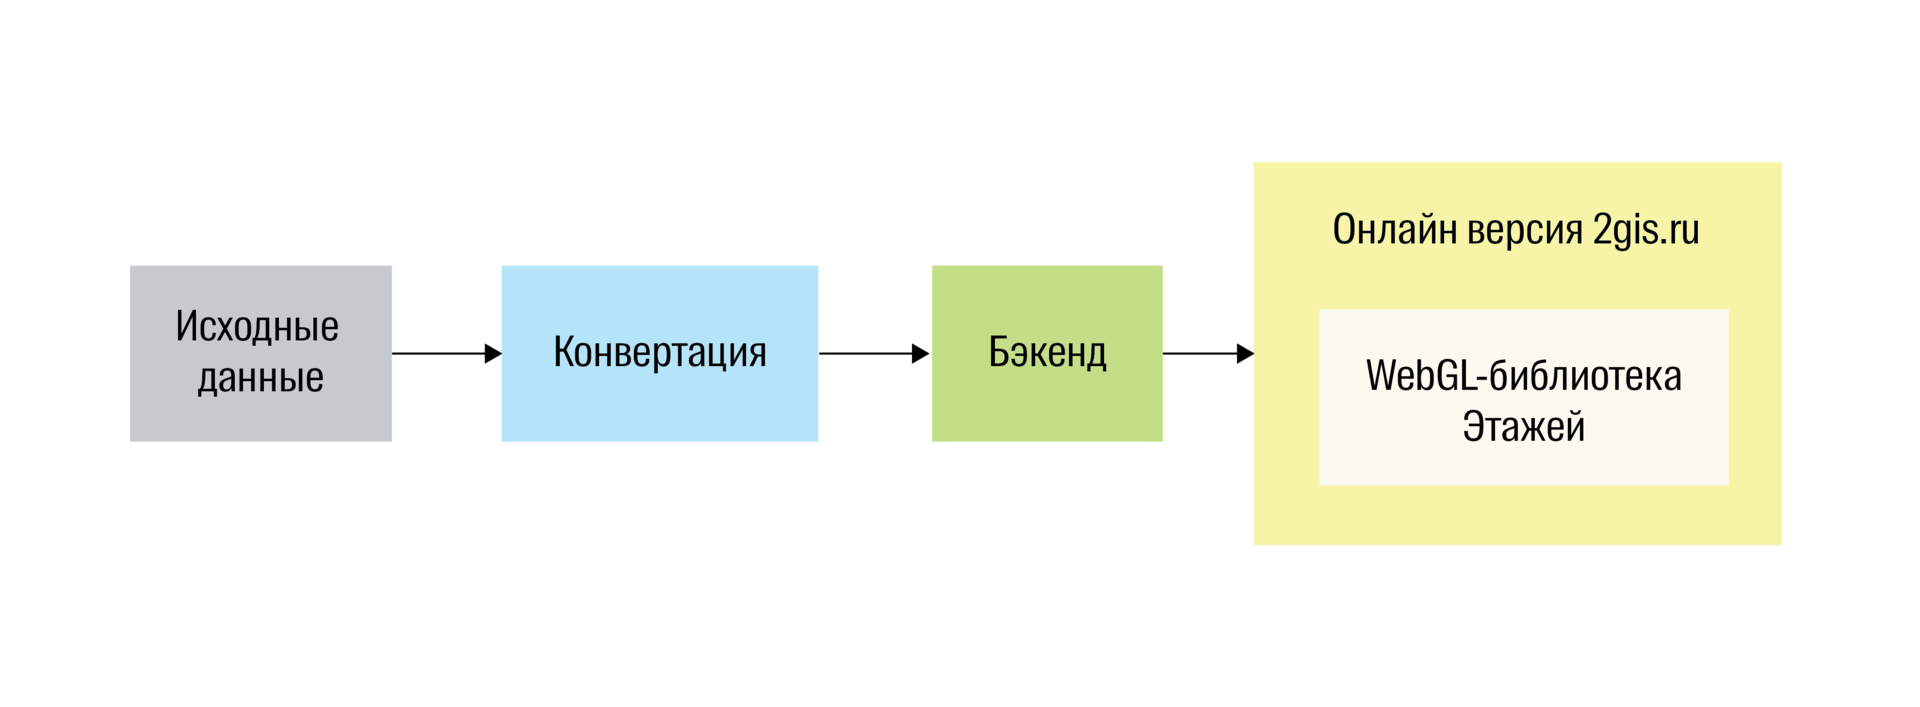
Our project consists of a WebGL application built into the online version of 2GIS and a backend that distributes data to it. When entering the Floors, the application loads data from the backend and draws a building on it.
Floor Architecture
In its original form, the data is a set of ordinary WKT geometries — room areas, line walls, and POI points. In this form, they are not suitable for rendering in WebGL, so you need to prepare them first: we remove everything superfluous from them, give the volume to flat geometries and triangulate everything. All these operations are performed on the server. For this, we have written a separate conversion application.
Working with WebGL directly is difficult: it is a low-level API in which you have to write a lot of code to achieve the simplest things. Our introductory article on WebGL describes how to draw a rotating cube on pure WebGL, and the complete code for the resulting example takes over 200 lines. Therefore, at an early stage of development, we used the popular threeG.js WebGL framework .
However, three.js is a heavyweight harvester with a huge number of features, of which we used only a small part. Therefore, at some point, we replaced it with a 2gl library written in our own hands , which contains only what we need.
Using your library reduced the build size of the application by more than two times and significantly improved its performance.
How We Overcome Difficulties
Developing a WebGL engine for drawing floor plans is far from the most standard task for a front-end developer. During the work on the Floors we had to solve many unusual, interesting and often unexpected problems, some of which we decided to write in this article.
How to make flat volumetric?
When we started work on the floors and began to study the format of the source data, it turned out that they were not even three-dimensional. The shape of each floor is represented by a set of two-dimensional areal (rooms) and linear (walls) geometries. For a flat display of floors in the mobile version of 2GIS, this format is enough. We had to figure out how to add volume to the floors.
There were no problems with the placeholders: we just draw them in the plane of the floor. But the walls had to tinker. At first we tried to just take the lines and make them into flat walls of zero thickness. It turned out ugly:
An early prototype of Floors with flat walls
In the real world, walls have a thickness. The same thing had to be done in the Floors.
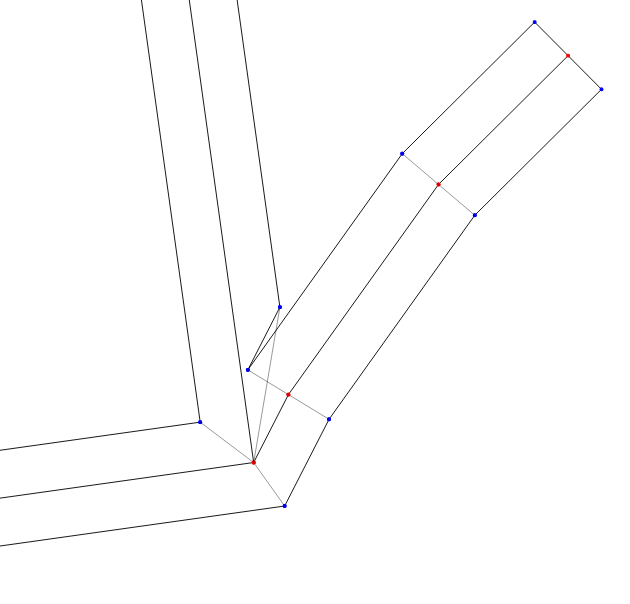
So, you need to get a set of three-dimensional wall geometries from a set of broken lines. In general, the solution to this problem is nontrivial. But we decided to go from simple and at first we tried to implement the simplest and most obvious solution “on the forehead”.
- Find all the intersection points of the walls.
- For each intersection point, we sort through all the pairs of walls that form the corners.
- For each such pair we measure the angle between them.
- We draw the bisector of this angle and set aside the “corner point” on it - it will become the outer border of the future thickened wall.
- We connect all the corner points and get the outer contours of the walls.
Animating an algorithm for different wall thicknesses
This simple algorithm only works well if a small wall thickness is required. If the walls need to be moved far, and especially if there are intersections at sharp angles in the data, the result will already be incorrect:
With a large thickness artifacts appear.
However, when we looked at the results of his work, it turned out that he gives good data on our data results in 100% of cases, so it turned out to be not at all necessary to invent something more complex.
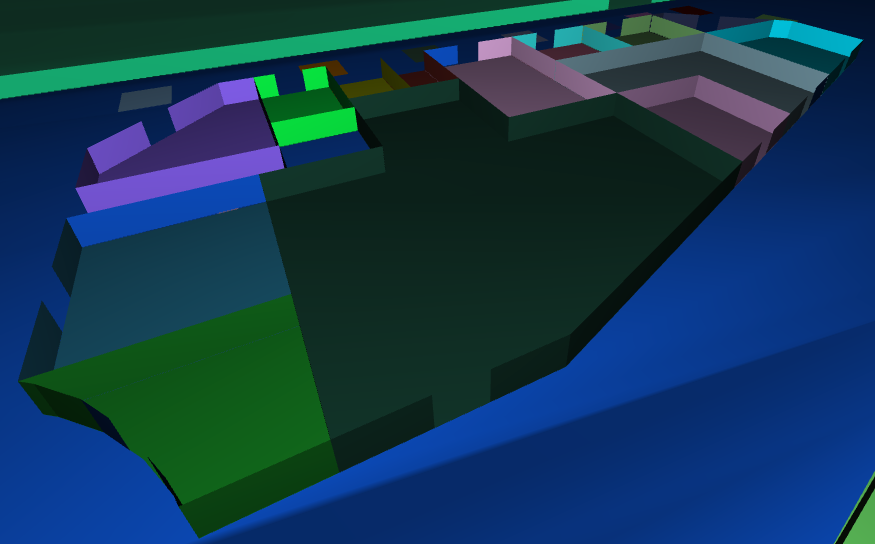
As a result, we got beautiful, voluminous walls in the floors, solving a potentially difficult task with hundreds of lines of simple code:
Walls are now material
How to program inertia?
No modern map engine can do without inertial movement when dragging a map. Thanks to inertia, the card behaves like a material object, moving it becomes intuitively simple and pleasant. Inertia is one of the first things a user sees and experiences, having opened a card a second ago and started to move it. Therefore, it makes a particularly big contribution to the overall impression of using the card.
You can read about how inertia in cards is generally arranged in this article.. The solution described in it has one drawback: in it, the slowdown animation relies on the periodic call of a special function, which reduces the speed of the card by a certain number of times on each frame. Such an implementation will work correctly only with constant FPS. If FPS slips, then this function will be called less often, and the animation will last longer than necessary.
To remove the dependence on FPS, you need to calculate the position of the map based on the time elapsed since the start of the animation. You need to calculate it by some formula.
What should this formula be? The first answer that occurred to us was the kinematic equation of uniformly accelerated motion from a physics textbook for the eighth grade. Here it is:
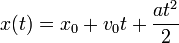
Here:
x0 - initial position
v0 - initial speed
a - acceleration
Perfect! x0 and v0, we know, and by choosing the value of the constant a, we can customize the animation. And most importantly, the inertia working according to this formula will be realistic and make a good impression.
So we thought, until we programmed this formula. It turned out that she works very badly. At small absolute values of the acceleration, the shopping center uncontrollably left the screen after the slightest mouse movement, as if the car was on slippery ice, while at large - the map stopped almost instantly after the drag.
Both options created an equally unpleasant impression: in the first case, the sense of control was lost, in the second the impression of a poorly lubricated mechanism was created. The golden mean could not be found.
Tired of futile attempts to find the optimal acceleration, we tried to use instead of the physical equation one of Robert Penner's easing functions , which have been used for many years for js animations and are built into many libraries.
The result was excellent: after the dredge, the map stopped smoothly and gracefully, while not leaving too far. And despite the fact that its movement has ceased to be “correct” from the point of view of physics, it has become much more perceived.
We experimented with different easing-functions and as a result wrote our own, which worked exactly as we wanted, but this is not the most important part of the story. Most importantly, the simple lesson we learned: realistic animation does not mean good animation.
How to sign rooms?
We designate rooms and objects on floors with the help of markers and signatures to them. How to draw markers in a WebGL application? The simplest solution is to create a DOM element for each of them and display them on top of the WebGL canvas. On each frame, it is necessary to calculate the new position of each marker and move the corresponding DOM nodes.
We had to abandon this idea almost immediately for one simple reason: the DOM is too slow. The need to update the positions of a large number of DOM elements for each frame led to an increase in the frame rendering time by a factor of tens.
Only one way out is to use WebGL sprites. It is enough to draw a rectangle (namely, two triangles), pull the desired texture on it and place it in the 3D scene. That’s how, for example, monsters were drawn in old 3D shooters:
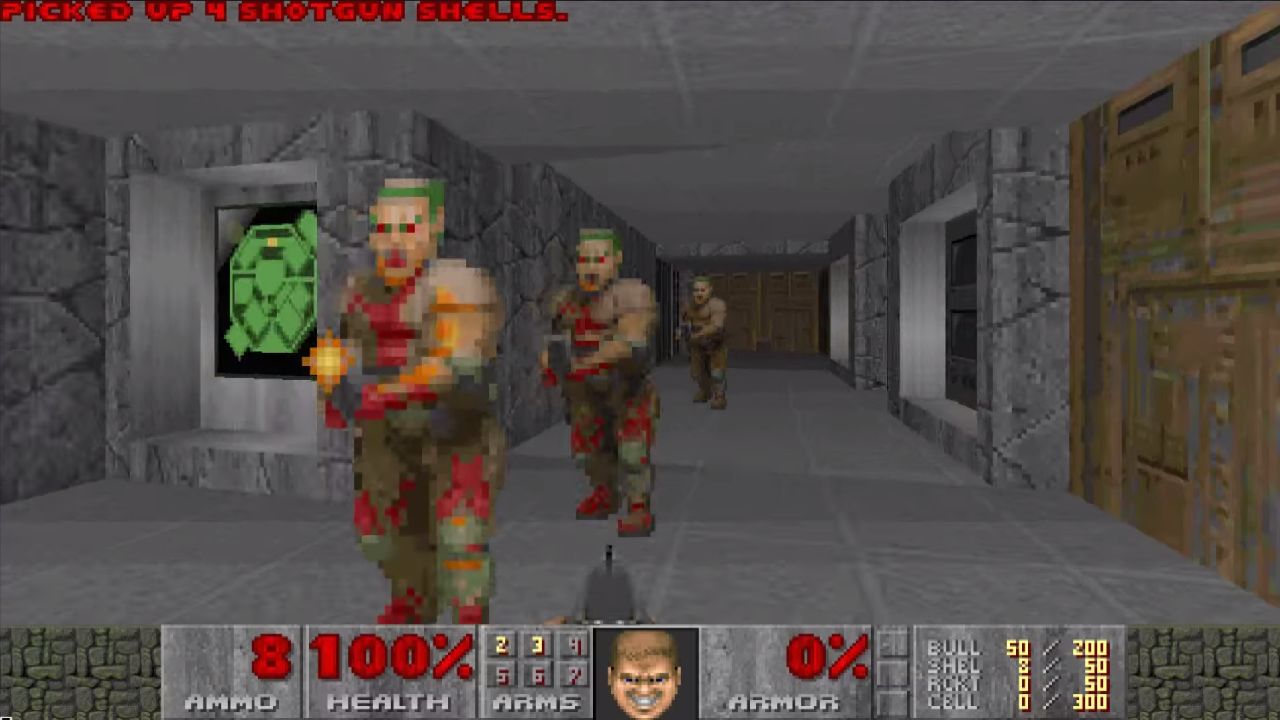
Almost what we need
From the zombies in Doom II, the markers in the floors differ only in one detail: their size does not depend on the distance to the camera. This requirement is easily implemented using a custom vertex shader: we wrote a special shader for markers that positions the sprite vertices exactly as needed to maintain a constant size in pixels.
WebGL sprite rendering is very fast: you can map thousands of objects without losing performance. But when there are too many markers on the map, the following problem appears: they overlap each other.
What happens if all the floor objects are signed at the same time
A common solution to this problem is clustering markers. This approach consists in the fact that among the set of all markers the groups of the most closely spaced (clusters) are distinguished, and when the scale is reduced, the cluster is replaced by one collective marker.
In floors, we use a simpler approach, which we called generalization: we simply assign a priority to each marker and hide low priority markers if they overlap more important markers.
To check the intersection of markers, you need to represent them in the form of bounds - rectangular areas that they occupy on the screen. And we choose priorities based on the type of marker: for example, infrastructure objects (elevators, toilets, etc.) have the highest priority, so they will always be visible even on the smallest scales.
Generalization work: leaving the most important
A naive implementation of such an algorithm has a quadratic complexity: each marker must be checked for intersection with all the others. To make it work faster, we used the excellent rbush library that implements the R-tree data structure. The R-tree can store rectangular areas and quickly search for their intersections - this is exactly what we need.
After applying rbush, the complexity becomes n * log (n), and on the floors of the Dubai Mall (up to 1000 objects on the floor), the algorithm completes in ~ 10 ms. By moving it to a web worker, we completely ruled out its effect on FPS.
The last difficulty in drawing markers on WebGL is making them clickable. DOM elements have events (click, mouseover, etc.) that you can simply subscribe to; in the world of webgl this is not. Therefore, it is necessary to learn how to independently determine in which cursor the user clicked on the coordinates of the cursor.
Here the rbush library comes to our aid again: it’s enough to build an R-tree containing the bounds of all currently visible markers, and just click on it to search for a click. Searching the R-tree is a logarithmic operation, it is performed quickly, and you can easily perform it not only by clicking, but also by any change in the cursor position. This allows markers to be sensitive not only to clicks, but also to mouse hover.
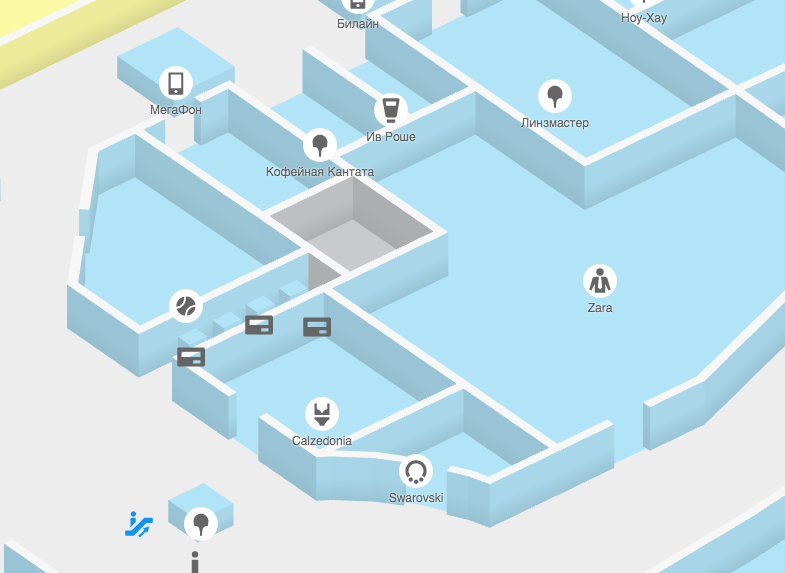
How to make isometry beautiful?
It’s easy to notice that the Floors uses an isometric projection , which is rather unusual for web maps.
If for ordinary three-dimensional maps the perspective projection familiar to everyone is better suited, then the layout of the room looks much better in isometry. In this projection, distant objects have the same size as close ones, so that the map becomes more visual and schematically good. Moreover, it is simply beautiful.
Isometric projection has one drawback: it does not look good at different angles of rotation of the map. If you rotate the camera so that the walls are located on the screen strictly vertically and horizontally, you get the following picture:
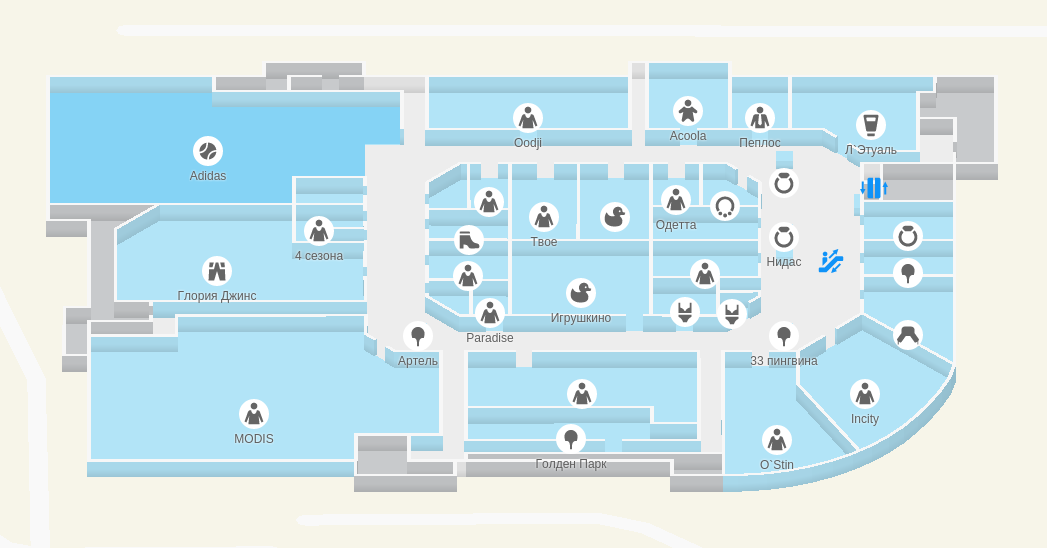
Unsuccessful rotation angle
This is not very beautiful: vertical walls turn out to be almost invisible, the map is poorly read.
Initially, we opened all the buildings in the default “north up” position, and the shopping centers, where the walls are located along the parallels and meridians, looked just like that.
If you turn the camera a little and position the walls exactly as it should in an isometry, it turns out like this:
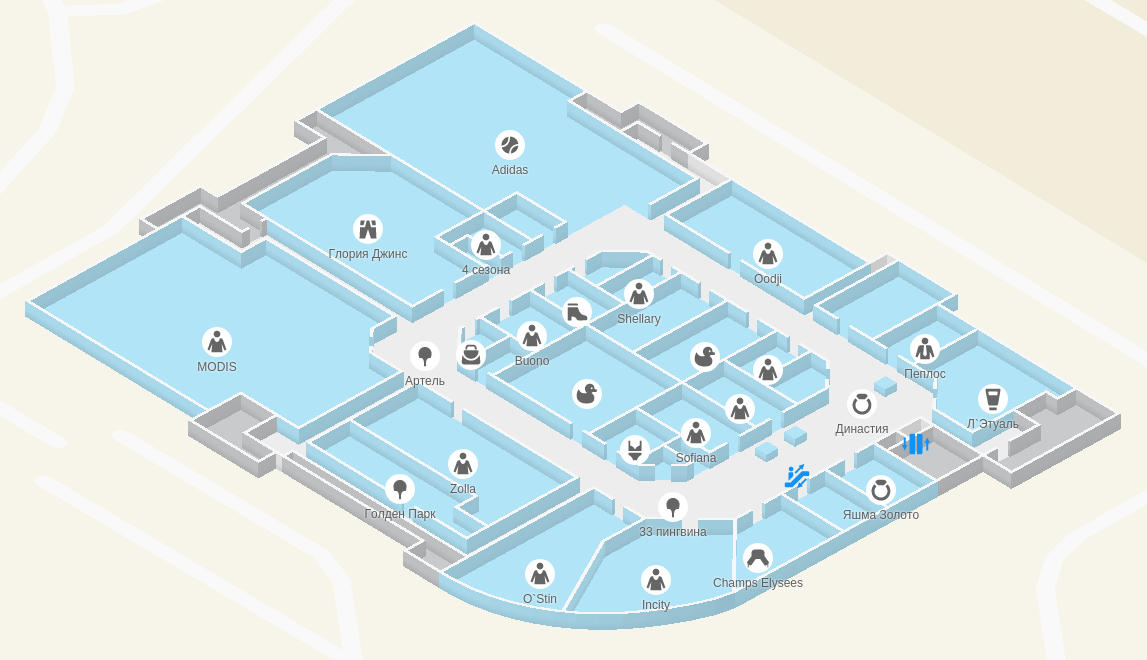
A successful angle of rotation is
much better. We are familiar with this view because of the large number of old-school (and not so) games that use isometry:

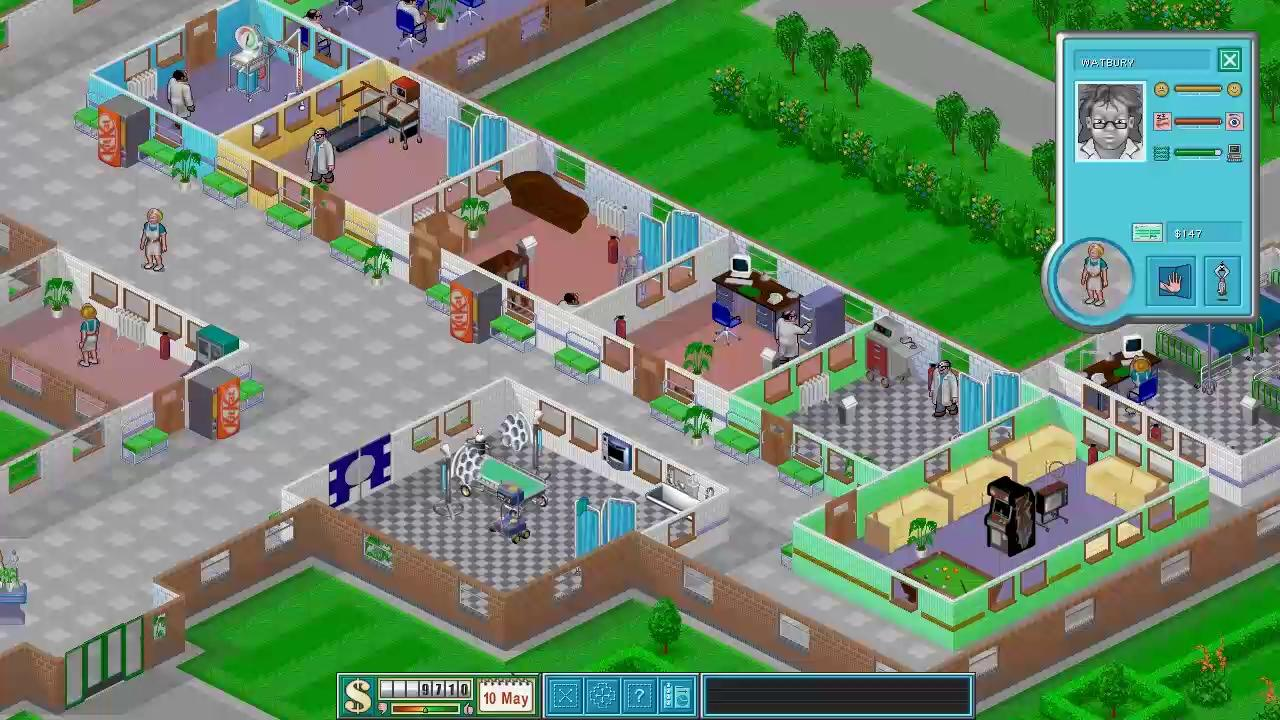
Fallout 2 and Theme Hospital.
Thus, we were faced with the task of calculating the most optimal angle of rotation for each shopping center, so that when opening the floor mode, present it in the best possible way.
If the architecture of the premises in isometric games is usually simple (all walls are perpendicular), then with real buildings everything is not so simple: in our data there are shopping centers of very bizarre shapes, where the walls intersect at the most strange angles.
However, we noticed that even in the most complex buildings, there is some direction in which the vast majority of the walls are located.
We decided to use this fact. In mathematics, such a prevailing frequency value is called “fashion”. When preparing the data, we tried to measure the angles of each wall of the shopping center and find the fashion of the resulting set. Adding PI / 4 to the found mode, we got the desired angle of rotation of the camera.
The algorithm showed excellent results: it accurately determines the "main direction" of the walls and deploys the building along them.
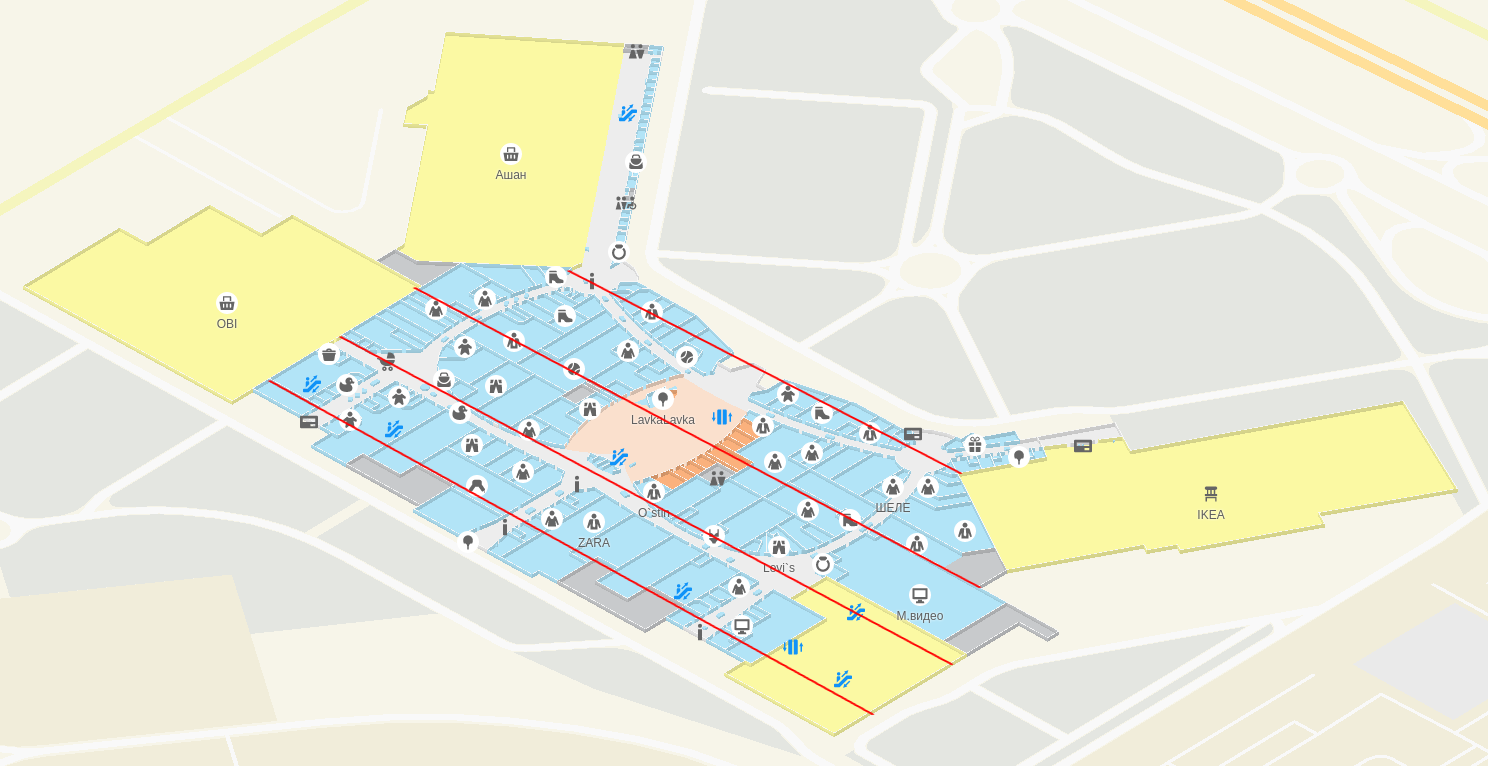
Correctly deployed shopping center “Mega Khimki”
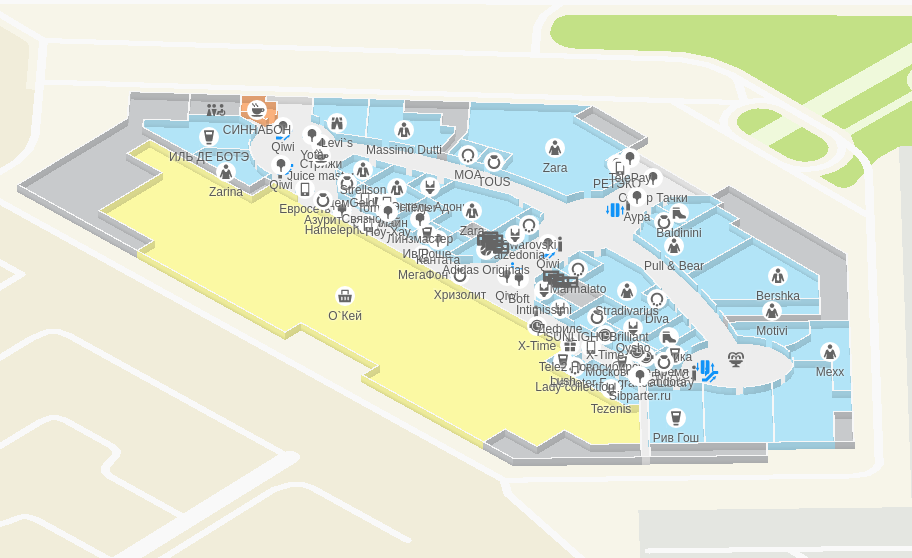
In mathematics, if a set contains more than one mode, it is called multimodal. Opening different buildings on the Floors in 2GIS, you can see that this term can also be applied to some shopping centers:
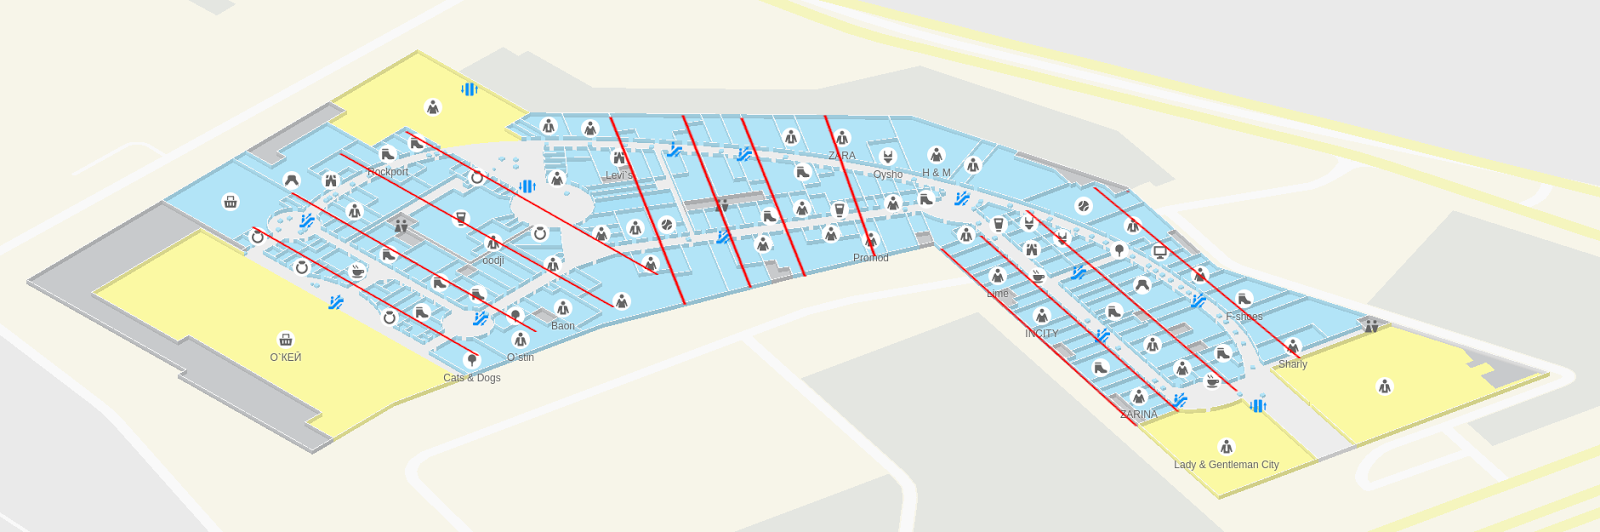
the Golden Babylon shopping center with three modes
Despite the fact that there are several modes, one of them is more fashionable. On it we are deploying a plan of the shopping center. Mathematics sometimes manifests itself in our lives in the most unexpected forms, and this is perhaps one of such cases.
conclusions
Most of the time Floors were developed by two programmers. When we started working on the project, none of us knew anything about WebGL or 3D graphics in general, and our web development experience was rather modest.
The first versions of Floors looked scary and worked at best on 20FPS. During development, we filled all the bumps that we could fill, more than once we completely rewrote large parts of the project. But the result each time turned out to be slightly better than the previous one, and this has inspired us from the very first prototype, and it still inspires us.
Do not be afraid to try WebGL: this technology allows you to do really fantastic things .