March 25, 2016 at 11:09
Experimental .NET Core Debugging Function in Visual Studio Code
- Transfer
Today we are releasing the first, experimental and evaluation version of the debugger for the ASP.NET Core CLI toolkit as part of the Visual Studio Code editor. First I have to mention a few things:
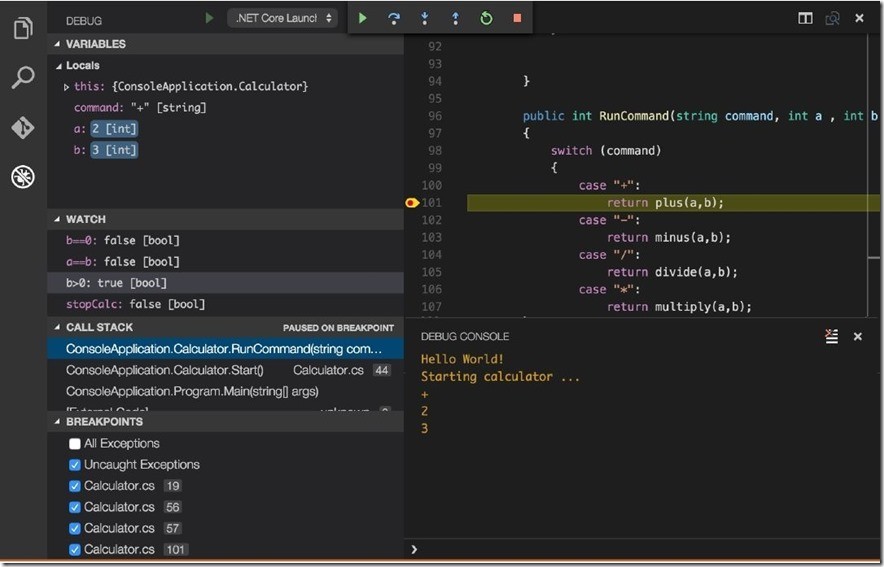
This first release supports breakpoints, step-by-step execution, variable tracking, and call stacks.
However, .NET Core and debugging features are in the early stages of development, so VS Code lacks a number of features familiar to Visual Studio IDE users. Here are some features of the editor:
We look forward to your feedback in order to select the most important opportunities for implementation. More details at the end of this publication.
First, you need to perform a series of actions ( detailed instructions are provided on our GitHub page ):
After installing and configuring the extension, you will have access to the basic debugging capabilities described above. But with the launch.json file, you can configure a lot more features.
If stopAtEntry is checked, the debugger will automatically stop at the entry point to the application. This will allow you to execute the code in steps, without setting breakpoints.
Besides the default debug configuration, there is a configuration . NET Core Launch ( web ) , which provides good initial debugging capabilities for ASP.NET applications. It contains an additional “launchBrowser” section, which allows you to open a web browser on the computer used for development, at the start of each debugging. Initially, it is configured to use the default browser, but you can choose another one by changing the commands in the file. To get started and try out ASP.NET in action, download the ASP.NET CLI samples from Github .
Here is an example of the launch.json file settings for opening a page in Opera:
The URL that opens in the browser can also be changed. By default, the debugger determines the URL automatically and goes to the URL that the server is listening on. The placeholder $ { auto - detect - url } means the command to find the URL automatically. It can be used in any configuration section. If you need to use only a specific URL during debugging, for example, http: // localhost: 5000 / api / customers / 42 , you can change the default value so as not to open this address manually.
In connection scenarios, the third configuration section is integrated. You only need to specify the name of the application process for debugging. In our case, this is HelloWorld . If you start the application from the command line using the dotnet run command , make sure that the configuration is selected before starting the debugger . NET Core Attach .
If several processes are running under the same name, you can specify the value of the processId parameter (process identifier) instead of processName (process name). Do not use both properties at the same time.


Currently, the configuration does not display three additional properties by default. If you want to familiarize yourself with them without delving into the documentation, here is a hint: enter the characters “ o in launch.json (do not forget the quotation mark at the beginning), and the automatic completion function displays a list of properties containing the letter“ o ”.
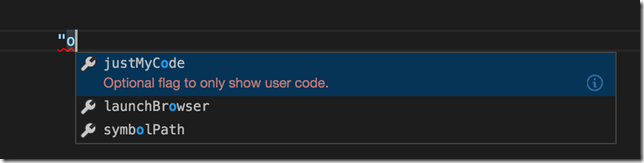
This feature comes in handy during editing, but you may need consistently up-to-date documentation. As always, the final truth is presented in code. If you want to delve into the details, pay attention to the installation folder - it contains the package file . the json . This is the main template for any valid configurations. This simple and straightforward json file provides a very good idea of the configurations that are possible on your machine for the current version of the extension.


symbolPath
The parameter "symbolPath" allows you to specify an array of paths to debug symbols. It is very convenient if the characters are located on a central server or if several operating systems are used during development. Symbols generated in a particular operating system can be used in others.
The following is a valid character path configuration:
justMyCode
If the code is executed step by step during debugging, switching to the code of the framework or components that you are not the author of may turn out to be unnecessary. Therefore, we created the justMyCode function . By default, it is turned on, since this behavior of the environment during normal debugging seems most convenient. But if you want to debug the code of the framework or external components, set it to false.
sourceFileMap
If you want to point out to the debugger the source files for a debugging session, specify the mapping table using the sourceFileMap property. This property can contain any number of records. It will help you debug exactly those source code files that you need. An example configuration is shown below:
As mentioned at the beginning, this is our first experimental release of debugging tools, and your help is required to improve them. If you want to regularly receive news about our work and send feedback on the development of .NET Core applications in Visual Studio Code, join the Visual Studio Code .NET Core Insiders group .
As always, we welcome your feedback. Tell us what you liked and what you don’t, what features you are missing, what components of the workflow are right for you or not. You can contact us by e-mail , by sending messages about problems on our page on Github or via Twitter .
Daniel Meixner is a technical evangelist at Microsoft in Germany. Firmly believes in cross-platform ideas. His career in software development was eventful (both pleasant and not very), and he has an understanding of the industry from many perspectives. Prior to joining Microsoft, he received MVP status in Visual Studio ALM and ALM Ranger, worked as a consultant and architect of ALM solutions in corporate environments. Check out Daniel’s blog, http://DevelopersDevelopersDevelopersDevelopers.NET, or follow him on Twitter .
- Only the new evaluation version of the .NET Core CLI toolkit is supported ; support does not extend to the current DNX features (more about the changes in this ASP.NET developer blog post with questions and answers ).
- IntelliSense VS Code does not yet support the .NET CLI tools. Therefore, when debugging CLI projects, IntelliSense will be unavailable.
This first release supports breakpoints, step-by-step execution, variable tracking, and call stacks.
However, .NET Core and debugging features are in the early stages of development, so VS Code lacks a number of features familiar to Visual Studio IDE users. Here are some features of the editor:
- At the beginning of debugging, a separate console window does not open: all the data returned by the program is displayed in the Debug Console window of the VS Code editor. To use the Console.ReadLine function in the console, you must start the application using dotnet run outside the VS Code environment, and then connect the debugger.
- Lack of the Edit & Continue function: you cannot change the code and apply the changes during debugging.
- You cannot change the values of variables during debugging.
- There are no trace points or conditional breakpoints.
- Set Next Statement function is not supported
We look forward to your feedback in order to select the most important opportunities for implementation. More details at the end of this publication.
Beginning of work
First, you need to perform a series of actions ( detailed instructions are provided on our GitHub page ):
- Install (or upgrade to) Visual Studio Code version 0.10.10 or later
- Install .NET CLI Tools
- Install C # Extension
- Open any .cs file in the VS Code environment to download the extension and complete the installation (progress can be monitored in the Output panel)
- Install mono
Debugging features
- Breakpoints - the ability to set breakpoints with one click (or press F9) in the editor.
- Reference Values — Set the values to monitor.
- Local variables - automatic display of the values of local variables.
- Call Stack - View information about method calls on the stack.
- Debug Console - contains all debug messages (to hide or show this area, press Ctrl + Shift + Y or Cmd + Shift + Y on a Mac).
- Current values - hover over a variable to find out its value.
- Associated values are displayed in all areas: when you click an entry in the call stack, the environment automatically jumps to the corresponding line in the editor and also updates the control values and local variables
What else can be configured for debugging?
After installing and configuring the extension, you will have access to the basic debugging capabilities described above. But with the launch.json file, you can configure a lot more features.
Stop at the entry point
If stopAtEntry is checked, the debugger will automatically stop at the entry point to the application. This will allow you to execute the code in steps, without setting breakpoints.
Debugging configuration for ASP.NET applications
Besides the default debug configuration, there is a configuration . NET Core Launch ( web ) , which provides good initial debugging capabilities for ASP.NET applications. It contains an additional “launchBrowser” section, which allows you to open a web browser on the computer used for development, at the start of each debugging. Initially, it is configured to use the default browser, but you can choose another one by changing the commands in the file. To get started and try out ASP.NET in action, download the ASP.NET CLI samples from Github .
Here is an example of the launch.json file settings for opening a page in Opera:
…
"osx": {
"command" : "open",
"args" : "-a opera ${auto-detect-url}"
}
…
Change the URL you open
The URL that opens in the browser can also be changed. By default, the debugger determines the URL automatically and goes to the URL that the server is listening on. The placeholder $ { auto - detect - url } means the command to find the URL automatically. It can be used in any configuration section. If you need to use only a specific URL during debugging, for example, http: // localhost: 5000 / api / customers / 42 , you can change the default value so as not to open this address manually.
Connection scripts
In connection scenarios, the third configuration section is integrated. You only need to specify the name of the application process for debugging. In our case, this is HelloWorld . If you start the application from the command line using the dotnet run command , make sure that the configuration is selected before starting the debugger . NET Core Attach .
If several processes are running under the same name, you can specify the value of the processId parameter (process identifier) instead of processName (process name). Do not use both properties at the same time.
Hidden configuration properties
Currently, the configuration does not display three additional properties by default. If you want to familiarize yourself with them without delving into the documentation, here is a hint: enter the characters “ o in launch.json (do not forget the quotation mark at the beginning), and the automatic completion function displays a list of properties containing the letter“ o ”.
This feature comes in handy during editing, but you may need consistently up-to-date documentation. As always, the final truth is presented in code. If you want to delve into the details, pay attention to the installation folder - it contains the package file . the json . This is the main template for any valid configurations. This simple and straightforward json file provides a very good idea of the configurations that are possible on your machine for the current version of the extension.
symbolPath
The parameter "symbolPath" allows you to specify an array of paths to debug symbols. It is very convenient if the characters are located on a central server or if several operating systems are used during development. Symbols generated in a particular operating system can be used in others.
The following is a valid character path configuration:
“symbolPath”:”[ \”/Volumes/symbols\” , \”/OtherVolume/otherSymbols\” ]”
justMyCode
If the code is executed step by step during debugging, switching to the code of the framework or components that you are not the author of may turn out to be unnecessary. Therefore, we created the justMyCode function . By default, it is turned on, since this behavior of the environment during normal debugging seems most convenient. But if you want to debug the code of the framework or external components, set it to false.
“justMyCode”:false
sourceFileMap
If you want to point out to the debugger the source files for a debugging session, specify the mapping table using the sourceFileMap property. This property can contain any number of records. It will help you debug exactly those source code files that you need. An example configuration is shown below:
“sourceFileMap”: {
“C:\foo\bar”:”/home/me/foo/bar”
}
Send us feedback
As mentioned at the beginning, this is our first experimental release of debugging tools, and your help is required to improve them. If you want to regularly receive news about our work and send feedback on the development of .NET Core applications in Visual Studio Code, join the Visual Studio Code .NET Core Insiders group .
As always, we welcome your feedback. Tell us what you liked and what you don’t, what features you are missing, what components of the workflow are right for you or not. You can contact us by e-mail , by sending messages about problems on our page on Github or via Twitter .
about the author
Daniel Meixner is a technical evangelist at Microsoft in Germany. Firmly believes in cross-platform ideas. His career in software development was eventful (both pleasant and not very), and he has an understanding of the industry from many perspectives. Prior to joining Microsoft, he received MVP status in Visual Studio ALM and ALM Ranger, worked as a consultant and architect of ALM solutions in corporate environments. Check out Daniel’s blog, http://DevelopersDevelopersDevelopersDevelopers.NET, or follow him on Twitter .
useful links
- Visual Studio 2015: Free Developer Offerings
- Additional and free tools and services in Visual Studio Dev Essentials
- Laboratory work on the development, testing and lifecycle management of software for Visual Studio 2015
- Laboratory work on the development of universal applications on Windows 10