Zabbix 3.0: Predicting Problems
In a large review article, we briefly talked about the main features of Zabbix 3.0. Now we want to bring to your attention a series of mini-reviews of the new features of Zabbix 3.0, let's start with forecasting problems .
Why are we watching the weather forecast? So that on a sunny day it would seem, having got out into the park, not to be caught by surprise in the pouring rain. An accurate weather forecast helps us take countermeasures: take an umbrella, a raincoat, or even go to the cinema instead of a park.
The new version of Zabbix also has the ability to also make predictions to find out if there will be a storm on the network or in the server rack, and when this can happen.
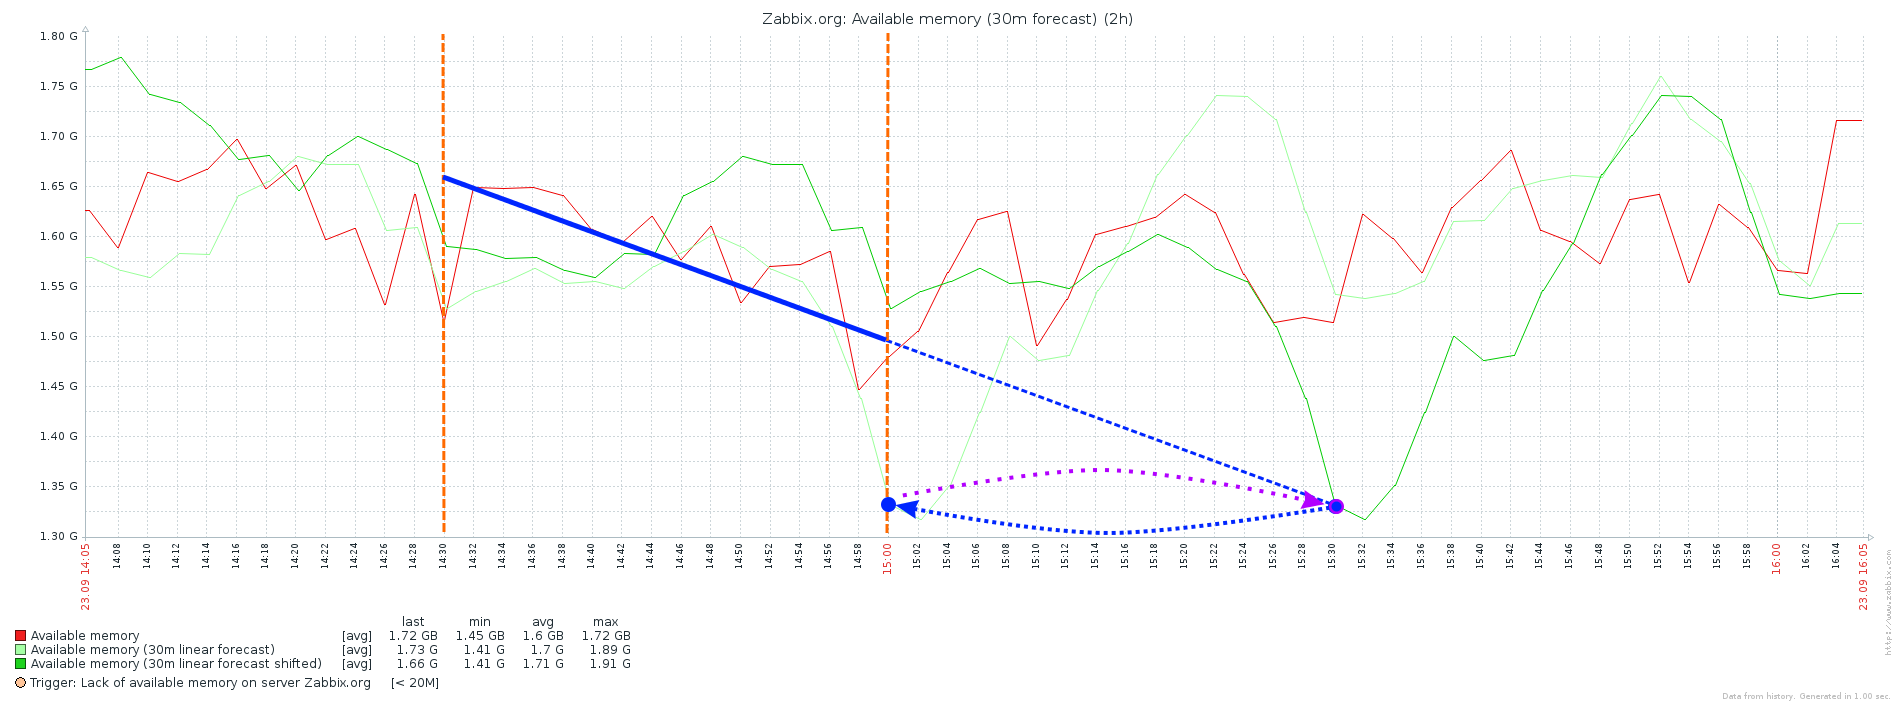
The only problem is that forecast will not display on the chart in the future, and the forecast value will be tied to the time when it was calculated. To see the forecast on the graph in the future, we use another calculated data element (let's call it 30m linear forecast shifted), which will simply shift the forecast value 30 minutes ahead, using the timeshift feature available for all functions:
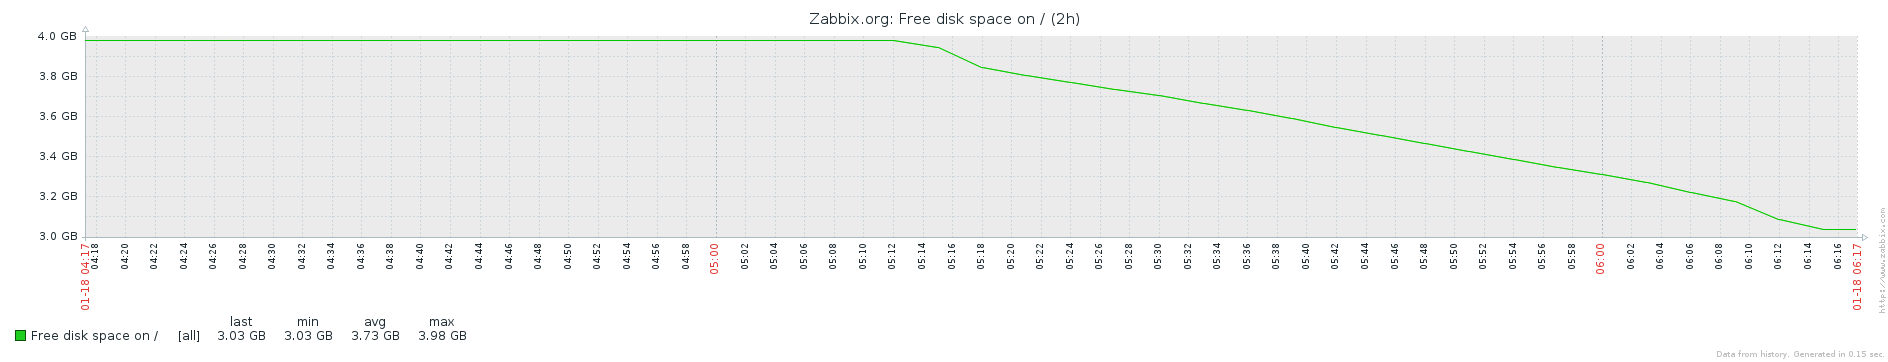
A trigger with a simple threshold of 1 GB or 10% does not take into account one very serious nuance - disks can fill up with completely different speeds. Therefore, it will fire either too early or (worse) too late when we are already at zero.
A trigger using the timeleft statistic function will give us 1 hour to clean or expand the disk:
In addition, for complex cases, Zabbix offers a choice of trend line functions that you could use in a familiar table processor:


An accurate weather forecast saves us from having to carry an umbrella when it’s just not needed, and from getting wet when it is likely that it will rain.
The forecasting features in Zabbix will help the infrastructure work with as few glitches as possible and keep the services available. After all, preventing a future problem is easier than already accomplished.
Translation of an article from our blog.
Why are we watching the weather forecast? So that on a sunny day it would seem, having got out into the park, not to be caught by surprise in the pouring rain. An accurate weather forecast helps us take countermeasures: take an umbrella, a raincoat, or even go to the cinema instead of a park.
The new version of Zabbix also has the ability to also make predictions to find out if there will be a storm on the network or in the server rack, and when this can happen.
How it works in Zabbix
Zabbix looks at the history of the data collected and predicts how events will develop in the future. Then the triggers can be configured to trigger even before a future problem occurs, followed by the launch of actions such as notifications of responsible or automatic launch of scripts, remote commands.Forecast visualization
To visualize the prediction on the graph, you select a data element (for example, the number of free space on the hard disk) and create a new calculated data element (let's call it 30m linear forecast) based on it using the forecast function . Indicate the time interval in the past, which is used for statistical analysis (for example, 30 minutes) and indicate how far to build a forecast (also, say, 30 minutes). Next, Zabbix does the calculation, finds the best option and returns it to you:forecast(host:item,30m,,30m)The only problem is that forecast will not display on the chart in the future, and the forecast value will be tied to the time when it was calculated. To see the forecast on the graph in the future, we use another calculated data element (let's call it 30m linear forecast shifted), which will simply shift the forecast value 30 minutes ahead, using the timeshift feature available for all functions:
last(host:item_forecast,#1,30m)Trigger Usage
The ability to predict can be useful in controlling free disk space.A trigger with a simple threshold of 1 GB or 10% does not take into account one very serious nuance - disks can fill up with completely different speeds. Therefore, it will fire either too early or (worse) too late when we are already at zero.
A trigger using the timeleft statistic function will give us 1 hour to clean or expand the disk:
{host:vfs.fs.size[/,free].timeleft(30m,,0)} < 1hIn addition, for complex cases, Zabbix offers a choice of trend line functions that you could use in a familiar table processor:
We look ahead clearly
An accurate weather forecast saves us from having to carry an umbrella when it’s just not needed, and from getting wet when it is likely that it will rain.
The forecasting features in Zabbix will help the infrastructure work with as few glitches as possible and keep the services available. After all, preventing a future problem is easier than already accomplished.
Translation of an article from our blog.