Monitoring task completion in IPython Notebook
I would like to share a simple but useful tool. When you work a lot with data, primitive but long operations often arise, for example: “download 10,000 URLs”, “read a 2GB file, and do something with each line”, “parse 10,000 html files and get the headers” . It is alarming to look into a hung terminal for a long time, so for a long time I used the following ingenious code:
This function is beautiful, for more than a year she wandered from task to task. But recently, I noticed an IntProgress widget in the standard Jupyter package and realized that it was time to change something:
Logging in stderr has three small problems:
Like many people who work with data, I am a fan of Jupyter. I spend most of my time there. Therefore, I can afford the following solution, incompatible with other environments:
Everything is the same, only the counter is displayed not in stderr, but in a special widget. Very simple and convenient. For those who are also hooked on Jupyter, I posted a slightly improved version on github.com/alexanderkuk/log-progress on github . The module is distributed by copy-paste. Use on health.
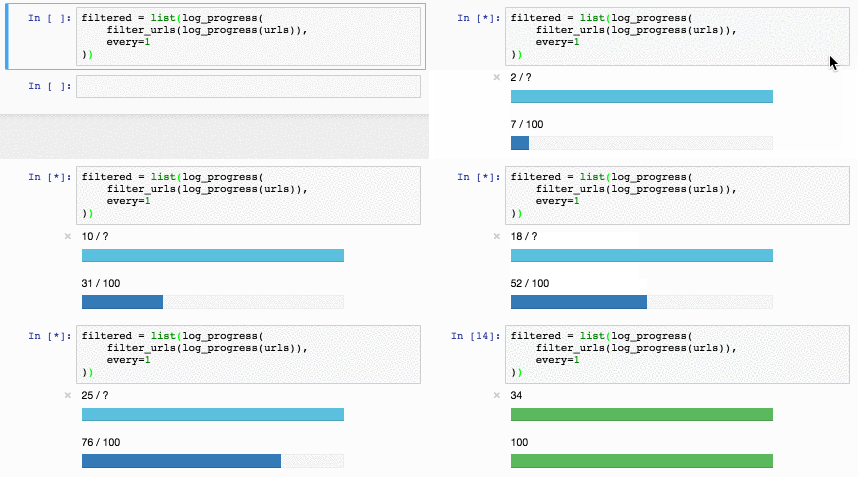
The improved version displays, in addition to the strip, a counter. And it changes color depending on whether the operation completed successfully or not: It

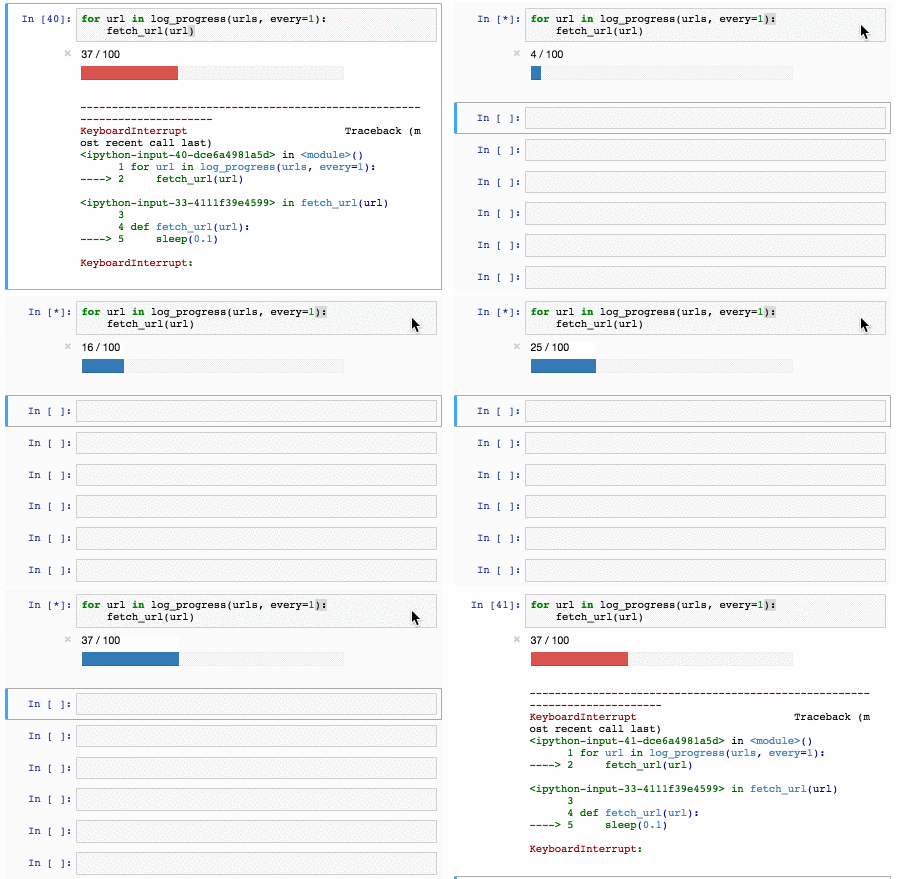
supports iterators:

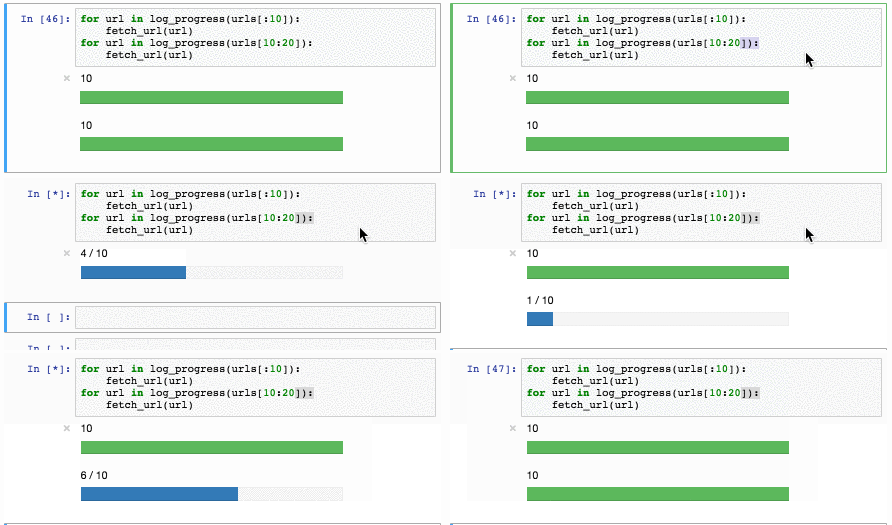
Naturally, there can be several progress of bars in one cell:
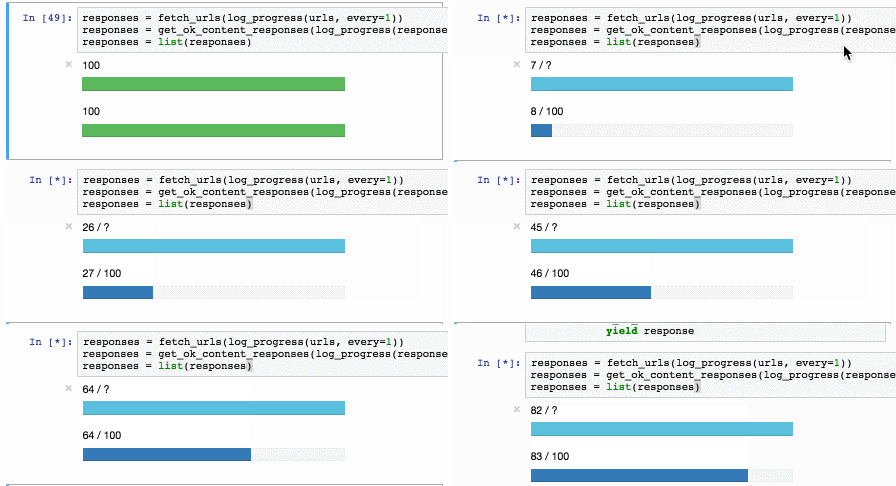
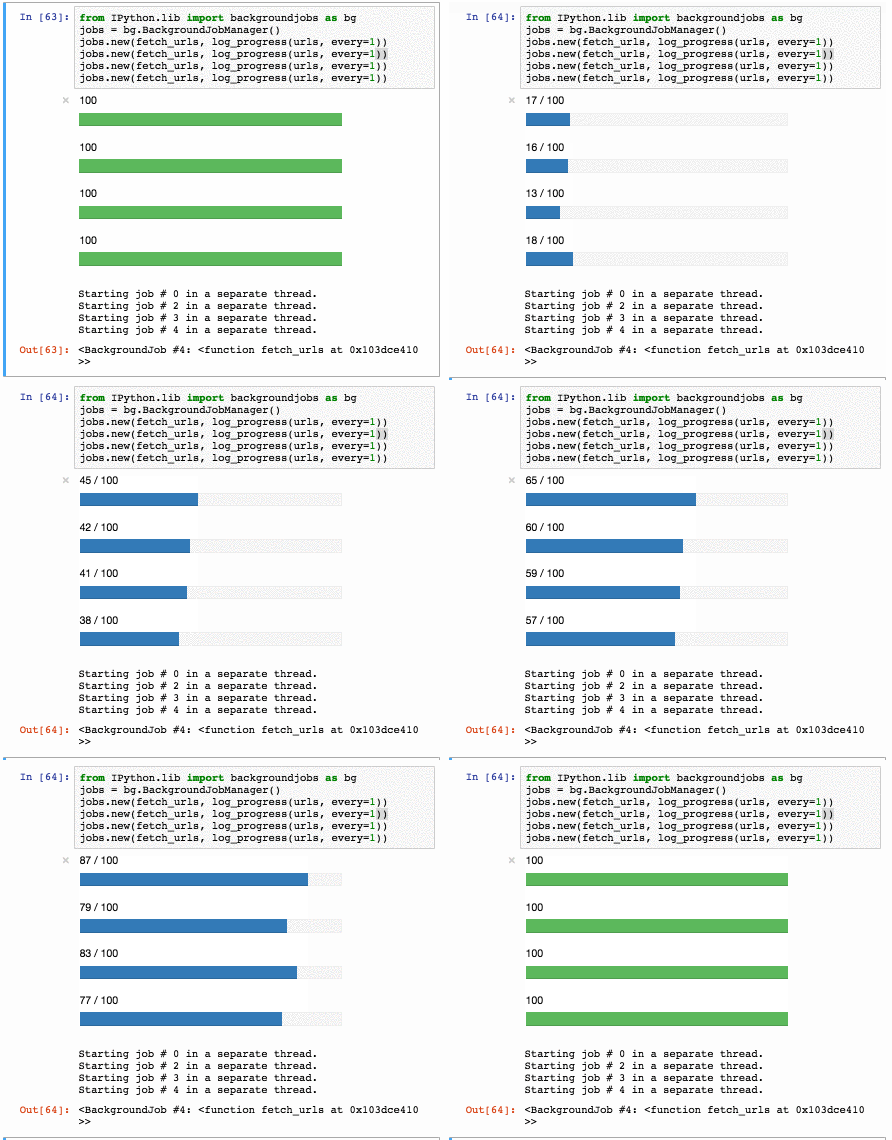
And they can even work from different threads:
In short, once again the link to the code github.com/alexanderkuk/log -progress .
def log_progress(sequence, every=10):
    for index, item in enumerate(sequence):
        if index % every == 0:
            print >>sys.stderr, index,
        yield item

This function is beautiful, for more than a year she wandered from task to task. But recently, I noticed an IntProgress widget in the standard Jupyter package and realized that it was time to change something:

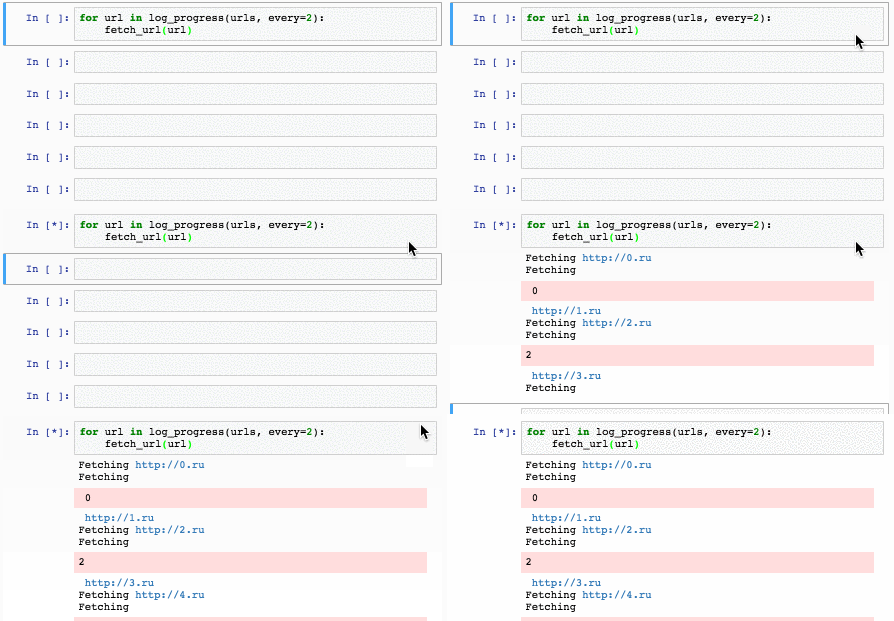
Logging in stderr has three small problems:
- It's not beautiful. Obviously.
- Sometimes it explodes the buffer.
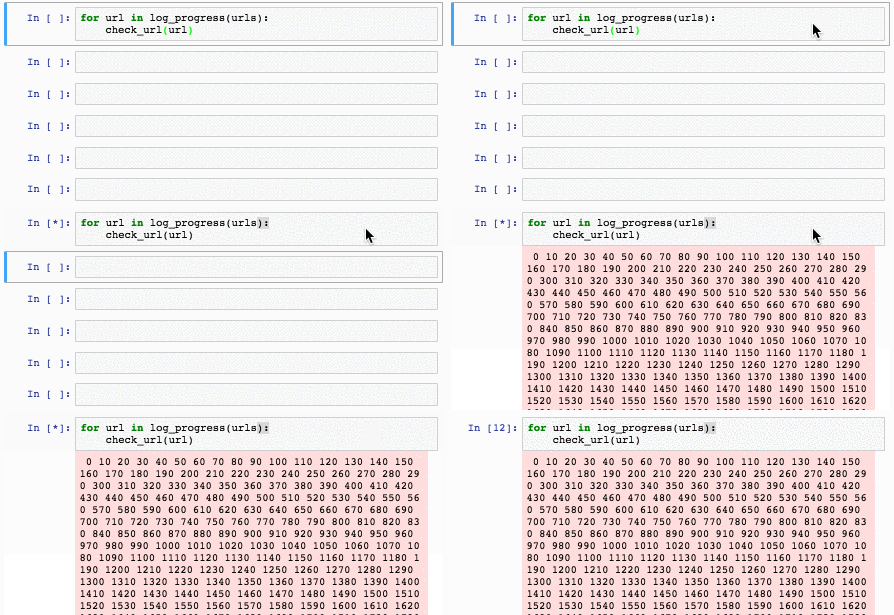
- Sometimes someone else writes to stderr or stdout.
Like many people who work with data, I am a fan of Jupyter. I spend most of my time there. Therefore, I can afford the following solution, incompatible with other environments:
def log_progress(sequence, every=10):
    from ipywidgets import IntProgress
    from IPython.display import display
    progress = IntProgress(min=0, max=len(sequence), value=0)
    display(progress)
    for index, record in enumerate(sequence):
        if index % every == 0:
            progress.value = index
        yield record

Everything is the same, only the counter is displayed not in stderr, but in a special widget. Very simple and convenient. For those who are also hooked on Jupyter, I posted a slightly improved version on github.com/alexanderkuk/log-progress on github . The module is distributed by copy-paste. Use on health.
The improved version displays, in addition to the strip, a counter. And it changes color depending on whether the operation completed successfully or not: It


supports iterators:

Naturally, there can be several progress of bars in one cell:


And they can even work from different threads:

In short, once again the link to the code github.com/alexanderkuk/log -progress .
