HP Software - a modern approach to building a monitoring system for IT and business services

HP software solutions allow you to see rare network problems, those network bugs that are fraught with consequences. We can see all the events where they can lead, what changes are caused, etc., - the program itself compares these events and shows weaknesses and problem areas of the network. Using these tools, we can see a network problem, even before it enters a critical phase.
About how HP Software analytics solution allows you to identify hidden network problems and business applications and much more, under the cut
Software solutions, like IT management, represent a wide range of products, which includes many interesting solutions for IT management automation, process automation, monitoring tasks, and data center management.
Today we will talk about solutions designed for monitoring: monitoring not only IT hardware, but also business services, which, in fact, interests business.
Now it’s no secret to anyone, many companies build their business based on IT. Managers are not much interested in what happens with a separate server, with a separate piece of hardware. First of all, I am interested in the quality of the services provided, customer satisfaction, and the ability to work business services at a high level and thus ensure the continuous operation of the company.
Accordingly, when our service deteriorates (it is one thing if it is an internal client or an internal user, it can tolerate a little), if it is a client of a bank, telecom, or no matter which company, when it encounters a poor service, what does it do? He goes to a competitor.
Thus, one of the main tasks of this kind of monitoring is to provide a flexible tool that will allow you to connect the events that occur in IT with the state of business services, the ability to predict problems, the ability to automate troubleshooting to restore the service as quickly and as efficiently as possible . Therefore, when we guarantee our customers and customers quality service, they continue to work with us, profits grow, we capture more and more of the market, and look beautiful compared to our competitors.
What does Hewlett-Packard offer to solve such problems? In general, HP has a fairly wide portfolio, HP has been engaged in monitoring solutions for more than 25 years, they started with network monitoring, Network Node Manager, maybe someone knows about it, then a number of interesting solutions were developed, some solutions got into HP due to their purchase from other companies that were leaders in a particular industry.
HP Software Solutions
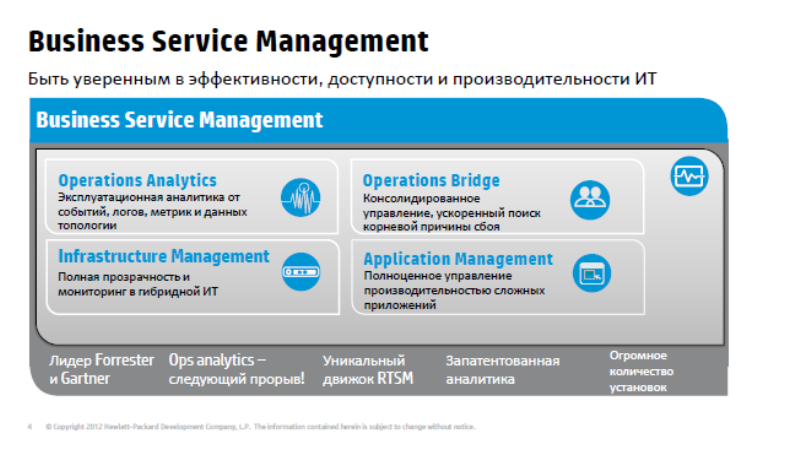
To summarize, we can divide the proposed solutions into 4 categories:
The first simplest and most understandable is infrastructure monitoring (infrastructure management), here we are talking about monitoring networks, servers, software, i.e. IT resources. In principle, many companies have already solved these problems with commercial or free means. For example, Nagios, Zabbix use Microsoft, so we will not stop here now.
We will talk more about such things as Application Performance Management - this is the ability to perform comprehensive monitoring of the availability of applications, and accordingly everything that is under it, monitoring from the point of view of the end user, the ability to diagnose problems that are inside the application.
Next, Operations Bridge - an unusual name, Umbrella, an umbrella monitoring system that allows you to combine monitoring data and a wide variety of available or new ones, and create a single console. A monitoring service is a console that provides a unified view of how services feel, calculates QPI, and all events and performance metrics are dumped there.
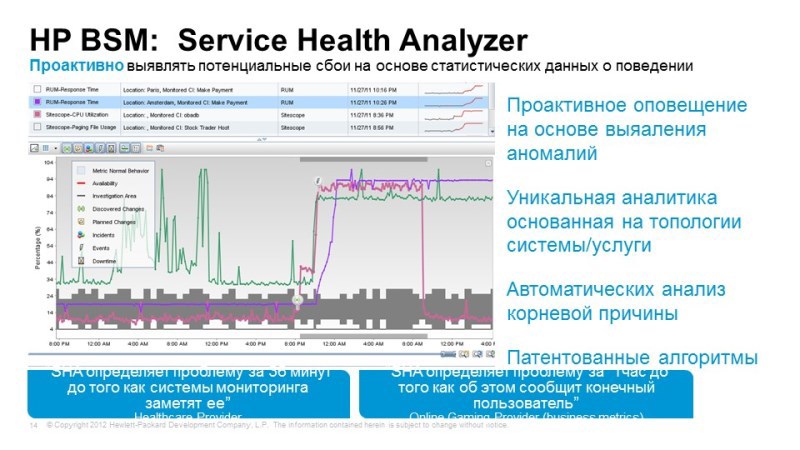
And Operations Analytics is HP’s latest development, which entered the market a little over a year ago, a solution that allows you to find little-known problems.
When we talk about traditional monitoring, we know what we want to measure, most often we know what the threshold value should be, i.e. we are looking for those things that we already know, those failures that are expected. For example, well-known events in the logs, we control the performance or service availability parameters that are important to us, for which we also set threshold values.
In fact, in the IT infrastructure of a large enterprise, there are many events that we can not control everything. When we say, for example, about telephone operators whose logs are growing in gigabytes per day, it is difficult to foresee all possible scenarios, Operations Analytics uses BigData processing methods, artificial intelligence methods to identify non-standard problems, to find those failures that are not It used to be non-standard solutions.
UCMDB platform
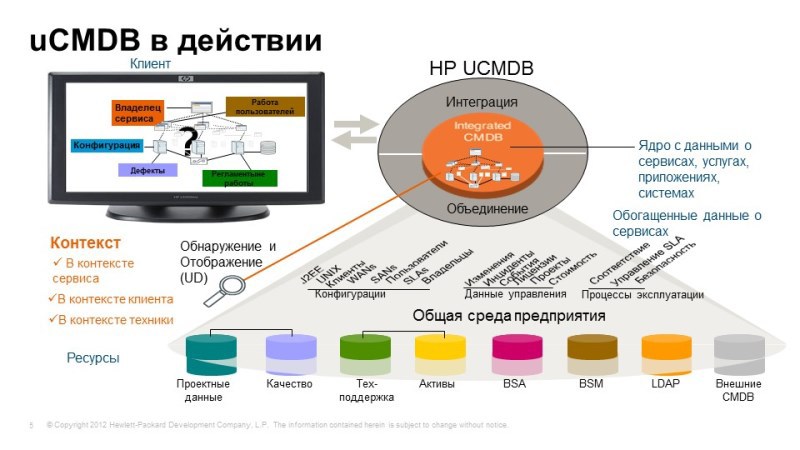
Before we move on to considering these products, we need to make a small digression, mention uCMDB - a universal configuration database, it is one of the key components not only for monitoring solutions, but also in other solutions for managing IT performance.
So, what is it like: this is a single configuration database that allows you to build service models by combining all components, relationships, mutual influences, i.e. create a single point of service: what it consists of. uCMDB is the link between monitoring solutions, if we are talking about monitoring, then on uCMDB, on a separate object, we can “hang up” the monitoring data and understand how a particular service “feels”, understand the relationship between components. When we build integration, for example, with a service desk, you have additional entities, for example, incidents, problems, we must “attach” them to the same objects, when we talk about asset management, financial elements can be associated with these elements components, contracts, agreements, the value of these assets, etc.
Thus, uCMDB is one of the important centers. And what’s important, we have the ability to fill uCMDB automatically, there is an excellent method of agentless discovery, agentless discovery of individual infrastructure components, connections between components, for example, we can connect to the database, look at the logs of who accessed it, and thus build up the relationships between the database and its clients. Or, for example, when we talk about standard applications: Active Diary, Microsoft Exchange, a built-in template, we already know what this service consists of, and it remains for us to discover these components and build all the necessary relationships. If there is some kind of non-standard service, internal development, we can create its model, and it will also be automatically discovered. Automatic discovery is still important from the point of view that,
For example, in monitoring tasks, one of the most important things that we solve with uCMDB is the correlation of events. Topology Based Event Correlation - when we receive a lot of events from various objects, we understand how infrastructure components affect services, so when we get a stream of events, we can determine which infrastructure events affect which services and identify the cause and effect of these events.
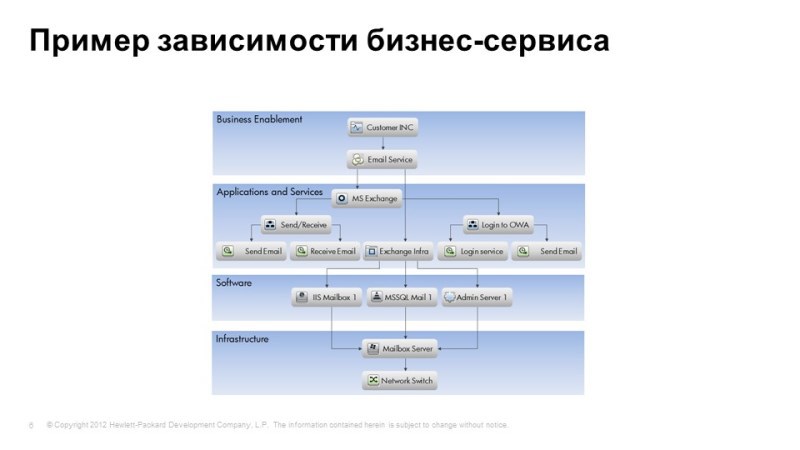
One of the representations of uCMDB: from infrastructure levels, applications to the level of business service.
Let’s now move on to a more substantive discussion of products, and start with the Application Performance Management group. These are those products that allow you to configure monitoring of services in general, to understand how well it works, whether it works, how quickly it responds, how quickly it performs certain functions.
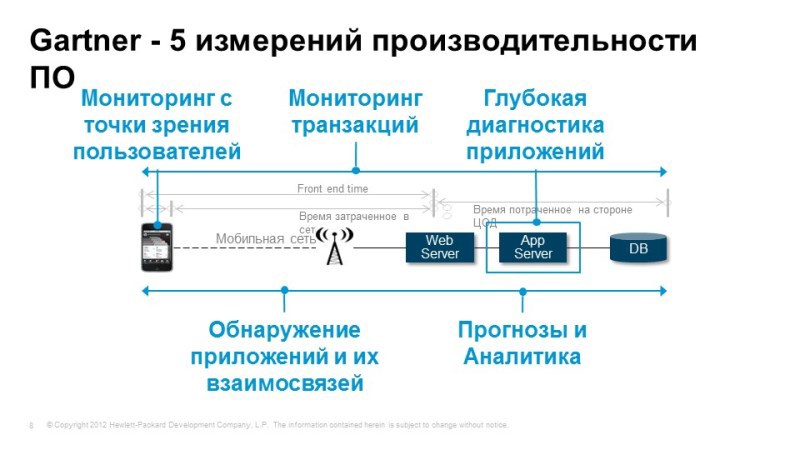
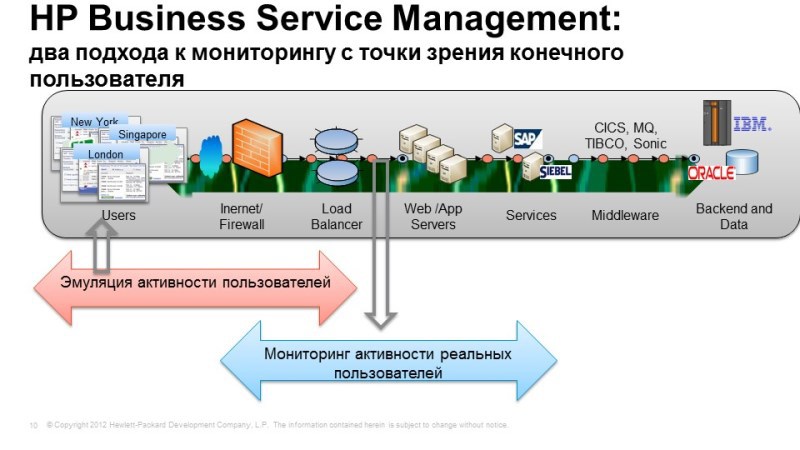
According to Gartner, these are the things that should be implemented to solve the tasks of monitoring application performance. First of all, we need to be able to monitor from the perspective of the end user. We need to understand whether the service is accessible to the user, how well it works, how fast it works and whether all the necessary functions work?
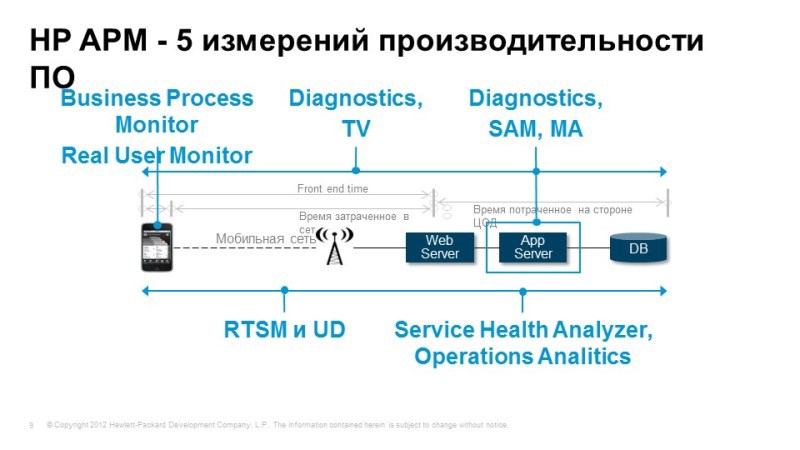
We should be able to track the progress of transactions when the user performs some action, for example, client-bank: checking the balance, the transaction is gone, we need to understand where it went, and what processes occur inside the application server, and if any Any difficulties, we can immediately understand where these difficulties arose. It may be problems with the application, there may be a problem with the network or database, etc.
If the problem arises with the application, we need to be able to perform in-depth diagnostics, to understand what is happening inside this application, where delays occur, where transaction losses occur. Again, we need to understand what the services are made up of: Discovery, automatic model building. And of course, it’s nice to have the ability to predict, perform analytical tasks in order to solve non-standard problems and understand what we expect in the future, how our service will behave tomorrow or in a week. All these tasks are perfectly solved with the help of Hewlett-Packard tools. The modules that cover these tasks are listed here. We will now consider them.
User monitoring

Let's start with monitoring from the perspective of the end user. This solution allows you to get the fastest result with little effort. Here we have two approaches, it is best, of course, to use them together, but possibly separately. The 1st option is an emulation of user actions when we, under the guise of a real person, are connected to the system, perform typical actions, and watch how they are worked out. The second option is monitoring the activity of real users, when we take, say, a traffic system containing transaction elements, as a rule, the data is taken from the switch that is closest to the application server. We copy traffic and configure its analysis and see user requests and see the application response so we monitor the availability of service applications for end users.
Let's see how it works. The 1st option is an emulation of user actions and activity. It uses the View Jam tool, perhaps a familiar one, to create emulated user actions. When we take, for example, a console, we tell View Jam that now we will be connecting to such applications with such a console using such protocols. It intercepts all our requests, all application responses, turns this data into a script. Then we parameterize it, suppose that it connects under different users or executes different types of requests. Then we use this script, we no longer need the application console, everything is emulated at the network level, we can arrange samples in any number of offices, inside our network, and even outside, and perform the specified actions from these samples with a given frequency. We select the necessary locations,
Thus, we see how our systems and services work at those points where they are most important. In principle, this mechanism is most optimal for calculating rip-offs, since here we compare the like with the like. We constantly measure the availability and performance of applications for transactions of the same type, so it’s easy to calculate a quality promise. This mechanism is very good for controlling the availability of the service, for example, during off-hours, when there are no real users, and we want to be sure that our service is still available, for example, a working day at the bank began, a person arrived, looked that all the necessary types of transactions are being worked out, you can easily go drinking coffee and not be afraid that users will start calling and something will work wrong with them.
Question: How many users can emulate as much as possible?
Unlimited how you set up. The same mechanism is used for load testing - weblearn scripts, we have the LoadRunner tool. If you need to make a load, you can use LoadRunner, and it will generate at least tens of thousands of simultaneous users, since this is all done at the network level, at the level of data exchange protocols, we do not need a console, this is a very easy solution. BPM (Business Process Monitor) is good because it’s easy to configure, it can be installed as a stand alone solution, quickly configure typical transactions and, even without monitoring the infrastructure components, can already understand how our services feel, for example, show the business the real condition and quality of work of our services.
It supports a huge number of protocols, databases, application servers, web interfaces, thick and thin clients, even for DOS applications you can use this kind of monitoring for very outdated ones. In Belarus, they piloted in one of the banks, they have an old application, it’s not a problem even to configure it.
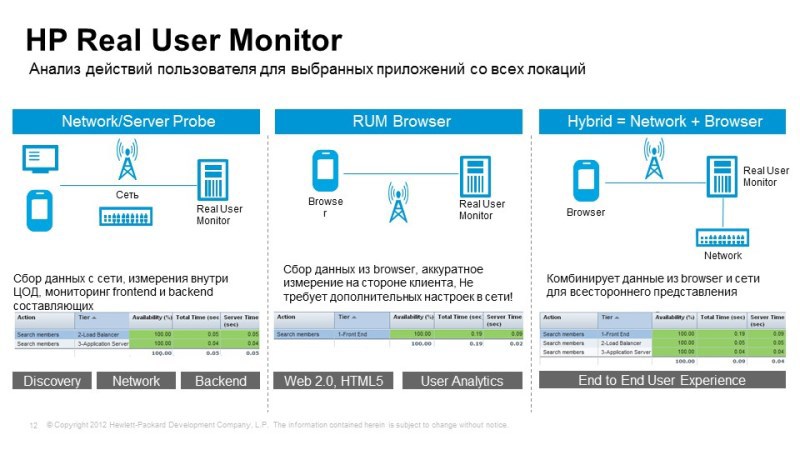
The second method that we talked about is monitoring real user actions, Real User Monitor, when we take the necessary network traffic from network traffic or from a browser, from the application server, it’s not so easy to configure here, because we need to work with parsing traffic, in order to identify elements of certain transactions, many things are done automatically, recently there was a pilot in one of the banks: they launched traffic into the room, set up automatic detection of different types of requests, and he immediately began to show that some requests are being processed quickly, while others are processed and a half minutes. Next is a deeper setting,
What is interesting here: here you can understand, for example, for which particular user is the problem? If we identify users in a request, we can see that a user has started to have problems, we can call him and tell him: “Hello, we know that you have a problem, we are working on it, don’t worry, everything will work in half an hour! ”
Even this level of service can be made with similar solutions. Here you can make snapshots of requests. When we see, for example, information about an error, some kind of malfunction, we can take a snapshot, and we can know what the user sees, he saw a specific error, and we don’t need to talk with him for a long time on the phone, find out what problem he has in fact, it arose before our eyes.
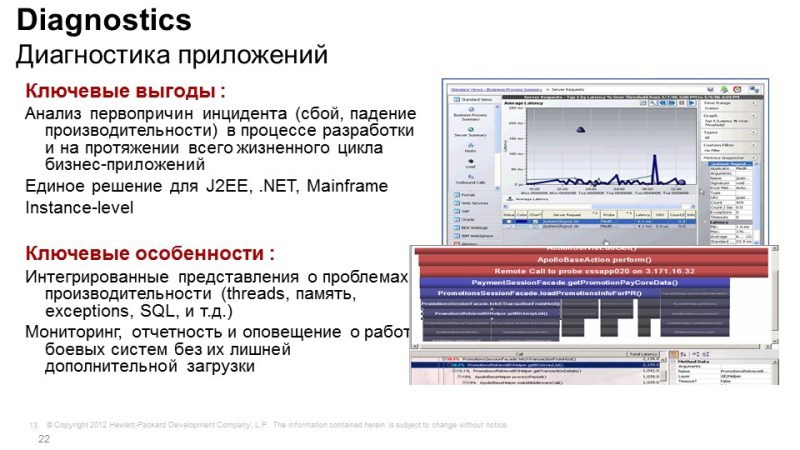
If the problems with the application’s work lie deep in the application itself, it’s not a network problem, not a server problem, but specifically the application’s work, then we need diagnostic tools, in fact, the solution is called HP Diagnostics - this is another module of the Business Service platform Management (BSM). Diagnostics understands Java applications, .NET applications, Python, knows how to work with various databases, and it is needed in order to look into the depths. For example, the web server is running, the application is running, the memory is walking, the processor is free, the disks, it seems, are also not heavily loaded, and the response is slow. The problem is inside, i.e. in the application itself.
By means of diagnostics, we can look inside and understand what exactly is happening: the transaction has gone, we understand what methods are used, what functions are used in this application, and we can understand how long it takes to process a particular request, we see external calls, database calls, we see memory leaks, we can point out where the problem lies, if it’s an internal development, if you work closely with the software vendor, you can show him a record to poke his finger and say: “Here you have a problem, solve yte ".
If it’s Oracle, we don’t dig that deep with Oracle, but we can also collect collector data from Oracle, the collector allows you to remove data in an agentless way and see what happens to the databases, that is, Oracle also connects perfectly.
Comparison of user work and network components
Another aspect that we have not mentioned is the influence of the network. If we want to control how the operation of the network, network equipment, the loading of the communication channel affects our services, we can use the Network Node Manager, it is also closely integrated into our platform, it allows us to understand how the channels are loaded, how the network works or the state of other equipment and even changing the configuration of this equipment affects the operation and accessibility of our services.
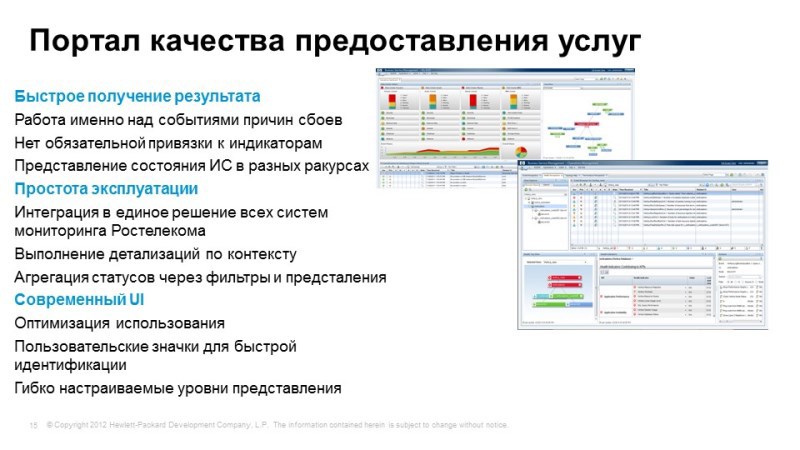
Thus, BSM (Business Service Manager) allows you to create a single consolidated view containing information about what services we use, how they feel, how individual components feel. This portal is well customizable, in principle, for each specific role, you can create one or more views. Users, of course, are limited to those services for which they are responsible and the tools that are available to them, even an ordinary user for himself, using a simple graphic designer, can sketch out a view that interests him. Or we can create for our users a number of representations that will be used to solve certain problems.
Operations bridge
The next topic we'll talk about is the Operations Bridge. Imagine that we have already solved the monitoring task in one way or another, we monitor the network, monitor the storage and data transfer systems, software, and do it all with different tools. HP is not HP - it doesn’t matter.
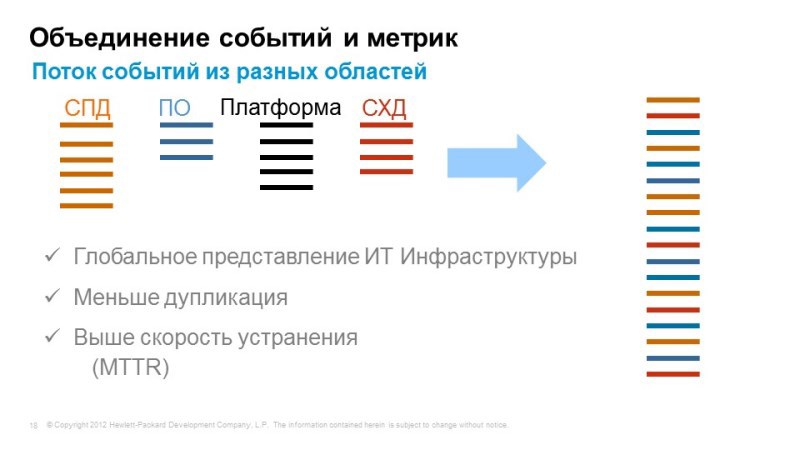
But we do not have a single console that shows the operation of all services in one window. In order to solve this problem, we propose using the Operations Bridge, which takes events, takes information about the topology of applications from a wide variety of systems, combines it all in a single console and allows you to correlate all these events in order to identify the causes and symptoms.
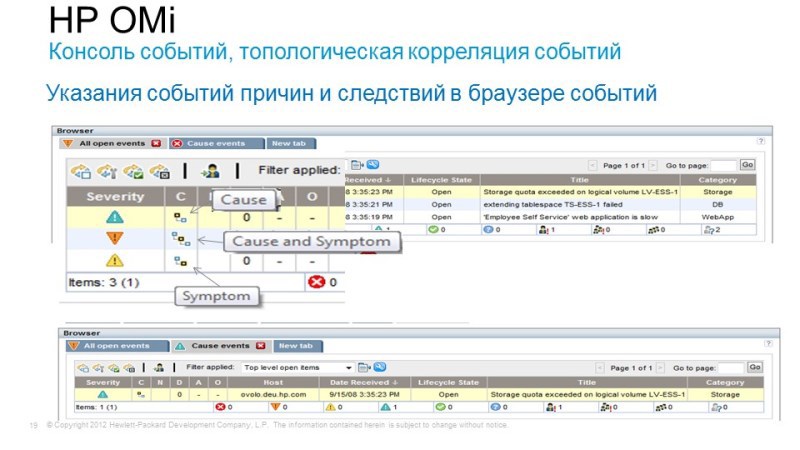
For example, a user goes to Internet banking, tries to perform some kind of transaction - he doesn’t succeed. It does not work because the database crashes, but crashes because it was not possible to expand disk space on disk arrays. Those. the problem that bothers us is the inaccessibility or poor-quality work of Internet banking, and the reason lies somewhere far away in the storage system. Operations Bridge just allows you to combine and correlate all these events using interesting correlation methods: firstly, it is the Topology Based Event Correlation, when we have a uCMDB service topology, and depending on which components a particular service is associated with, we can understand how these or other events affect its availability. Since the uCMDB model is dynamic, something has changed - changing the discovery, correlation rules are automatically rebuilt. And the second method is Stream Based Event Correlation, when according to the time of the occurrence of certain events, we can assume that they are interconnected, and also identify what is the cause and effect.
Thus, we can combine all the events in a single console, combine all the QPIs that interest us, and make this console a central monitoring system. When we already need more detailed information, we can delve into the system from which we obtained this monitoring data.

What else is interesting about Operations Bridge - automation of monitoring settings using the Monitoring Automation tool built into Operations Bridge. It allows, for example, to create typical monitoring settings for certain services.
For example, we added an Oracle database, we can automatically direct it, put it under monitoring using standard and standard templates. Or the service topology has changed, he moved to another platform, another hypervisor - to change the monitoring rules so that the system monitors exactly what is happening now, not what happened a week ago.
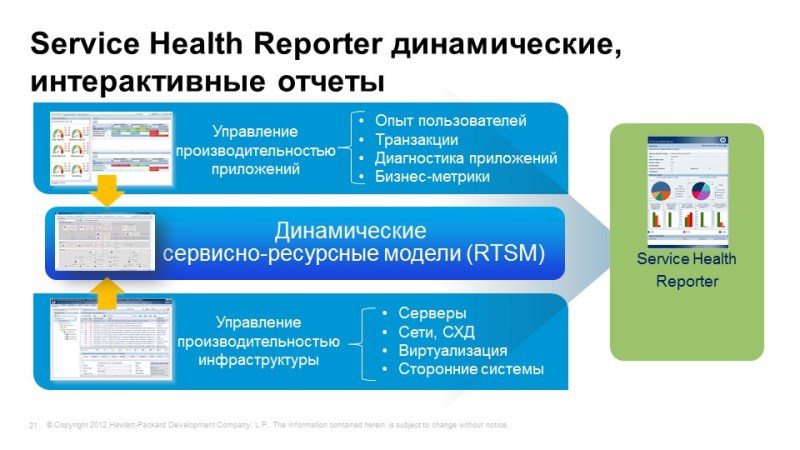
And, of course, reporting. Operations Bridge includes Service Health Reporter, which allows you to combine metrics from various systems and build consolidated reports, again, with reference to business services, to standby service models. Something has changed - reports, therefore, will also be automatically rebuilt. In the box a large number, about a thousand, of various reports, and accordingly, you can create your own.
Operations analytics

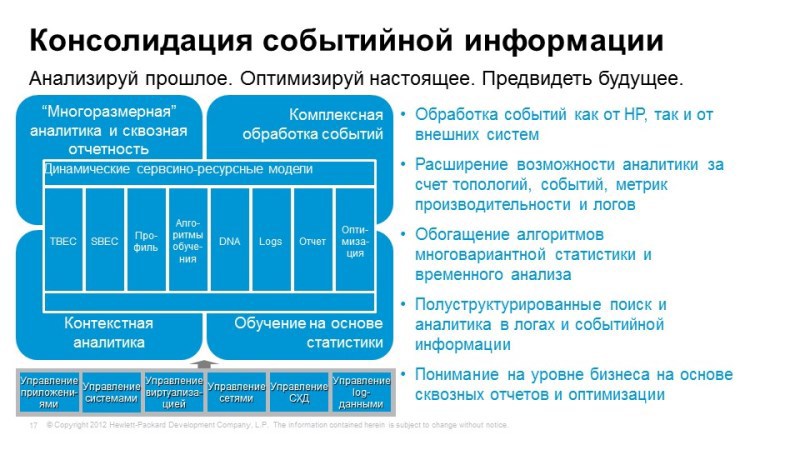
And the third thing they wanted to talk about: Operations Analytics. As I said, when we use traditional monitoring tools, we know that we want to monitor, there are much more events themselves than we can predict, on the gigabytes of logs that we have stored, or on a huge amount of performance data it would be nice to be able to to unite them all, we need an intelligent and clever means to work with all this information in order to identify non-standard situations. Operations Analytics uses BigData technology, for example, vertical is used as a database (have you heard about vertical?). We will tell in a nutshell.

What does Operations Analytics do? We direct all logs to it, all performance data. All this data is converted to a single format. Operations Analytics allows you to store all the logs, performance data and allows you to build a temporary correlation between events, allows you to look at how the service felt at any time.
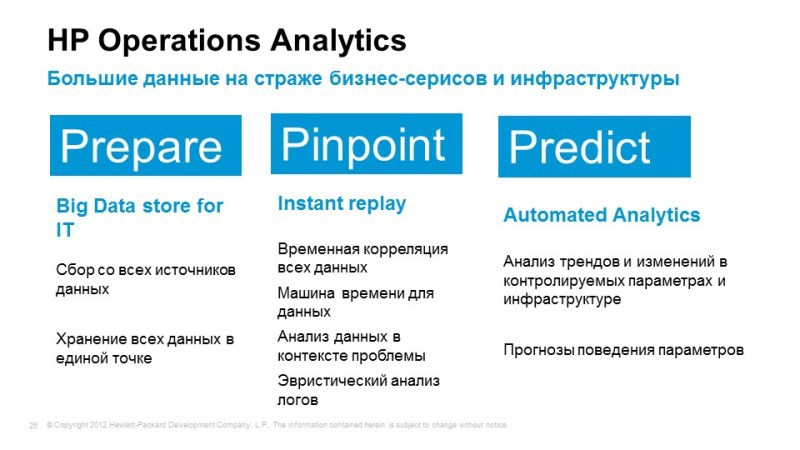
The mechanism of the time machine allows you to rewind at the moment when the failure occurred and see what events were happening at that moment, which, for example, were performance indicators, channel loadings, etc. and determine trends, make forecasts based on the state of our services.
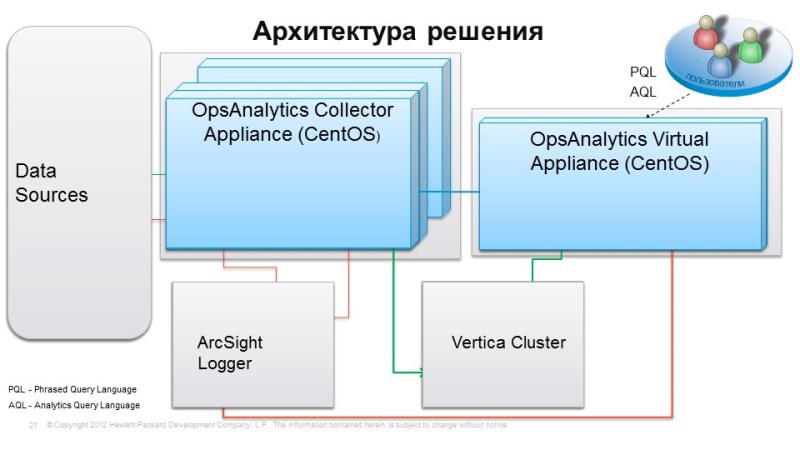
Architecture: Vertica
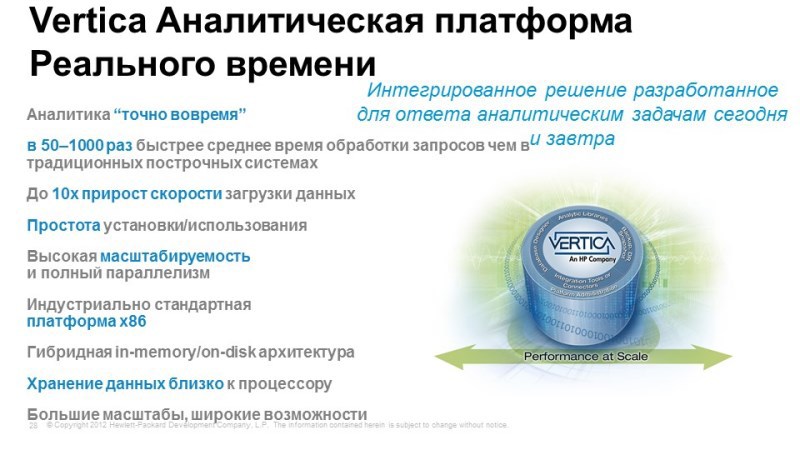
If you look at the architecture of the solution, it consists of the following things: Vertica is used for data storage - this is a database designed to work with big data, allows you to download a huge amount of information, and has tremendous scalability. Vertica is interesting in that it was created in order to work on cheap equipment, it works on x86 servers, stores data on internal disks and allows you to get an almost linear increase in performance when scaling. For example, we had 3 servers, we increased them to 6, productivity doubles, and so, in general, without restrictions. For example, Vertik uses Facebook with their colossal amounts of data,
For data collection, working with logs, we suggest using ArcSight Logger with OpsAnalytics. This decision comes from information security. ArcSight Logger is good because it already has a lot of connectors to a wide variety of systems, already knows how to collect a wide variety of logs from the very beginning and allows you to write connectors for those systems to which we do not have them. The analytical setup is built and there is a connection with data sources, i.e. This is an HP or non-HP monitoring system that allows you to load events, metrics, etc. Thus, we combine monitoring data in one system, combine logs from monitoring systems, and we can do interesting analysis using this tool. Simple, clear and very productive system.
Initially, Vertica is licensed by the amount of data loaded into it. No matter how many servers. Complete with OpsAnalytics Vertica for 4TB. If this volume is not enough, then you need to additionally purchase a license from Vertica.
When we talk about log monitoring by the same Conection Manager, a monitoring system agent that searches for specific events, log processing can be performed on the monitoring object itself. We periodically look at the log files when we see the desired event, send it to the system. And here it works differently. Here we take all the logs completely online and their analysis is already taking place on the side of OpsAnalytics. Those. there is a slightly different kind of load. If the monitoring system, the same BPM, will monitor transactions, then specific transaction information will go towards OpsAnalytics. In order to combine all this with information in the logs, and see what events in the logs could cause a failure or deterioration in the quality of the service.
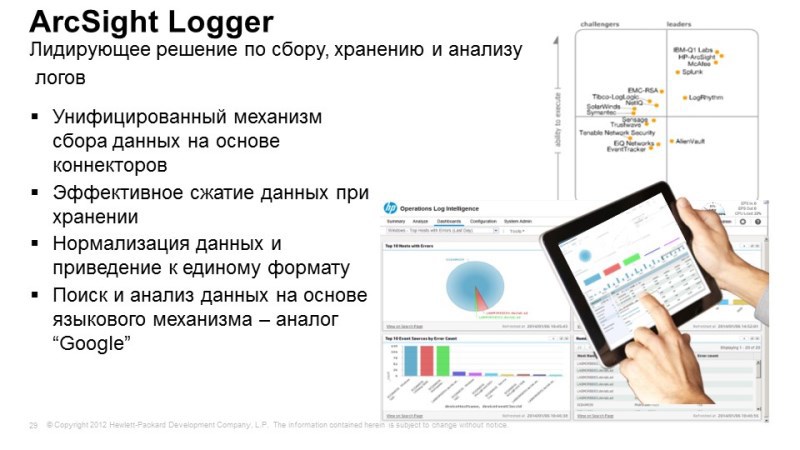
ArcSight Logger is a good choice from the point of view of collecting logs, since this solution has been on the market for many years, there are already a lot of connectors to various systems, there is a convenient tool for developing your connectors so that you do not reinvent the wheel twice, logs are used to data collection. If you need, you can use splank.

So what do we get? We get the opportunity to identify events in the logs that affect the operation and performance of our services. For example, we saw a deterioration in the service availability time, an automatic system allows you to identify those events in the logs that may be the reason for this. The system identifies new, non-standard events, provides a convenient tool for working with logs, i.e. contextual search, is a good search mechanism, when we type in individual elements, the search is similar to human language. It allows us to predict the behavior of our services depending on how these or those components behave, and allows, for example, combining IT monitoring data with “unauthorized” monitoring.

As one example, a bank in one of the European countries had a wide network, including in mountainous areas, and from time to time, they had incomprehensible deterioration in the work of their services in certain regions, they could not determine the reasons for their occurrence. Someone thought of screwing more weather data into the analytics, and revealed a strong relationship between the state of the environment, wind, precipitation and glitch. Accordingly, they found those places that suffered from bad weather.
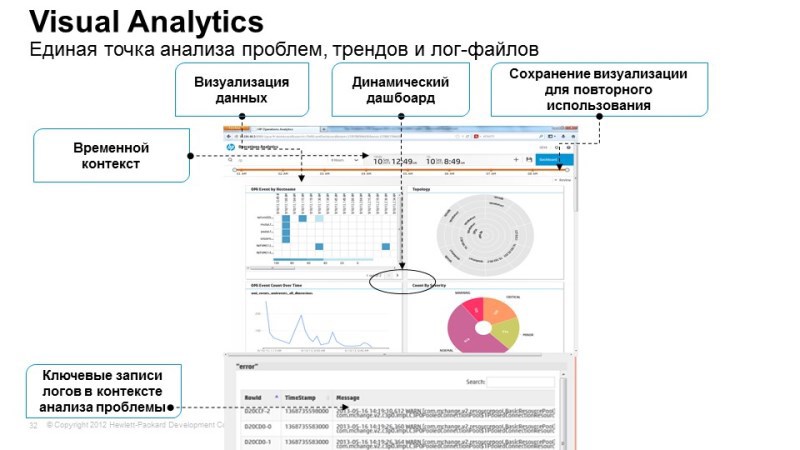
An interesting tool in analytics is a time machine. You see the temporary console at the top. The system allows you to rewind at any time on the time console, and below you will see how the service felt at a given time, what was the performance of its specific functions and what events occurred in the logs at that time that interests us. Thus, we can rewind virtually in real time, see how the state of services has changed, what events have occurred, how certain performance parameters have changed. All this data is stored in vertics and we get real-time data from it that interests us.
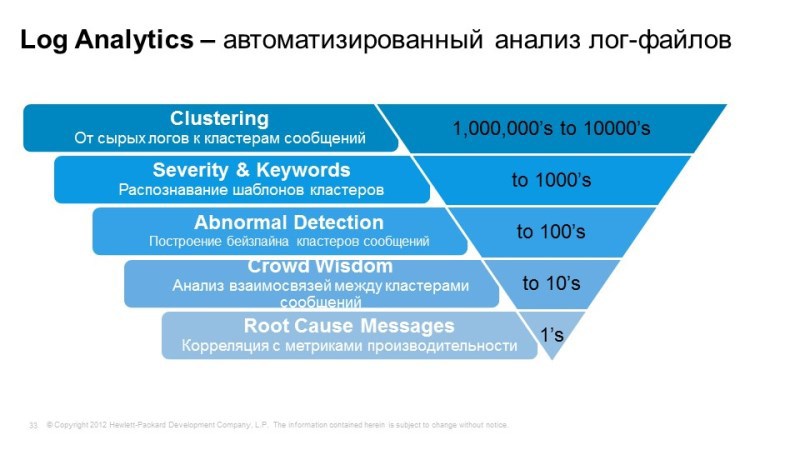
One of the main tasks is to work with a large number of logs and identify those events that are either the causes or potential causes of the failure. We uploaded gigabytes of logs there, and on the output we have only a few events that the system considered potentially important or potentially important for the service.
A small demo (from the report)
The operator received information on certain transactions, we have an abnormally large response time. A console has opened where the response time is displayed, respectively, red is traditionally bad. The general status of the service and metrics for a particular component, for example, Application Performance Overtime, and financial metrics that are not directly related to IT.
Such a flashback allows you to control playback, and we can control playback, rewind to the past, see how these indicators have changed, how the response time of transactions has changed, and how the service and information on other metrics felt. We found a moment when everything worked well, from that moment it became bad, paused, rewound, and we can see the effect of system resources on this failure, as well as log events, while, of course, not all events are displayed, but only those that the system considered important. Out of 93 thousand event logs, we have 20 that could potentially influence the appearance of this problem. We look at this log, see this event, we can click ok so that next time this event is specifically searched for.
The problem was in the wrong configuration of the loggia. This operator guessed by the type of error. We can add Transaction Performance Overtime information to the financial metrics that are tracked here in order to identify the relationship. and invites us to correlate these events. Here, they loaded him with several metrics and offers to correlate. Here we see the connection between the indicators. A very visible connection is observed between Application Transaction Response Time and the number of individual users, the number of user connections.
In general, we see that the configuration of the weblogic affects certain indicators.
We returned again to the current position, now on offers to click on Predict and see how we expect developments.
This is a configured dashboard for monitoring Advent Rebanking - online banking, data is taken from there. Initially, this is a pre-configured dashboard, we sketched those metrics that we are following, and those objects that are of interest to us.
We look at atypical events, if something began to appear atypically, non-standardly, then this is potentially interesting to us. If error is written, it is also certainly interesting.
Report recording
Distribution of HP solutions in Ukraine , Georgia , Tajikistan , CIS countries .
Training courses on HP technologies in Kiev (UT MUK)
MUK-Service - all types of IT repair: warranty, non-warranty repair, sale of spare parts, contract service