Icinga2 and agentless monitoring of Windows servers using WMI

Today, not everyone is satisfied with the used IT infrastructure monitoring system, and some simply do not have it. Many of them have obvious problems with usability, configuration complexity, and poor performance. That is why, I suggest taking a look at the new fork of Nagios - Icinga 2, which is ready to please us with its modular architecture, user-friendly web-interface, report generation and excellent speed!
About the system itself
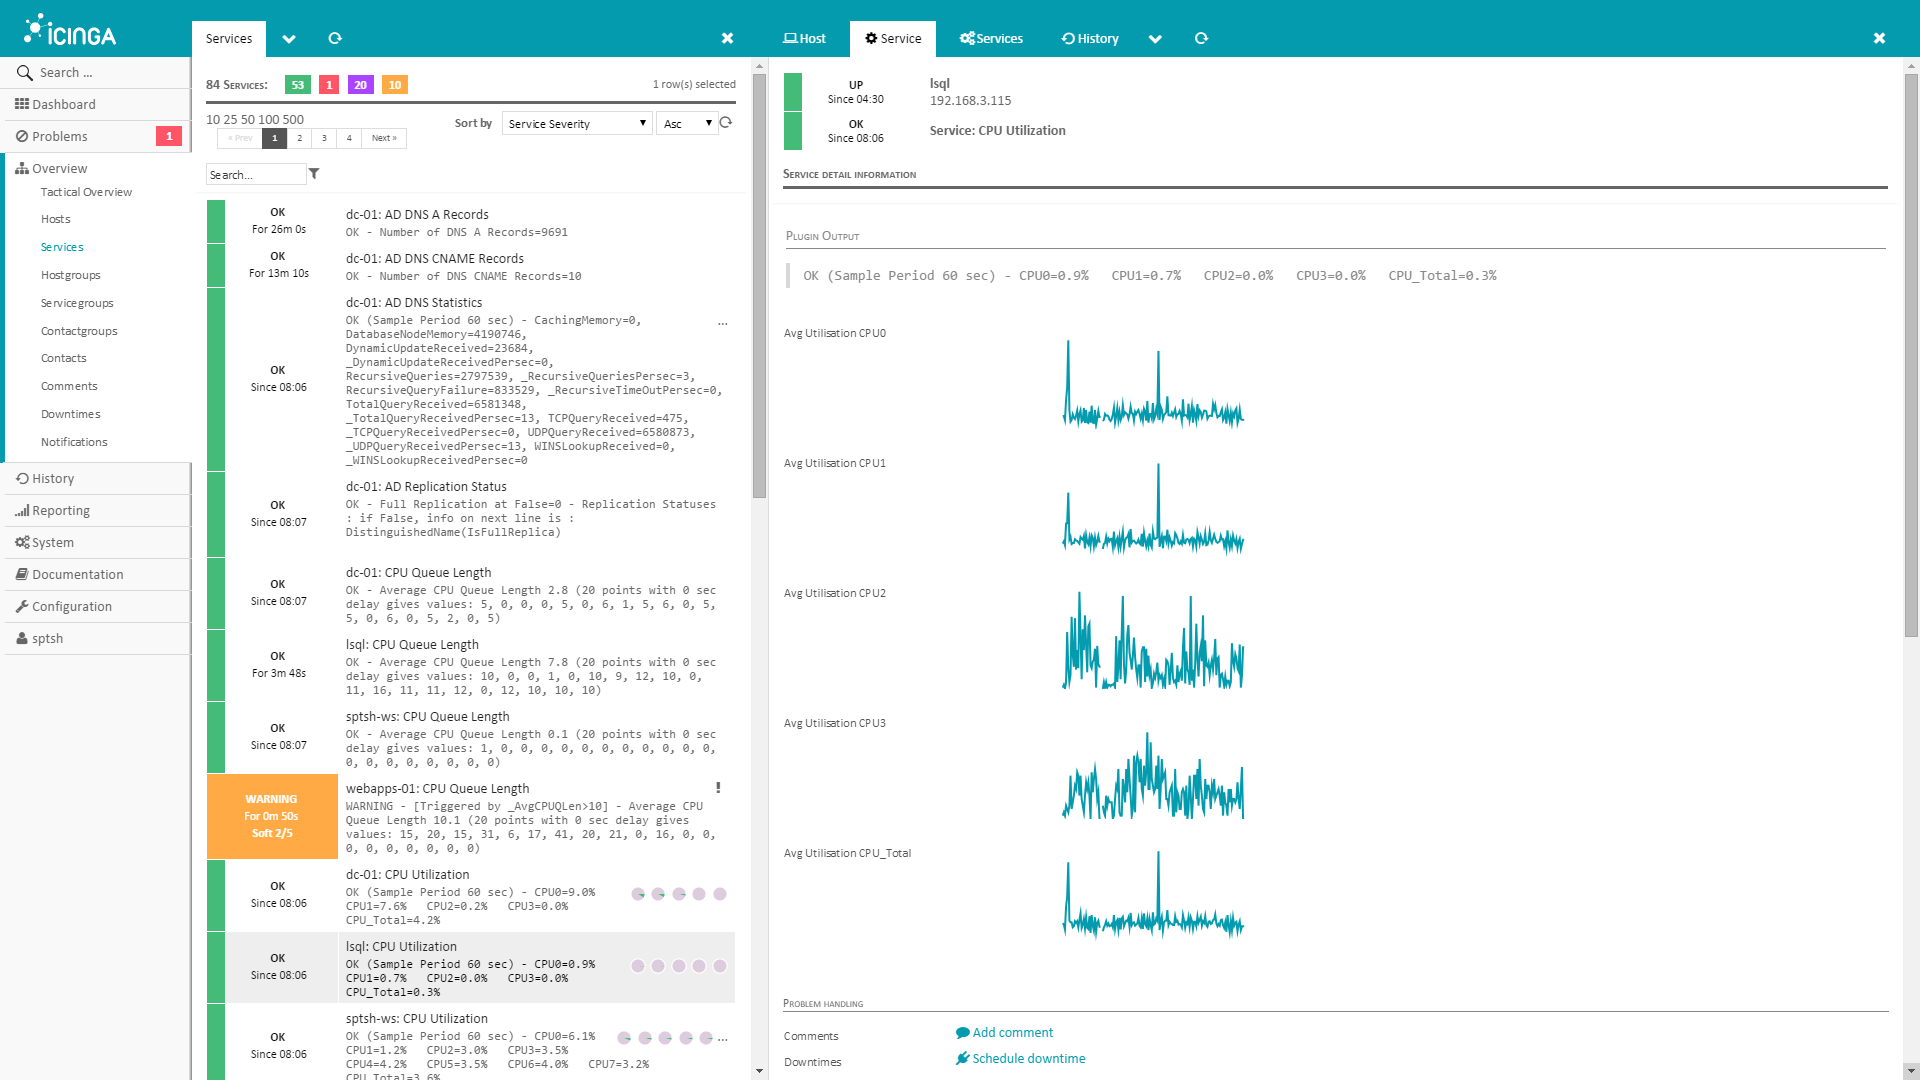
At first glance, Icinga 2 immediately has a nice-looking web interface with a large number of different representations of hosts and services (various lists, calendar, grid), but this is not all the advantages of this monitoring system.
The configuration style is different from its previous version, it has an object-oriented format (similar to Puppet) and allows you to define host / service dependencies and parent / child relationships for hosts. Dependencies in Icinga 2 are direct, they can be defined as host-host, service-service, or mixed host-service and service-host. The volume of configuration can be minimized by applying templates to objects. During the operation of the system, you will understand how convenient it is. Personally, I was always dissatisfied with the lack of the ability to configure monitoring via the web interface, in view of the intricacies of the configuration files, but in this case I’m glad about it.
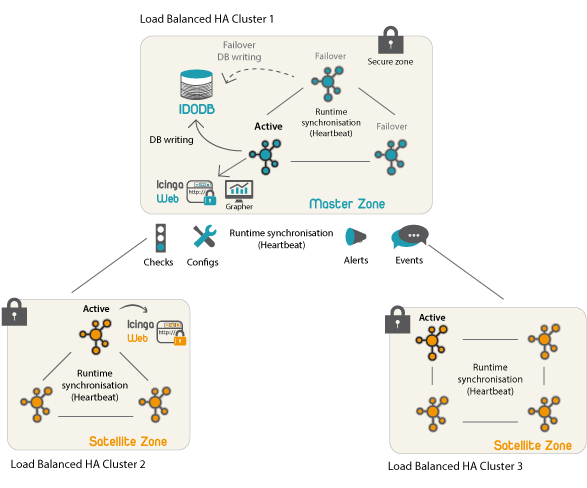
Icinga2 is built with a performance focus in mind, has a multi-threaded design and can perform thousands of checks per second. The system itself can be installed as a highly accessible cluster or a single instance.
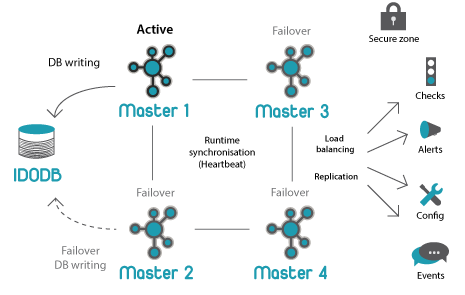
Highly accessible clusters can also be combined into a distributed installation, in which operations are dispersed across several sites. Replication can be isolated for its implementation only between the primary and secondary zones. Secondary zones can be either full-fledged instances of Icinga 2, with a local IDO database and user interface, or simple instances that perform checks.
Icinga 2 comes with several engines and almost any add-on can be easily integrated, in particular, the Perfdata module is included initially. For example, Icinga 2 offers the integration of popular graphical performance mapping tools such as PNP4Nagios, inGraph, and Graphite.
Customization
There is no point in considering the installation of Icinga 2 itself, since it is simple and extremely clearly described in the documentation , in my case it is installed on CentOS 7 and PostgreSQL. First, don't forget to install EPEL:
yum install epel-releaseAlso, when you configure it through the web interface, you must use two databases, not one (otherwise, a user creation error will occur).
For full monitoring using WMI, we need several plugins and a prepared Windows Server.
First, install wmic and Check WMI Plus using the walkthrough located here .
Next, you will need to prepare Windows Server for processing incoming WMI requests, for this we enter at the command line:
winrm quickconfigThe user on behalf of whom we will connect to the server must be in the group of local administrators, and also do not forget about the firewall.
To check, run two times:
/opt/nagios/bin/plugins/check_wmi_plus.pl -m checkcpu -H HOST -u USER -p PASS
Now let's move on to the configuration of Icinga 2.
The main configuration files are located in /etc/icinga2/conf.d/ We will
prepare a group for our Windows servers by adding the following to the groups.conf file:
object HostGroup "windows-servers" {
  display_name = "Windows Servers"
  assign where host.vars.os == "Windows"
}
All hosts in the configuration of which an element is present will fall into this group:
host.vars.os = "Windows"
We describe the use of the Check WMI Plus plugin, for this, open commands.conf and add the following contents:
object CheckCommand "check_wmi" {
  import "plugin-check-command"
  command = [ WmiPluginDir + "/check_wmi_plus.pl" ]
  arguments = {
    "--inidir" = "$wmi_inidir$"
    "-H" = "$host.name$"
    "-A" = "$wmi_authfile_path$"
    "-m" = "$check_mode$"
    "-s" = "$wmi_submode$"
    "-a" = "$wmi_arg1$"
    "-o" = "$wmi_arg2$"
    "-3" = "$wmi_arg3$"
    "-4" = "$wmi_arg4$"
    "-y" = "$wmi_delay$"
    "-w" = "$wmi_warn$"
    "-c" = "$wmi_crit$"
    "--nodatamode" = {
      set_if = "$wmi_nodatamode$"
    }
  }
  vars.wmi_authfile_path = "/etc/icinga2/wmi.auth"
  vars.wmi_inidir = "/opt/nagios/bin/plugins/check_wmi_plus.d"
  vars.wmi_nodatamode = false
}
Create an authorization file for the plugin ( /etc/icinga2/wmi.auth ) with the following contents:
username=user@domain.domain
password=pass
domain=
Set the value of the constant in the constants.conf file :
const WmiPluginDir = "/opt/nagios/bin/plugins"Create a template for our services in templates.conf :
template Service "wmi-service" {
  import "generic-service"
  check_command = "check_wmi"
  check_interval = 1m
  retry_interval = 1m
}
Here you can set the desired inspection interval.
On the plugin page there are examples of service configurations for Nagios, but we just have to edit them a bit.
For example, add the following service to the services.conf file :
apply Service "MSSQL: General Statistics" {
  import "wmi-service"
  vars.check_mode = "checksql"
  vars.wmi_submode = "general"
  vars.wmi_arg1 = host.vars.sql
  assign where host.vars.sql
  ignore where host.vars.disable_wmi
}
Add the host to the hosts.conf file :
object Host "sql" {
  address = "X.X.X.X"
  check_command = "hostalive"
  vars.os = "Windows"
  vars.sql = "MSSQL***_MSSQL***"
}
#    *** - название экземпляра SQL сервера
In this example, the “MSSQL: General Statistics” service will be applied to the host with the vars.sql variable set in the configuration , and its value will be used in the WMI request as an argument.
It remains only to make a graphical representation of the data collected, for this we need Graphite and its web module for our Icinga 2.
Install Graphite:
yum install graphite-web graphite-web-selinux
/usr/bin/graphite-manage syncdb --noinput
/usr/bin/graphite-build-index
/usr/bin/chown -R apache:apache /var/lib/graphite-web
yum install python-carbon python-whisper
systemctl enable carbon-cache
systemctl start carbon-cache
systemctl restart httpd
We edit apache settings for vhost at our discretion.
Turn on the use of Graphite in Icinga 2:
icinga2 feature enable graphite
systemctl restart icinga2
Download the web module from here . Unpack it into the / usr / share / icingaweb2 / modules folder and rename the module root folder to graphite (otherwise an error will occur). We create the configuration file /etc/icingaweb2/modules/graphite/config.ini with the following contents:
[graphite]
metric_prefix = icinga
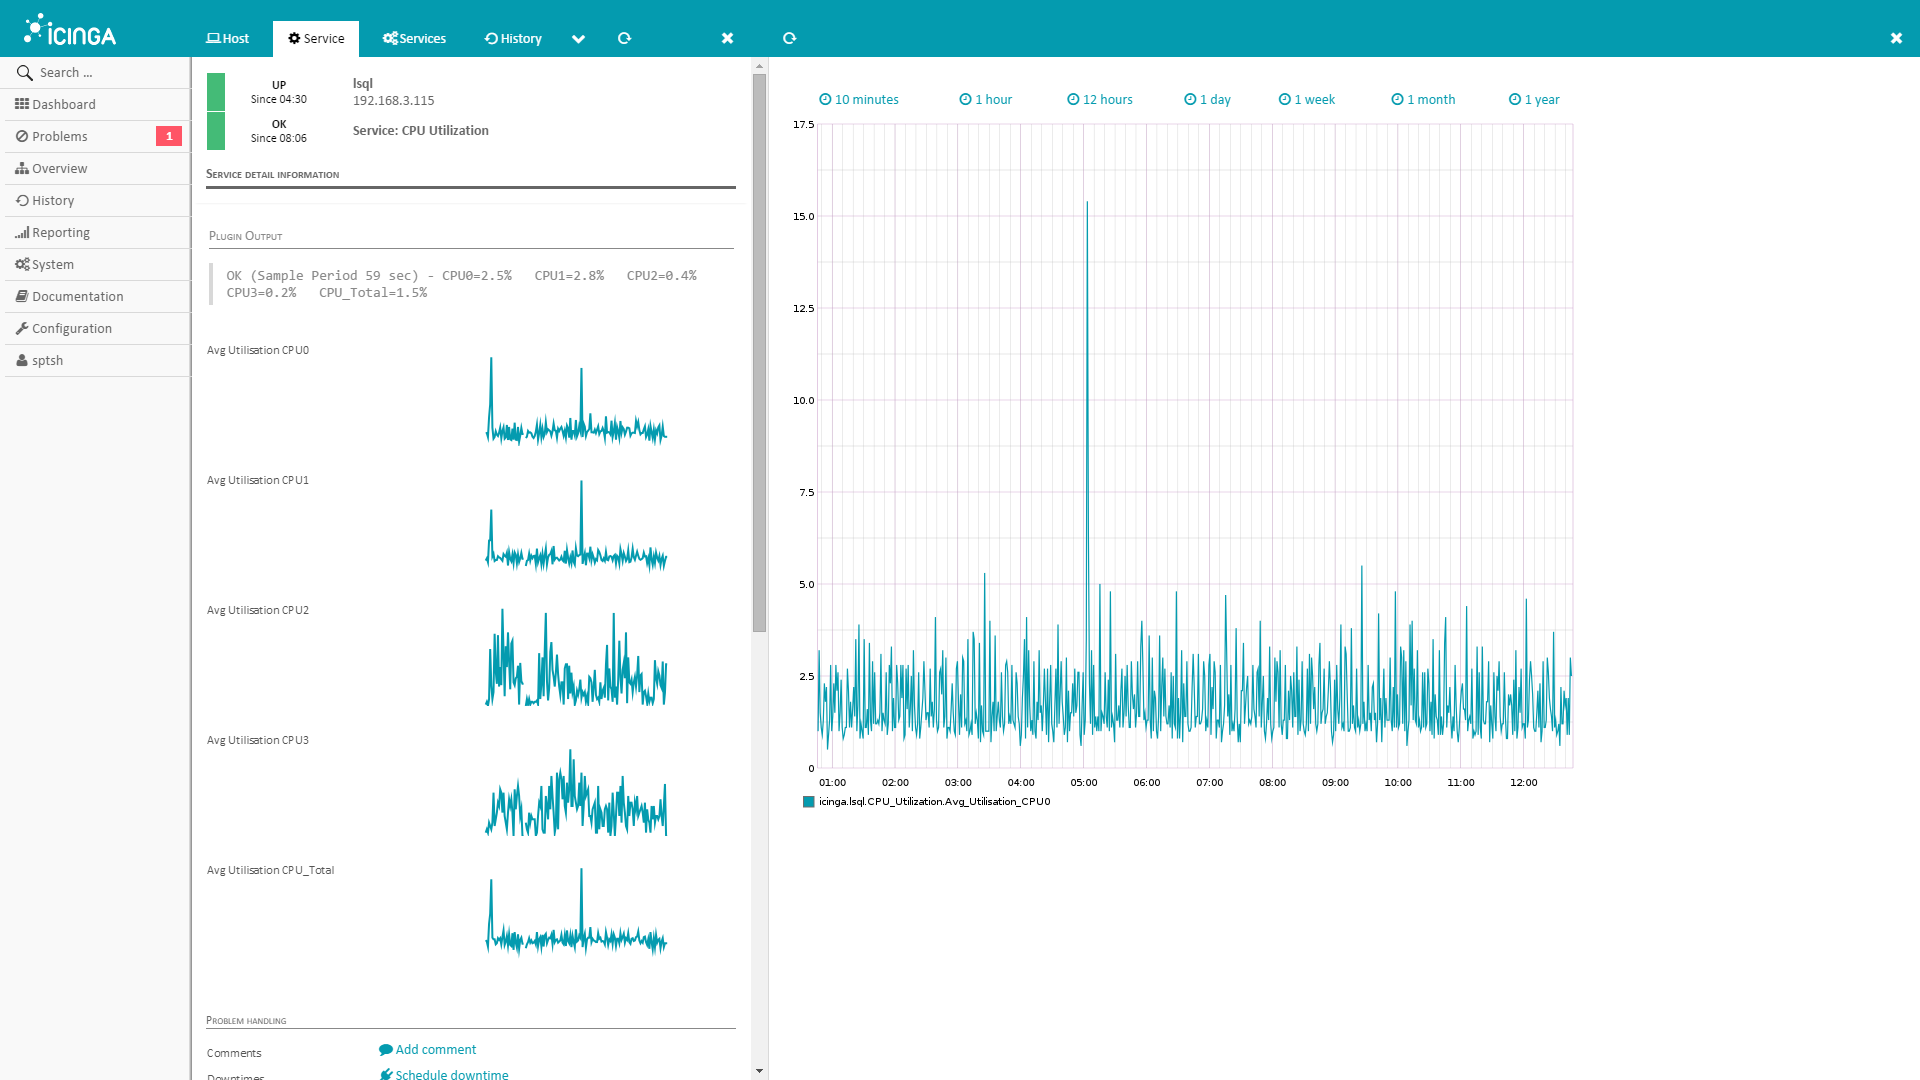
base_url = http://172.18.200.15/render? Now, it remains to turn on the web module (Configuration -> Modules -> graphite -> enable) and enjoy the result:
PS: In the next part, we will consider monitoring network equipment.