Iron will not fail. How I prepare dozens of servers a day for a fight
Check one server is not a problem. You take the check-list and check it in order: processor, memory, disks. But with a hundred servers, this method is unlikely to work well. To eliminate the human factor, to make checks more reliable and fast, it is necessary to automate the process. Who knows how to do this better than a hosting provider. Artem Artemiev at HighLoad ++ Siberia told us which methods can be used, which is better to run with hands, and which is great at automating. Further, the text version of the report with tips that anyone who works with iron and needs to regularly check its performance will be able to repeat.

About the speaker: Artyom Artemyev ( artemirk ), technical director in a large hosting provider FirstVDS, he himself works with iron.
FirstVDS has two data centers. The first one is our own, we built our own building ourselves, brought and installed our own racks, serve ourselves, worry about the current and cooling of the data center. The second data center is a large room in a large data center that was rented, everything is easier with it, but it also exists. In total, it is 60 racks and about 3000 iron servers. There was something to practice and test different approaches, which means that we are waiting for almost confirmed recommendations. Let's start to view or read the report.
About 6-7 years ago, we realized that simply putting an operating system on a server is not enough. The OS is worth it, the server is alert and ready for battle. We launch it on production - strange reboot and hangup begin. It is not clear what to do - the process is underway; it is hard, expensive, painful to transfer the entire working draft to a new piece of iron. Where to run?
Modern deployment methods allow you to avoid this and transport the server in 5 seconds, but our clients (especially 6 years ago) did not fly in the clouds, walked on the ground and used ordinary pieces of iron.

In this article I will tell you which methods we tried, which ones we got accustomed to, which ones weren't taken root, which ones we run well with our hands, and how to automate all this. I will give you advice and you can repeat it in your company if you work with iron and you have such a need.
What is the problem?
In theory, checking the server is not a problem. Initially, we had a process, as in the picture below. A man sits down, takes a check-list, checks: processor, memory, disks, wrinkles forehead, makes a decision.

Then 3 servers were installed per month. But, when servers become more and more, this person starts crying and complaining that he is dying at work. A person is increasingly mistaken because verification has become a routine.
We made the decision: we automate! And the person will do more useful things.
Small tour
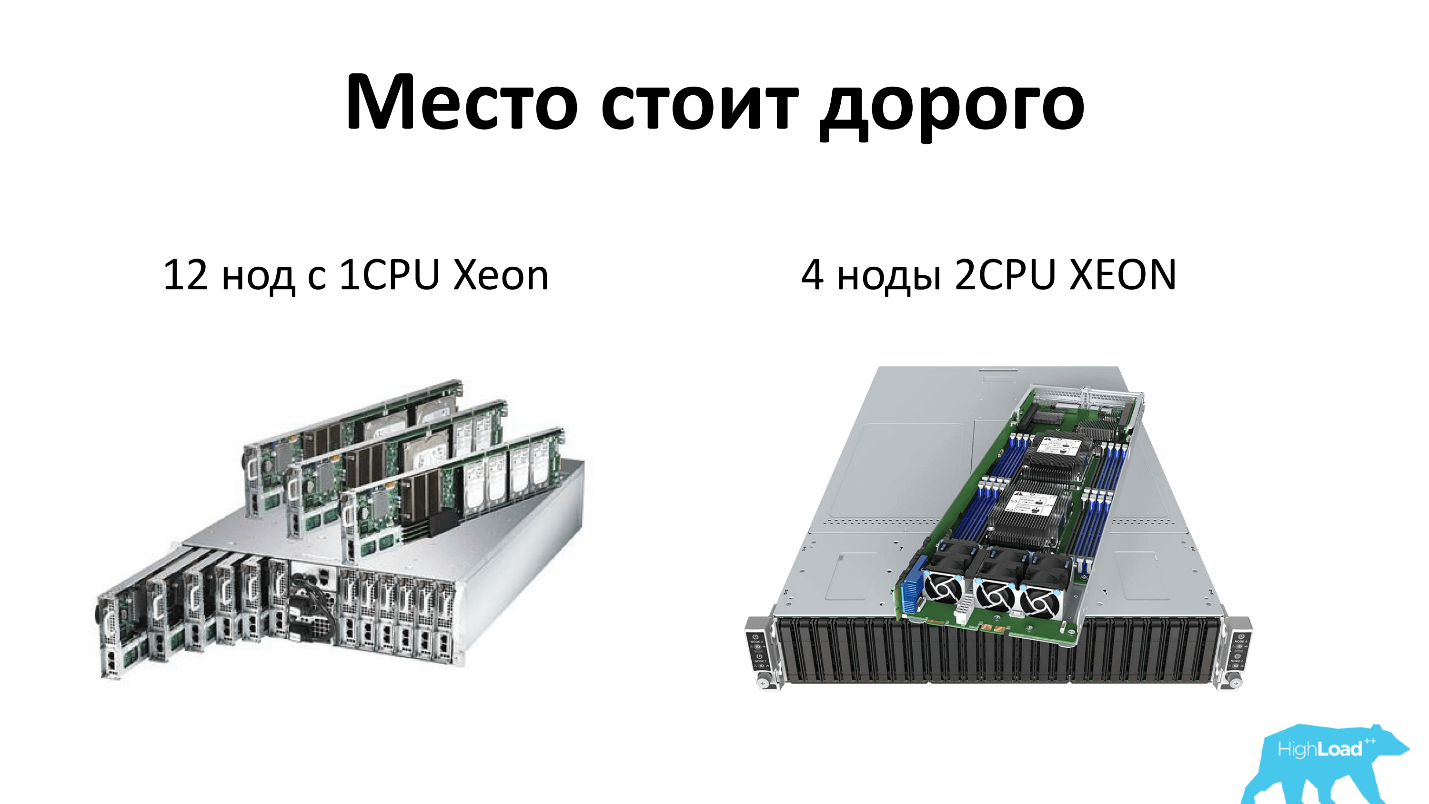
I will clarify what I mean when I talk about the server today. We, like everyone, save space in racks and use high-density servers. Today it is 2 units, which can fit either 12 nodes of single-processor servers, or 4 nodes of dual-processor servers. That is, each server gets 4 disks - everything is fair. Plus, there are two power supplies in the rack, that is, everything is reserved and everyone likes it.
Where does iron come from?
Iron to our data center is brought by our suppliers - as a rule, these are Supermicro and Intel. In the data center, our guys-operators, install servers in an empty space in the rack and connect two wiring, network and power. It is also the responsibility of operators to configure the BIOS in the server. That is, connect the keyboard, monitor and configure two parameters:

After that, the operator opens the accounting panel of iron servers, in which you need to fix the fact of server installation, for which it is indicated:
After that, the network port, where the operator has installed the new server, for the purpose of security, goes to a special quarantine VLAN, on which also hangs DHCP, Pxe, TFtp. Next, our favorite Linux, which has all the necessary utilities, is loaded on the server, and the diagnostic process is launched.
Since the server still has the first boot device over the network, for the servers that go to production, the port switches to another VLAN. There is no DHCP in the other VLAN, and we are not afraid that we unintentionally reinstall our production server. For this we have a separate VLAN.
It so happens that the server was installed, everything is fine, but it never loaded into the diagnostic system. This happens, as a rule, due to the fact that during a VLAN switching delay, not all network switches quickly switch VLANs, etc.

Then the operator receives the task to restart the server by hand. Previously, there was no IPMI, we put remote outlets and fixed which port the server was in, pulled the outlet over the network, and the server rebooted.
But managed outlets also do not always work well, so now we manage server power over IPMI. But when the server is new, IPMI is not configured, it can be rebooted only by going up and pressing a button. Therefore, a person is sitting, waiting - the lamp is lit - runs and presses the button. Such is his job.
If after that the server does not boot, then it is entered into a special list for repair. This list includes servers on which diagnostics did not start, or its results were not satisfactory. An individual person - who loves iron - sits every day and makes out — assembles, looks, why does not work.
CPU
Everything is fine, the server has started, we are starting to test. We first test the processor as one of the most important elements.

The first impulse was to use the application from the vendor. We have almost all Intel processors - went to the site, downloaded the Intel Processor Diagnostic Tool - everything is fine, it shows a lot of interesting information, including the operating time of the server in hours and the power consumption schedule.
But the problem is that Intel PTD works under Windows, which we no longer liked. To run a check in it, you just need to move the mouse, press the “START” button, and the check will begin. The result is displayed on the screen, but it is not possible to export it anywhere. This does not suit us, because the process is not automated.
Let's go read the forums and find the two easiest ways.
We give servers in production, users come back and say that the processor is unstable. Checked - the processor is unstable. They began to investigate, took the server, which passes the checks, but falls in battle, enabled debug in the Linux kernel, collected Core dump. Before rebooting, the server resets everything in memory before a crash.
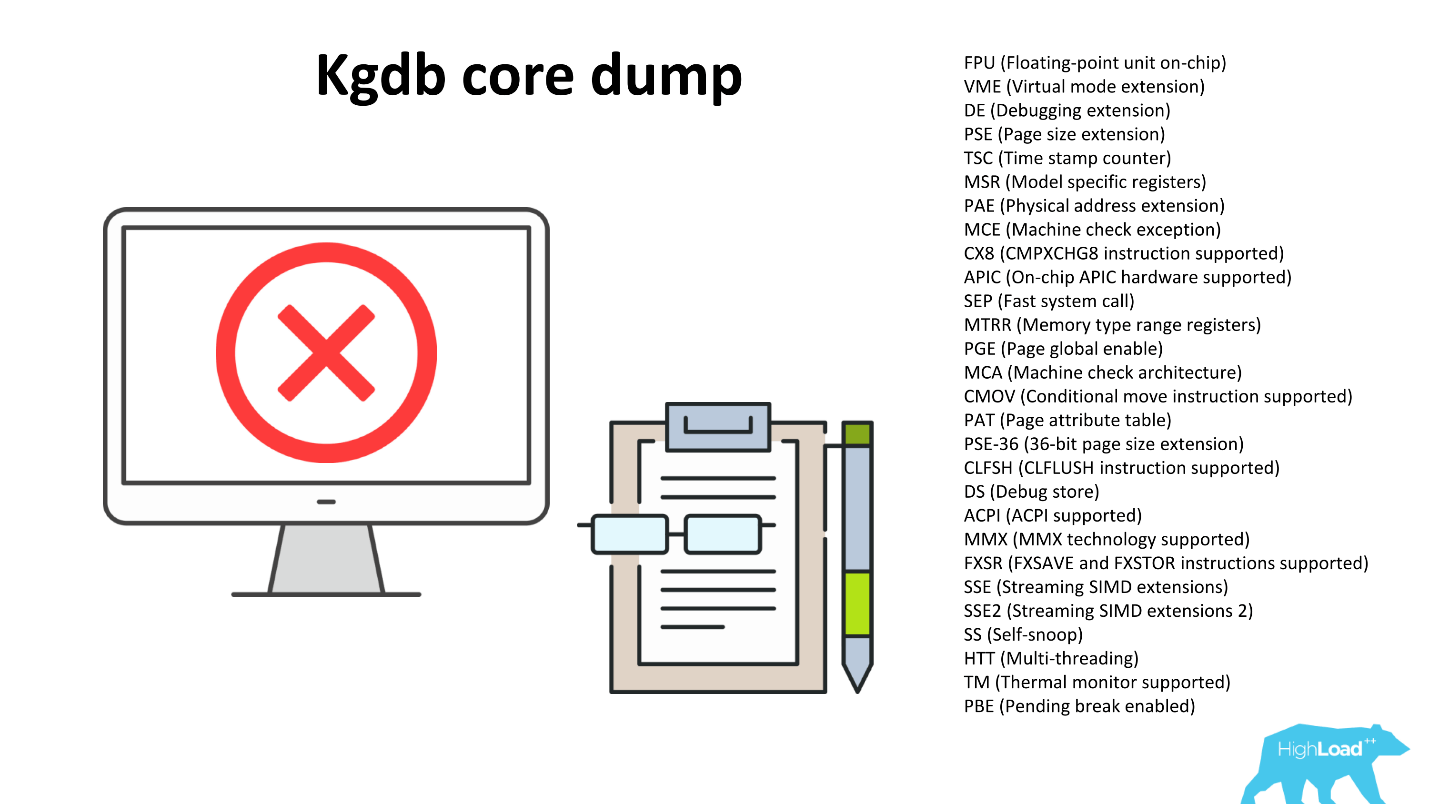
Processors incorporate various optimizations for frequent operations. We can see the flags reflecting what optimizations the processor supports, for example, optimizing the work with floating-point numbers, optimizing multimedia, etc. But our / bin / stress, and the perpetual loop just burn through the processor in one operation and do not use additional features. An investigation revealed that the CPU crashes when trying to use the functionality of one of the built-in flags.
The first impulse was to leave / bin / stress - let the processor warm. Then in the cycle we will run through all the flags, jerk them. While thinking how to implement it, what commands to call to call the functions of each flag, read the forums.
On the overclockers forum, they stumbled upon an interesting project for finding primes Great Internet Mersenne Prime Search . Scientists have made a distributed network to which everyone can connect and help find a prime number. Scientists do not believe anyone, so the program works very cunningly: first you start it, it calculates the primes that it already knows, and compares the result with what it knows. If the result does not match, then the processor is working incorrectly. We really liked this property: for any nonsense, it is prone to falling.
In addition, the goal of the project is to find as many primes as possible, so the program is constantly optimized for the properties of new processors, as a result, it tugs a lot of flags.
Mprime has no time limit, if left unchecked, it works forever. We run it for 30 minutes.
After the work is completed, we check that there are no errors in result.txt, and we look at the kernel logs, in particular, we look for errors in the / proc / kmsg file.
Another tour

On January 3, 2018, the 50th Mersenne prime number was found (2 p -1). This number is only 23 million digits. It can be downloaded to view - this is a 12 MB zip archive .
Why do we need prime numbers? First, any RSA encryption uses prime numbers. The more primes we know, the more secure your SSH key is. Secondly, scientists test their hypotheses and mathematical theorems, and we are not against helping scientists - it costs us nothing. It turns out a win-win story.
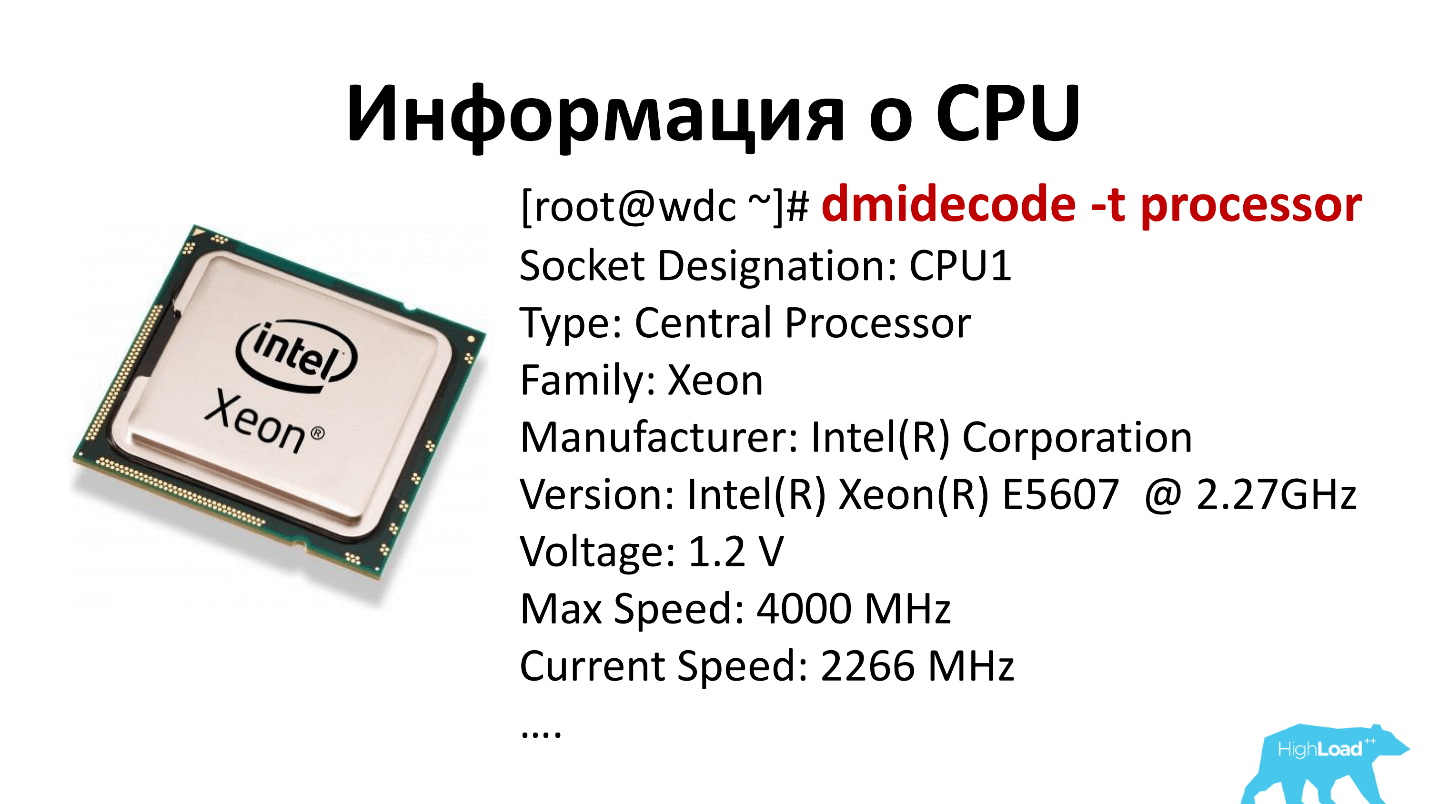
So, the processor is working, everything is fine. It remains to find out what kind of processor. We use the dmidecode -t processor and see all the slots that are in the motherboard, and what processors are in these slots. This information enters our accounting system, we will interpret it later.
Catch
Thus, surprisingly, you can find broken legs. / bin / stress and the eternal cycle worked, and Mprime fell. They drove for a long time, searched, discovered - the result on the picture below - everything is clear.
Such a processor simply did not start. The operator was very strong, took the wrong processor - but could deliver.

Another wonderful case. The black row in the photo below is the fans, the arrow shows how the air is blowing. See: the radiator stands across the stream. Of course, everything is overheated and turned off.
Memory
Memory is pretty simple. These are cells in which we write information, and after a while we read it again. If the same thing we recorded remains there, then this cell is healthy.

Everyone knows a good, straightforwardly classic, Memtest86 + program , which runs from any medium, over a network or even from a floppy disk. It is designed to check as many memory cells as possible. Any busy cells can no longer be checked. Therefore, memtest86 + has a minimum size so as not to occupy memory. Unfortunately, memtest86 + displays its statistics only on the screen . We tried to expand it somehow, but it all came up against the fact that there is not even a network stack inside the program. To expand it, you would have to bring the Linux kernel and everything else with you.
There is a paid version of this program, which already knows how to dump information to disk. But on our servers there is not always a disk, and there is not always a file system on these disks. A network drive, as we have already found out, cannot be connected.
We began to dig further and found a similar program Memtester . This program works from the OS level of Linux. Its biggest disadvantage is that the OS itself and Memtester occupy some memory cells, and these cells will not be checked.
Memtester is started with the command: memtester `cat / proc / meminfo | grep MemFree | awk '{print $ 2-1024}' `k 5
Here we transfer the amount of free memory minus 1 MB. This is done because otherwise Memtester takes up all the memory, and the down killer kills it. We drive this test for 5 cycles, at the output we have a tablet with either OK or fail.
The final result is saved and further analyzed for failures.
To understand the scale of the problem - our smallest server has 32 GB of memory, our Linux image with Memtester takes 60 MB, we do not check 2% of memory . But according to statistics for the last 6 years, there was no such thing that a memory got frankly in production. This is a compromise to which we agree, and which is dear to us to correct - and we live with it.
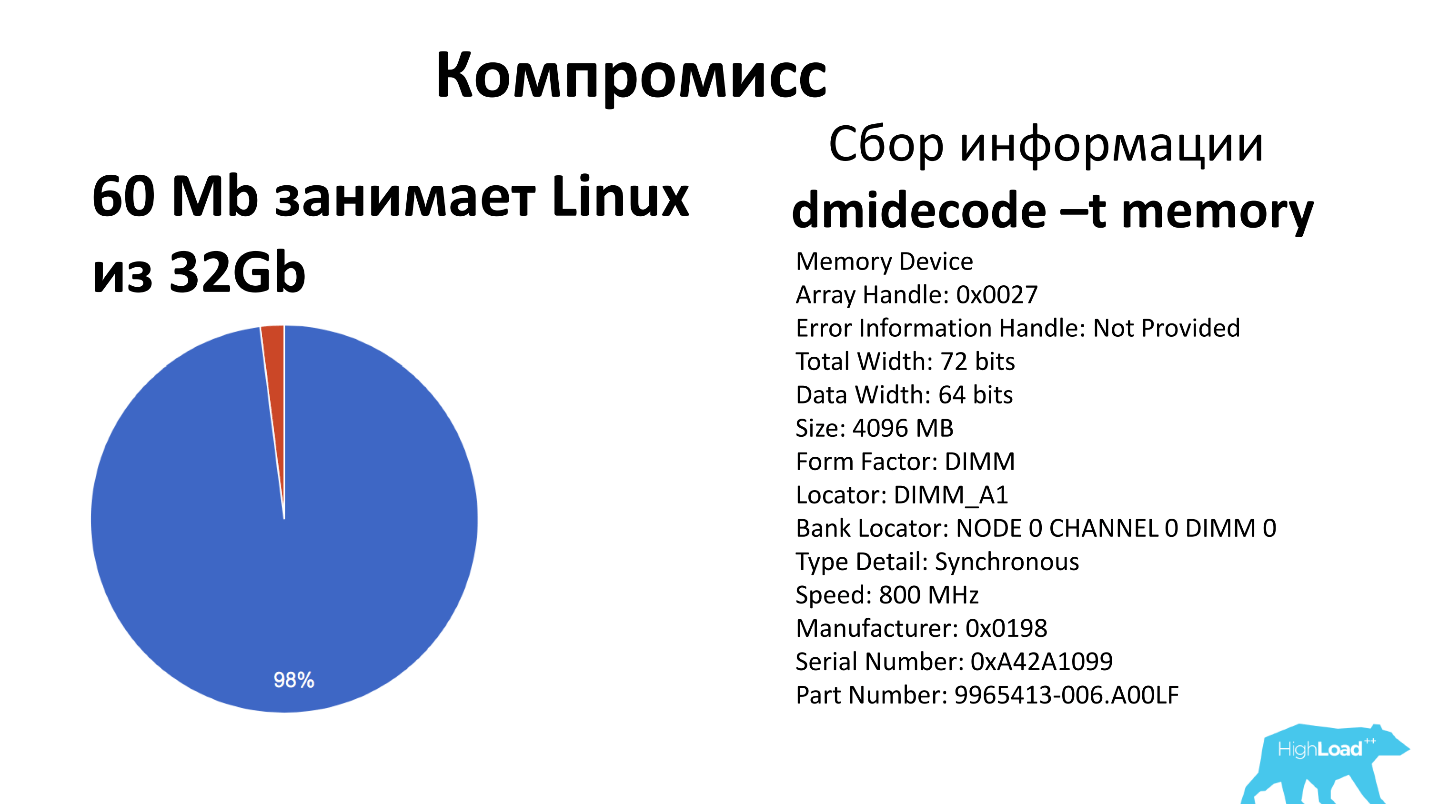
Along the way, we also collect dmidecode -t memory, which gives all the memory banks that we have on the motherboard (usually up to 24 pieces), and which dies are in each bank. This information is useful if we want to upgrade the server - we will know where to add what, how many slats to take and which server to go to.
Storage devices
6 years ago, all the discs were with pancakes that were spinning. A separate story was to collect just a list of all disks. There were several different approaches, because I could not believe that you can just watch ls / dev / sd. But in the end we stopped to watch ls / dev / sd * and ls / dev / cciss / c0d *. In the first case, this is a SATA device, in the second - SCSI and SAS.
Literally this year, they started selling nvme-disks and added the nvme list here.
After the list of disks is compiled, we try to read 0 bytes from it in order to understand that this is a block device and everything is fine. If we could not read it, then we consider that this is some kind of a ghost, and we never have such a disk and never did.
The first approach to checking disks was obvious: “Let's write random data on the disk and see the speed” -
But users began to return again and say that the disks are bad. It turned out that the insidious physics was joking with us again.
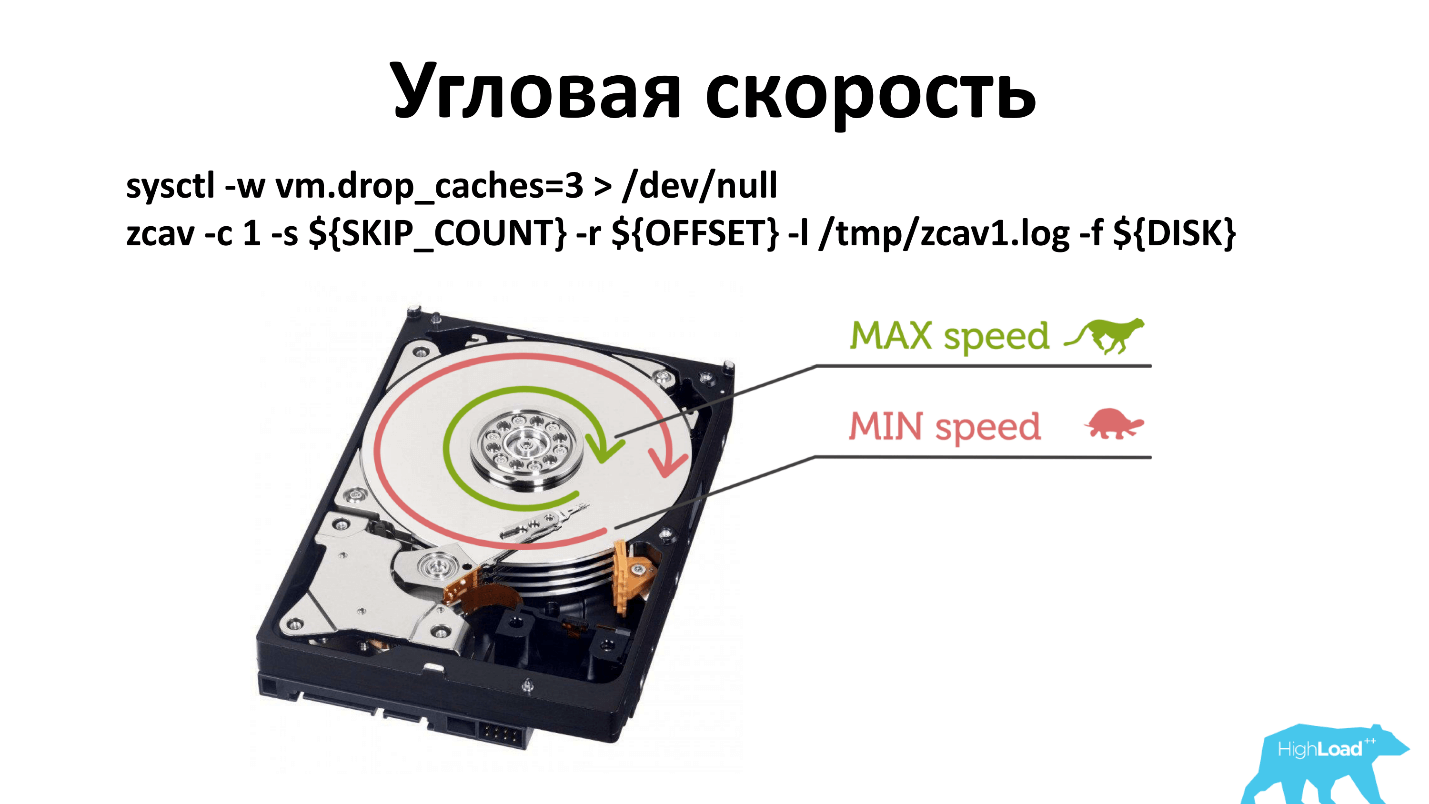
There is an angular velocity, and, as a rule, when you run -dd, it writes near the spindle. If for some reason the spindle speed has degraded, then it is less noticeable than if you write from the edge of the disk.
I had to change the principle of verification. Now we check in three places: near the spindle, in the middle and outside. Probably, you can only check the outside, but so it has historically developed. And what works, do not touch.
Can use smartctlto ask the disk how it is. We think of a good drive:

Spread SSDs are generally beautiful disks, they work fast, they do not make noise, they do not heat up. We believe that a good SSD has a write speed of more than 200 MB / s. Our clients love low prices, and server models that give out 320-350 MB / s do not always come to us.
For SSD, we also watch smartctl. Same Reallocated, Power_On_Hours, Current_Pending_Sector. All SSD disks are able to display the degree of wear, it is shown by the Media_Wearout_Indicator parameter. We wear discs up to 5% of life, and only then remove. Such discs sometimes find a second life in the personal needs of employees. For example, I recently found out that in 2 years such a disk got worn out by another 1% in an employee’s laptop, although we have 95% of it wiped out under an SSD cache in about 10 months.
But the problem is that not all disk manufacturers have agreed on the parameter names, and this Media_Wearout_Indicator, for example, Toshiba is called Percent_Lifetime_Used, other manufacturers have Wear Leveling Count, Percent Lifetime Remaining, or simply. * Wear. *.
Crucial does not have this parameter at all. Then we simply consider the amount of disc rewriting - “byte writed” - how many bytes we have already written to this disk. Further, according to the specification, we are trying to figure out how many overwrites this disk is designed by the manufacturer. With elementary mathematics we determine how long he will live. If it's time to change - change.
RAID
I don’t know why in the modern world our customers still want RAIDs. People buy RAID, put 4 SSDs there, which are much faster than this RAID (6 Gbps). They have some kind of instruction, and they collect it. I think this is almost unnecessary stuff.
There used to be 3 manufacturers: Adaptec; 3ware; Intel We had 3 utilities, we bother, but we made diagnostics for everyone. Now LSI has bought everyone - there is only one utility left.
When our diagnostic system sees RAID, it parses the logical volume into separate disks so that you can measure the speed of each disk, read it Smart. After that, it remains for the RAID to check the battery. Who does not know - there is enough batteries for RAID to twist all the disks for another 2 hours. That is, you turn off the server, remove it, and it rotates the disk for another 2 hours to complete all the recordings.
Network
Everything is pretty simple with the network - it should be less than 300 Mbps inside the data center. If less, then you need to repair. We also look at errors on the interface. Errors on the network interface should not be at all , and if they are, then everything is bad.

Along the way, we try to update the BIOS and IPMI firmware. It turned out that we do not like all BIOSes. We still have BIOSes that do not know UEFI and other features that we use. We try to update it automatically, but this is not always possible, everything is not very simple there. If it does not work, then the person goes and updates it with his hands.
IPMI Supermicro we do not give to the world, we have it on gray addresses through OpenVPN. Nevertheless, we fear that one day another vulnerabilities will come out and we will suffer. Therefore, we try to just the firmware IPMI was always the last. If not, then update.
From the strange recently got out that Intel on 10 and 40-gigabit network cards does not include PXE boot. It turns out that if the server is in a rack in which there is only a 40-gigabit card, then it is impossible to boot over the network, because you need to boot into a gigabit card. We separately flash network cards at 40G so that they will have PXE and be able to live further.
After everything is checked, the server immediately goes on sale . Calculate its price at which it is put on the site and sold.

In total, we have about 350 checks per month, 69% of servers are intact, 31% are not. This is due to the fact that we have a rich history, some servers are already for 10 years. Most of the servers that have not passed the test, we just throw.
The future has come! If I were to town this system today ... The

excellent utility Hardware Lister (lshw), which can communicate with the kernel, showed up beautifully what kind of hardware is in the kernel, what the kernel could determine. Do not need all these dances. If you repeat - I strongly advise you to look at this utility and use it. Everything will become much easier.
Results:
About the speaker: Artyom Artemyev ( artemirk ), technical director in a large hosting provider FirstVDS, he himself works with iron.
FirstVDS has two data centers. The first one is our own, we built our own building ourselves, brought and installed our own racks, serve ourselves, worry about the current and cooling of the data center. The second data center is a large room in a large data center that was rented, everything is easier with it, but it also exists. In total, it is 60 racks and about 3000 iron servers. There was something to practice and test different approaches, which means that we are waiting for almost confirmed recommendations. Let's start to view or read the report.
About 6-7 years ago, we realized that simply putting an operating system on a server is not enough. The OS is worth it, the server is alert and ready for battle. We launch it on production - strange reboot and hangup begin. It is not clear what to do - the process is underway; it is hard, expensive, painful to transfer the entire working draft to a new piece of iron. Where to run?
Modern deployment methods allow you to avoid this and transport the server in 5 seconds, but our clients (especially 6 years ago) did not fly in the clouds, walked on the ground and used ordinary pieces of iron.
In this article I will tell you which methods we tried, which ones we got accustomed to, which ones weren't taken root, which ones we run well with our hands, and how to automate all this. I will give you advice and you can repeat it in your company if you work with iron and you have such a need.
What is the problem?
In theory, checking the server is not a problem. Initially, we had a process, as in the picture below. A man sits down, takes a check-list, checks: processor, memory, disks, wrinkles forehead, makes a decision.
Then 3 servers were installed per month. But, when servers become more and more, this person starts crying and complaining that he is dying at work. A person is increasingly mistaken because verification has become a routine.
We made the decision: we automate! And the person will do more useful things.
Small tour
I will clarify what I mean when I talk about the server today. We, like everyone, save space in racks and use high-density servers. Today it is 2 units, which can fit either 12 nodes of single-processor servers, or 4 nodes of dual-processor servers. That is, each server gets 4 disks - everything is fair. Plus, there are two power supplies in the rack, that is, everything is reserved and everyone likes it.
Where does iron come from?
Iron to our data center is brought by our suppliers - as a rule, these are Supermicro and Intel. In the data center, our guys-operators, install servers in an empty space in the rack and connect two wiring, network and power. It is also the responsibility of operators to configure the BIOS in the server. That is, connect the keyboard, monitor and configure two parameters:
Restore on AC/Power Loss — [Power On]so that the server is always turned on as soon as power appears. It should work non-stop. The second First boot device — [PXE], that is, the first boot device we put on the network, otherwise we will not be able to reach the server, since it’s not a fact that it has disks at once, etc. After that, the operator opens the accounting panel of iron servers, in which you need to fix the fact of server installation, for which it is indicated:
- rack;
- sticker;
- network ports;
- power ports;
- unit number
After that, the network port, where the operator has installed the new server, for the purpose of security, goes to a special quarantine VLAN, on which also hangs DHCP, Pxe, TFtp. Next, our favorite Linux, which has all the necessary utilities, is loaded on the server, and the diagnostic process is launched.
Since the server still has the first boot device over the network, for the servers that go to production, the port switches to another VLAN. There is no DHCP in the other VLAN, and we are not afraid that we unintentionally reinstall our production server. For this we have a separate VLAN.
It so happens that the server was installed, everything is fine, but it never loaded into the diagnostic system. This happens, as a rule, due to the fact that during a VLAN switching delay, not all network switches quickly switch VLANs, etc.
Then the operator receives the task to restart the server by hand. Previously, there was no IPMI, we put remote outlets and fixed which port the server was in, pulled the outlet over the network, and the server rebooted.
But managed outlets also do not always work well, so now we manage server power over IPMI. But when the server is new, IPMI is not configured, it can be rebooted only by going up and pressing a button. Therefore, a person is sitting, waiting - the lamp is lit - runs and presses the button. Such is his job.
If after that the server does not boot, then it is entered into a special list for repair. This list includes servers on which diagnostics did not start, or its results were not satisfactory. An individual person - who loves iron - sits every day and makes out — assembles, looks, why does not work.
CPU
Everything is fine, the server has started, we are starting to test. We first test the processor as one of the most important elements.
The first impulse was to use the application from the vendor. We have almost all Intel processors - went to the site, downloaded the Intel Processor Diagnostic Tool - everything is fine, it shows a lot of interesting information, including the operating time of the server in hours and the power consumption schedule.
But the problem is that Intel PTD works under Windows, which we no longer liked. To run a check in it, you just need to move the mouse, press the “START” button, and the check will begin. The result is displayed on the screen, but it is not possible to export it anywhere. This does not suit us, because the process is not automated.
Let's go read the forums and find the two easiest ways.
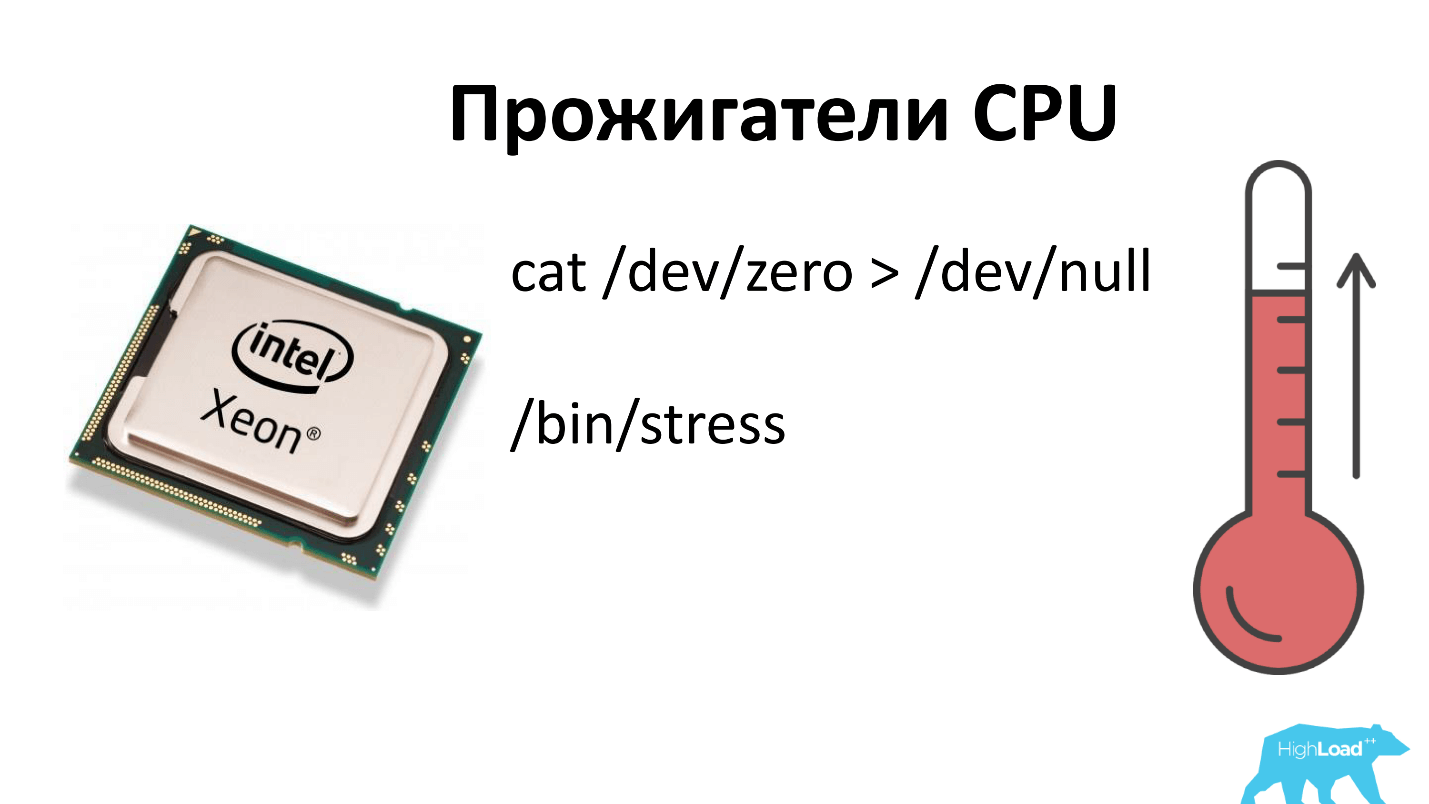
- The perpetual loop cat / dev / zero> / dev / null . You can check in top - 100% of one core is consumed. We count the number of cores, run the required number of cat / dev / zero, multiplied by the required number of cores. Everything works great!
- Utility / bin / stress . She builds the matrix in memory and begins to constantly turn them over. Everything is also good - the processor heats up, there is a load.
We give servers in production, users come back and say that the processor is unstable. Checked - the processor is unstable. They began to investigate, took the server, which passes the checks, but falls in battle, enabled debug in the Linux kernel, collected Core dump. Before rebooting, the server resets everything in memory before a crash.
Processors incorporate various optimizations for frequent operations. We can see the flags reflecting what optimizations the processor supports, for example, optimizing the work with floating-point numbers, optimizing multimedia, etc. But our / bin / stress, and the perpetual loop just burn through the processor in one operation and do not use additional features. An investigation revealed that the CPU crashes when trying to use the functionality of one of the built-in flags.
The first impulse was to leave / bin / stress - let the processor warm. Then in the cycle we will run through all the flags, jerk them. While thinking how to implement it, what commands to call to call the functions of each flag, read the forums.
On the overclockers forum, they stumbled upon an interesting project for finding primes Great Internet Mersenne Prime Search . Scientists have made a distributed network to which everyone can connect and help find a prime number. Scientists do not believe anyone, so the program works very cunningly: first you start it, it calculates the primes that it already knows, and compares the result with what it knows. If the result does not match, then the processor is working incorrectly. We really liked this property: for any nonsense, it is prone to falling.
In addition, the goal of the project is to find as many primes as possible, so the program is constantly optimized for the properties of new processors, as a result, it tugs a lot of flags.
Mprime has no time limit, if left unchecked, it works forever. We run it for 30 minutes.
/usr/bin/timeout 30m /opt/mprime -t
/bin/grep -i error /root/result.txt
After the work is completed, we check that there are no errors in result.txt, and we look at the kernel logs, in particular, we look for errors in the / proc / kmsg file.
Another tour
On January 3, 2018, the 50th Mersenne prime number was found (2 p -1). This number is only 23 million digits. It can be downloaded to view - this is a 12 MB zip archive .
Why do we need prime numbers? First, any RSA encryption uses prime numbers. The more primes we know, the more secure your SSH key is. Secondly, scientists test their hypotheses and mathematical theorems, and we are not against helping scientists - it costs us nothing. It turns out a win-win story.
So, the processor is working, everything is fine. It remains to find out what kind of processor. We use the dmidecode -t processor and see all the slots that are in the motherboard, and what processors are in these slots. This information enters our accounting system, we will interpret it later.
Catch
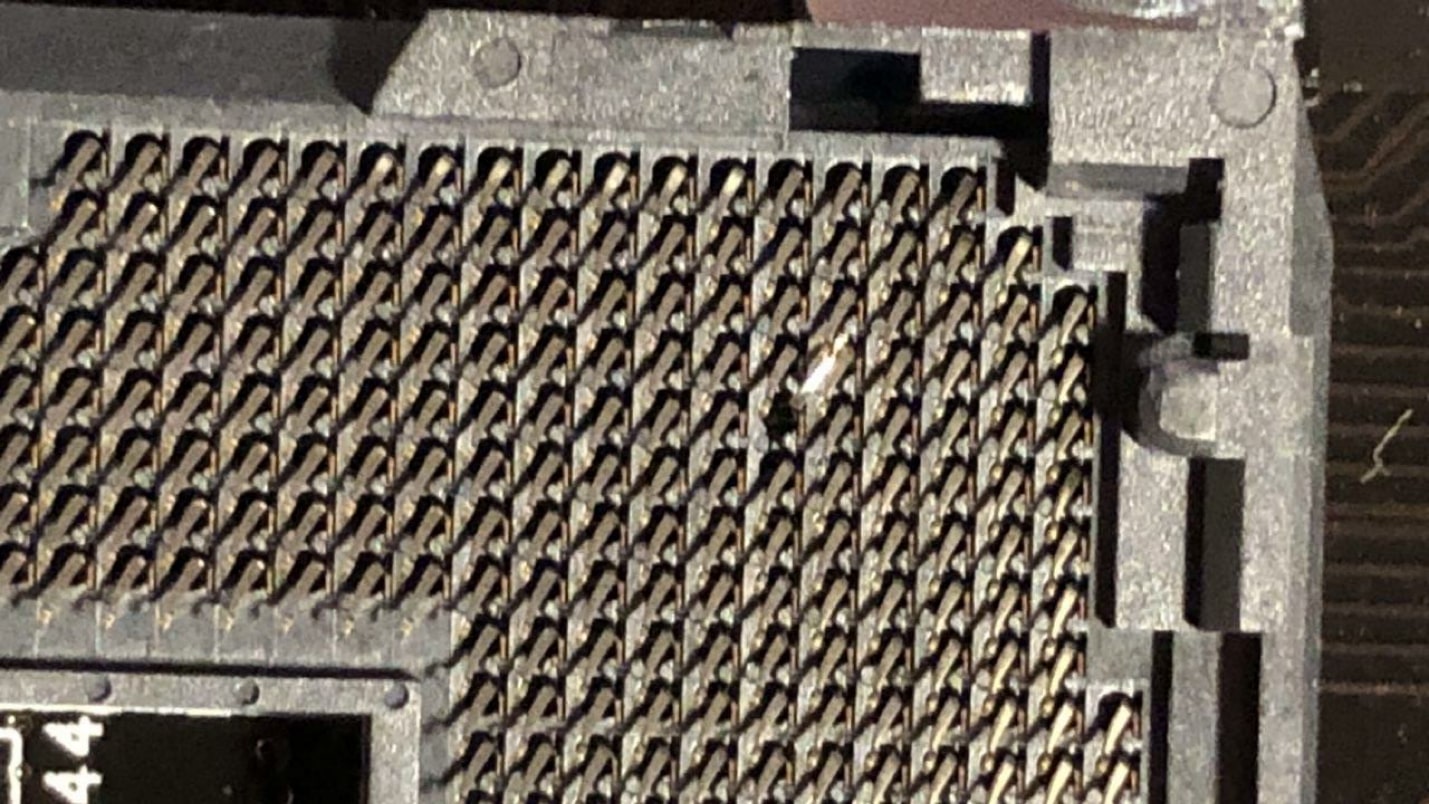
Thus, surprisingly, you can find broken legs. / bin / stress and the eternal cycle worked, and Mprime fell. They drove for a long time, searched, discovered - the result on the picture below - everything is clear.
Such a processor simply did not start. The operator was very strong, took the wrong processor - but could deliver.
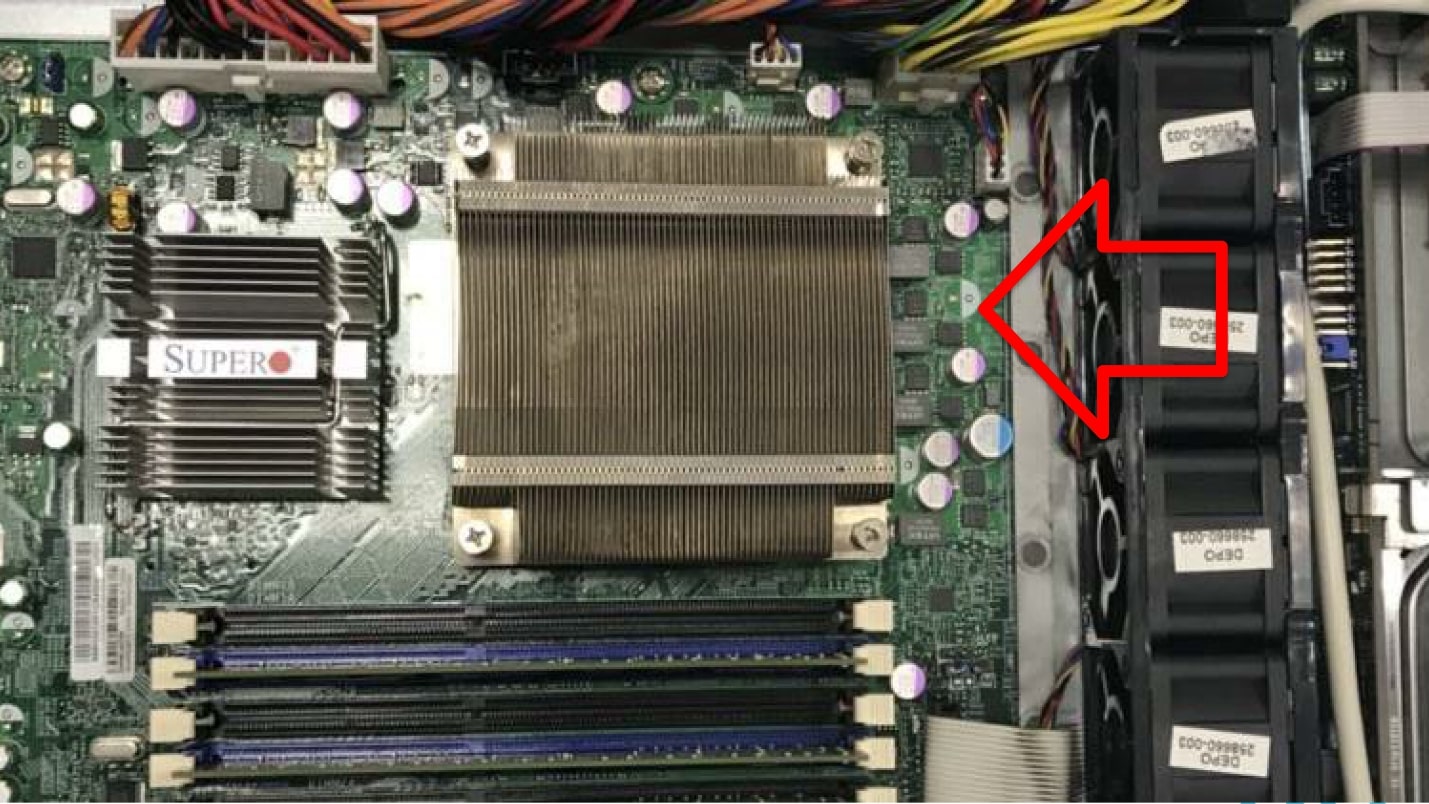
Another wonderful case. The black row in the photo below is the fans, the arrow shows how the air is blowing. See: the radiator stands across the stream. Of course, everything is overheated and turned off.
Memory
Memory is pretty simple. These are cells in which we write information, and after a while we read it again. If the same thing we recorded remains there, then this cell is healthy.
Everyone knows a good, straightforwardly classic, Memtest86 + program , which runs from any medium, over a network or even from a floppy disk. It is designed to check as many memory cells as possible. Any busy cells can no longer be checked. Therefore, memtest86 + has a minimum size so as not to occupy memory. Unfortunately, memtest86 + displays its statistics only on the screen . We tried to expand it somehow, but it all came up against the fact that there is not even a network stack inside the program. To expand it, you would have to bring the Linux kernel and everything else with you.
There is a paid version of this program, which already knows how to dump information to disk. But on our servers there is not always a disk, and there is not always a file system on these disks. A network drive, as we have already found out, cannot be connected.
We began to dig further and found a similar program Memtester . This program works from the OS level of Linux. Its biggest disadvantage is that the OS itself and Memtester occupy some memory cells, and these cells will not be checked.
Memtester is started with the command: memtester `cat / proc / meminfo | grep MemFree | awk '{print $ 2-1024}' `k 5
Here we transfer the amount of free memory minus 1 MB. This is done because otherwise Memtester takes up all the memory, and the down killer kills it. We drive this test for 5 cycles, at the output we have a tablet with either OK or fail.
| Stuck address | ok |
| Random value | ok |
| Compare XOR | ok |
| Compare SUB | ok |
| Compare MUL | ok |
| Compare DIV | ok |
| Compare OR | ok |
| Compare AND | ok |
The final result is saved and further analyzed for failures.
To understand the scale of the problem - our smallest server has 32 GB of memory, our Linux image with Memtester takes 60 MB, we do not check 2% of memory . But according to statistics for the last 6 years, there was no such thing that a memory got frankly in production. This is a compromise to which we agree, and which is dear to us to correct - and we live with it.
Along the way, we also collect dmidecode -t memory, which gives all the memory banks that we have on the motherboard (usually up to 24 pieces), and which dies are in each bank. This information is useful if we want to upgrade the server - we will know where to add what, how many slats to take and which server to go to.
Storage devices
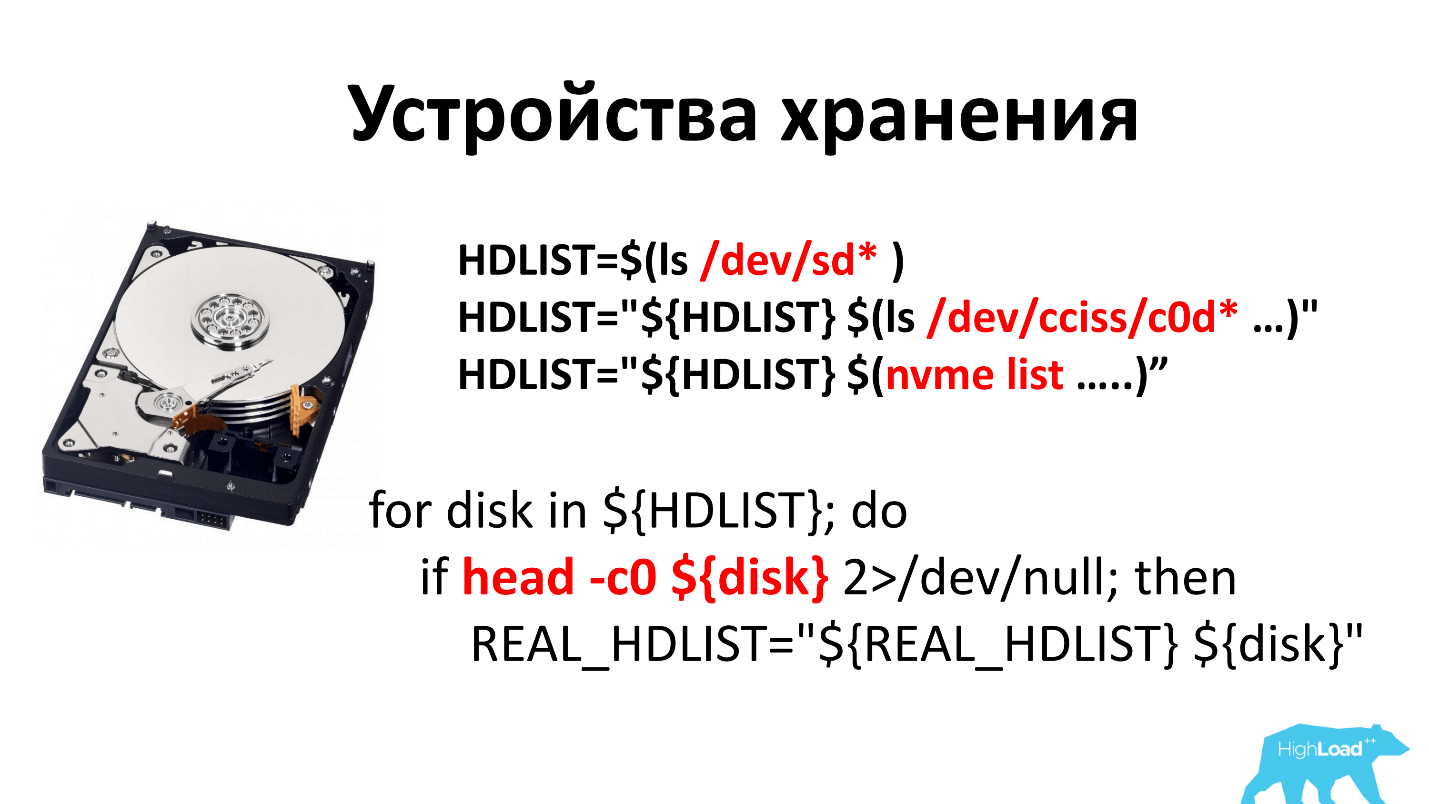
6 years ago, all the discs were with pancakes that were spinning. A separate story was to collect just a list of all disks. There were several different approaches, because I could not believe that you can just watch ls / dev / sd. But in the end we stopped to watch ls / dev / sd * and ls / dev / cciss / c0d *. In the first case, this is a SATA device, in the second - SCSI and SAS.
Literally this year, they started selling nvme-disks and added the nvme list here.
After the list of disks is compiled, we try to read 0 bytes from it in order to understand that this is a block device and everything is fine. If we could not read it, then we consider that this is some kind of a ghost, and we never have such a disk and never did.
The first approach to checking disks was obvious: “Let's write random data on the disk and see the speed” -
dd -o nocache -o direct if=/dev/urandom of=${disk}. As a rule, pancake disks give out 130-150 MB / s. Having narrowed our eyes, we decided for ourselves that 90 MB / s is the figure after which there are good disks, all that is smaller is faulty. But users began to return again and say that the disks are bad. It turned out that the insidious physics was joking with us again.
There is an angular velocity, and, as a rule, when you run -dd, it writes near the spindle. If for some reason the spindle speed has degraded, then it is less noticeable than if you write from the edge of the disk.
I had to change the principle of verification. Now we check in three places: near the spindle, in the middle and outside. Probably, you can only check the outside, but so it has historically developed. And what works, do not touch.
Can use smartctlto ask the disk how it is. We think of a good drive:
- There are no Reallocated Sectors ( Reallocated Sectors Count = 0) , that is, all sectors that left the factory are working.
- We do not use discs older than 4 years , although they are quite working. Before we introduced this practice, we had disks for 7 years. Now we believe that after 4 years the disc has paid off, and we are not ready to accept the risk of wear.
- There are no sectors that are going to be Reallocated ( Current_Pending_Sector = 0 ).
- UltraDMA CRC Error Count = 0 - these are errors on the SATA cable. If there is an error, you just need to change the wire, you do not need to change the disk.
Spread SSDs are generally beautiful disks, they work fast, they do not make noise, they do not heat up. We believe that a good SSD has a write speed of more than 200 MB / s. Our clients love low prices, and server models that give out 320-350 MB / s do not always come to us.
For SSD, we also watch smartctl. Same Reallocated, Power_On_Hours, Current_Pending_Sector. All SSD disks are able to display the degree of wear, it is shown by the Media_Wearout_Indicator parameter. We wear discs up to 5% of life, and only then remove. Such discs sometimes find a second life in the personal needs of employees. For example, I recently found out that in 2 years such a disk got worn out by another 1% in an employee’s laptop, although we have 95% of it wiped out under an SSD cache in about 10 months.
But the problem is that not all disk manufacturers have agreed on the parameter names, and this Media_Wearout_Indicator, for example, Toshiba is called Percent_Lifetime_Used, other manufacturers have Wear Leveling Count, Percent Lifetime Remaining, or simply. * Wear. *.
Crucial does not have this parameter at all. Then we simply consider the amount of disc rewriting - “byte writed” - how many bytes we have already written to this disk. Further, according to the specification, we are trying to figure out how many overwrites this disk is designed by the manufacturer. With elementary mathematics we determine how long he will live. If it's time to change - change.
RAID
I don’t know why in the modern world our customers still want RAIDs. People buy RAID, put 4 SSDs there, which are much faster than this RAID (6 Gbps). They have some kind of instruction, and they collect it. I think this is almost unnecessary stuff.
There used to be 3 manufacturers: Adaptec; 3ware; Intel We had 3 utilities, we bother, but we made diagnostics for everyone. Now LSI has bought everyone - there is only one utility left.
When our diagnostic system sees RAID, it parses the logical volume into separate disks so that you can measure the speed of each disk, read it Smart. After that, it remains for the RAID to check the battery. Who does not know - there is enough batteries for RAID to twist all the disks for another 2 hours. That is, you turn off the server, remove it, and it rotates the disk for another 2 hours to complete all the recordings.
Network
Everything is pretty simple with the network - it should be less than 300 Mbps inside the data center. If less, then you need to repair. We also look at errors on the interface. Errors on the network interface should not be at all , and if they are, then everything is bad.
Along the way, we try to update the BIOS and IPMI firmware. It turned out that we do not like all BIOSes. We still have BIOSes that do not know UEFI and other features that we use. We try to update it automatically, but this is not always possible, everything is not very simple there. If it does not work, then the person goes and updates it with his hands.
IPMI Supermicro we do not give to the world, we have it on gray addresses through OpenVPN. Nevertheless, we fear that one day another vulnerabilities will come out and we will suffer. Therefore, we try to just the firmware IPMI was always the last. If not, then update.
From the strange recently got out that Intel on 10 and 40-gigabit network cards does not include PXE boot. It turns out that if the server is in a rack in which there is only a 40-gigabit card, then it is impossible to boot over the network, because you need to boot into a gigabit card. We separately flash network cards at 40G so that they will have PXE and be able to live further.
After everything is checked, the server immediately goes on sale . Calculate its price at which it is put on the site and sold.
In total, we have about 350 checks per month, 69% of servers are intact, 31% are not. This is due to the fact that we have a rich history, some servers are already for 10 years. Most of the servers that have not passed the test, we just throw.
For the curious: we have 3 clients who still live on the Pentium IV, and do not want to go anywhere. They lack 512 MB of RAM.
The future has come! If I were to town this system today ... The
excellent utility Hardware Lister (lshw), which can communicate with the kernel, showed up beautifully what kind of hardware is in the kernel, what the kernel could determine. Do not need all these dances. If you repeat - I strongly advise you to look at this utility and use it. Everything will become much easier.
Results:
- Compromise is not bad, it's just a matter of price. If the solution is very expensive, you need to look for the level when both reliability and price are acceptable.
- Non-core programs are sometimes great for testing. It remains only to find them.
- Test everything you can reach!
The next big HighLoad ++ is November 8 and 9 in Moscow. The program includes well-known specialists and new names, traditional and new tasks. In the DevOps section, for example, already taken:
- David O'Brien (Xirus), who will discuss the eternal - “ Metrics! Metrics! Metrics! "
- Vladimir Kolobaev (Avito) with the report “ Monitoring to developers! Technology to the community! Profit - all! "
- Elena Grahovac (N26) will present the “ Best Practices for Native Cloud Services ”.
Study the list of reports and hurry to join. Or subscribe to our newsletter, and will regularly receive reviews of reports, reports on new articles and videos.