Reliability Analysis in Wolfram SystemModeler 4.1
- Transfer
Translated by Jan Brugård and Johan Rhodin on " Reliability Analysis in SystemModeler 4.1 ".
Download the file with the models discussed in the post here .
I express my deep gratitude to Kirill Guzenko for help with the translation.
Today we are pleased to announce the Wolfram SystemModeler 4.1 . In the future, a series of publications will be presented in which we will highlight new functionality in the field of system reliability.
Several examples will be presented that you yourself can try by downloading the trial version of SystemModeler , the model from this post and the trial version of the Wolfram Hydraulic library.
Most people have come across a situation where some thing that they bought and used in the future suddenly breaks down for some reason. Over the past few years, both authors of the article faced a similar problem - large-scale malfunctions with the engine in Johan’s car (he had to be replaced) and problems with the receiver from Jan, which was completely dead (he had to be sent to a service center and changed the network chip).
In both cases, this caused problems for both consumers (ours) and manufacturers. These are just a couple of examples, and I’m sure that you too will surely have a similar example.

Consumer electronics, satellite systems, systems for aviation - it does not matter, everything has certain reasons for assessing reliability.
Due to breakdowns, warranty service costs may be required - as is the case with a network chip; huge difficulties associated with the repair - as in the case of the engine, and the satellite will require even more costs. As for airplanes, there is already a direct threat to human life.
The question arises - how models with quantitatively uncertain indicators can be used to increase the reliability and functionality of the system.
Implementing a system for reliability analysis in SystemModeler allows you to calculate the reliability of an entire system through the reliability of its components. Let's get a look.
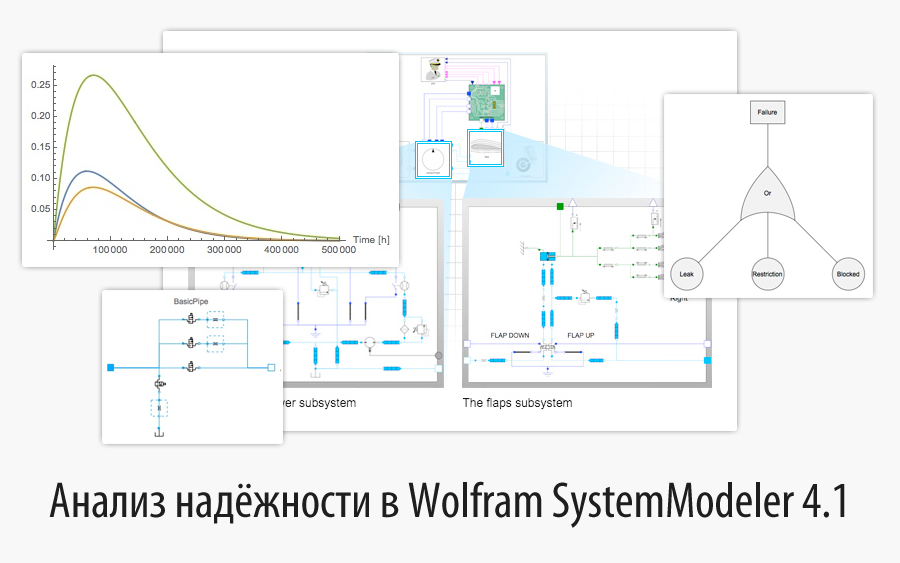
Let's start from the component level and calculate the probability of a hydraulic pipe failure:

Pipe charts are shown for normal operation, limited operation, leakage, and when the pipe is blocked.
This is a fairly simple component that can be in three possible states of failure - to leak, skip to a limited extent, or be blocked.
Here is a three-pipe system in which we can look at different types of failure:

A model with three pipes, one cylinder and one pump. Pumping the liquid causes the cylinder to push the rod, and the level changes.

Fault detected! The level does not move at all when the pipe is blocked.
You can determine the type of malfunction by looking at the simulation results and compile a list of probable causes of the malfunction. In general, specialists in the diagnosis and detection of problems are engaged in this, and we will not particularly touch on this topic. Instead, in this post we will focus on the overall reliability of systems like the one mentioned above.
The operation of the pipe can be illustrated by the classic fault tree, where a fault in one sheet gives rise to a fault in the entire system:

The fault tree for the pipe.
With the newly introduced reliable approach in SystemModeler, we can define the life distributions of individual components:

Reliable approach in SystemModeler , where the distribution of service lives correspond to individual components.
After that, we will build a fault tree for the pipe, indicating which type of fault (leak, limited transmittance, full blocking) will lead to a malfunction of the system as a whole: A

reliable approach to considering components with several distributions of service life. Here the fault tree is entered by entering a logical expression for this configuration.
The fault tree is now available for analysis in Wolfram Language ( Mathematica ):

The WSMModelReliability function can return FailureDistribution (when it uses the fault tree), ReliabilityDistribution(when it uses the reliability block diagram) or the distribution of component life. The traditional way to illustrate the reliability of components or systems is to use SurvivalFunction , which gives the probability that the system will be operational for a time t. For one pipe, it will look like this:

This distribution is like any probabilistic distribution in Wolfram Language. Because it can get more than 30 properties, for example the conditional probability that the tube will last more than 20,000 hours, given that it has already worked for 10,000 hours:

The symbol
Systems, of course, consist of a large number of pipes. Here's a diagram of the Cessna airplane hydraulic flap system, which contains several pipes (see the Habrahabr article " Modeling airplane flap fault scenarios using the Wolfram SystemModeler "):

Cessna airplane hydraulic flap system with one tank, two pumps, many valves and fifteen pipes.
Systemmodelerautomatically reads the sewn-in reliability indicators of the hydraulic system pipes, as a result of which the reliability of the entire system can be calculated. The first question to consider is how much lower will the reliability of the entire hydraulic system be compared to a single pipe:

Comparison of the reliability of one pipe and the entire hydraulic system.
What should be expected - a system of many pipes is much less reliable than a single pipe. This is an illustration of the phenomenon of the “weakest link”: a failure in one pipe will cause a failure of the entire system.
If we look at the same components of an airplane's flaps, we run into something similar.
We now combine the hydraulic system with flaps (75 components in total). In SystemModelerjust indicate that we need a hydraulic system and a flap system ( hydraulicPower and flaps ).

Aircraft Cessna in terms of reliability. Here are the distributions of the expected service life for the hydraulic system and flap system.


Reliability functions for various parts of the system.
The reliability of the entire system is lower than the reliability of each component. This law applies to all systems - the more components in the system, the higher the likelihood that a particular component will fail.
Let’s now find out which component is most beneficial to improve. Wolfram Language contains nine different measures of importance, and the simplest one is StructuralImportance.. Let us find out exactly what kind of malfunctions are most easily eliminated in the pipe:

Potential improvement for various pipe malfunctions.
The importance of the improvement indicates how much the reliability of the system will increase when replacing a component with its ideal counterpart. The importance of improvement is a relative measure, and for it to have any meaning, it must be taken in the context of the entire system and its components. From the graph it becomes clear that the way to eliminate limited pipe throughput will most likely increase the reliability of the system. You can do the same for the whole system and compare the flap system with the hydraulic system:

The improvement potential for the hydraulic system is definitely higher than for the flaps.
Several important points can be drawn from this graph. First, improving the hydraulic system compared to improving the flaps has a higher payback in the context of the life of the entire system. Secondly, the payback will be the higher, the greater the ratio (starting from 1.66) between the contributions to the improvement of the hydraulic system and flaps. This is not particularly visible on the graph, but it becomes apparent when comparing numbers. For example, with a service life of 3,788 hours, when the highest value corresponds to the hydraulic system, the ratio will be 2.08, and with a service life of 10,000 hours - 3.38.
Reliability analysis shows in which place you should focus the main efforts to improve the system, thereby increasing the reliability of the product, assess where the failure may occur and bring the data into line with the warranty policy.
On the SystemModeler website, you can learn more about what is new in SystemModeler 4, by studying examples, free courses, and exploring a fully-functional trial version.
PS
In a previous post, “ Modeling Aircraft Flap Failure Scenarios Using the Wolfram SystemModeler, ” we studied a malfunction in an electronic system, and in the article “ Reliability Mathematics with Mathematica ”, Mathematica functionality in the field of reliability analysis was described in detail . Finally, from the free course “ Modeling Safety-Critical Systems ”, you can gain some knowledge about modeling faults of individual components and how they affect the behavior of the system as a whole.