How we looked for signs of medical errors

In 2006, an aneurysm exploded in my father-in-law’s head and a stroke struck him. By the evening of that day, he was already joking and trying to walk around the hospital ward. Repeated stroke, which happened under the supervision of doctors, his brain could not resist - the test stopped talking, walking and recognizing relatives. In another hospital, he was put on his feet, but due to a medical error during the initial treatment, he lost his speech forever, and his personality changed to unrecognizability.
What happened to him is called a nosocomial stroke, and this is one of the markers (or otherwise, triggers) of systemic problems in a medical organization. They need to be analyzed to reduce the number of preventable medical errors in hospitals and to improve the quality of patient care.
In the US, this issue was puzzled in the early 2000s. The Massachusetts Institute for Healthcare Improvement (IHI) developed the IHI Global Trigger Tool for Measuring Adverse Events , which was then implemented by leading US and European clinics.
In 2016, we (the Russian office of SAS) tried to create a system for analyzing medical triggers according to the IHI methodology in Russia. I'll tell you what came of it.
Where did you start
First of all, we began to search for like-minded doctors who share the idea of analyzing the quality of medical care. We invited the heads of several Moscow hospitals, colleagues from our European office and representatives of the Danish hospital Lillebaelt, which created the 2015 IHI trigger detection system based on the SAS analytical platform, to SAS Forum Russia 2016 .
The story of the Danes interested the head physician of a large Moscow multidisciplinary hospital, and we agreed to conduct an experiment to analyze medical records. Under the terms of the NDA, we cannot disclose the details of the project, therefore, the hospital will in the following be called simply the Clinic, and its head - the Chief Physician.
In June - July 2016, we discussed the content and scope of the project with the management of the Clinic, in August we prepared the terms of reference and started work in September. The backbone of the team from the SAS consisted of Alexander Zhukov ( al_undefined ) and Dmitry Kyayenko.
Method IHI contains 51 trigger. For the project together with the management of the Clinic, we selected the following:
- Blood leukocytes <3,000 x 10 ^ 6 / µl (except for chemotherapy patients)
- Blood platelets <50,000 × 10 ^ 6 / μL (except for chemotherapy patients)
- Nosocomial stroke
- Nosocomial infarction
- Repeated unplanned transfers to the intensive care unit and intensive care (ICU) within 24 hours
- Resuscitation within 24 hours after surgery
- Resuscitation in bed rooms
As is often the case in analytics, the preparation of the initial data and the allocation of significant information in them took the lion's share of the time.
How to retrieve records
The data of the medical information system (MIS) of the Clinic were placed in an oraklovoy database with an intricate structure. Descriptions of the schemes could not be found, so we had to restore the data structure and the connections of the entities, matching the information from the database with the information from the MIS graphical interface.
For the project, we needed the following types of medical records:
- The data of the examination of the doctor's reception
- Diagnosis table
- Diary entries
- Protocols of operations and preoperative concepts
- Appointments and assignment performance information
- Stage and discharge epicrises
- Translation epicrises
- Death Epicrises
This data (except for the table of diagnoses) lay in XML in CLOB. There was no description of the XML structure at the Clinic, so their content had to be established empirically during long discussions.
Inside the XML documents was a mess. For example, in the General Condition node there could be information about the patient's complaints, while the Complaints node itself was empty. Often, doctors recorded all patient data (complaints, examination results, recommendations for further treatment and prescription of medicines, etc.) in one field, for example, in the “Comment”.
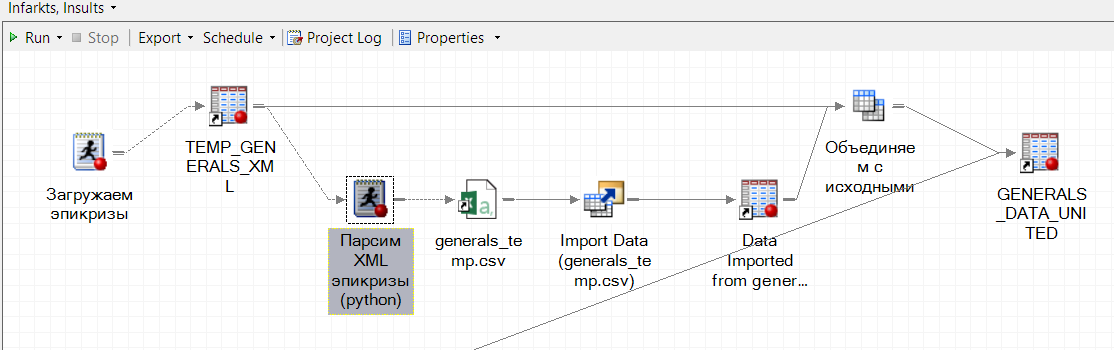
Scanning XML into flat tables was done by the regular SAS XML Mapper. The most complex documents that had the necessary information at different levels of nesting were parsed with a self-written parser in Python. It was launched from SAS and integrated into a single executable process of the SAS Enterprise Guide:
In order not to drag out the results of laboratory studies from the text of epicrises (which is still a pleasure, given the habit of some doctors to document in a hurry), we took data on them from the laboratory information system (LIS). They were also wrapped in XML, but of a simple form - “analysis”, “indicator”, “value”.
How the data was investigated
When we brought the medical records into a clear and usable form, it turned out that only 2 of 7 triggers were formalized - the content of “leukocytes” and “platelets”. They were expressed by numbers that could be compared with a threshold value.
We had to abandon the analysis of such a trigger as "Repeated unplanned transfers to the ICU within 24 hours." This marker is based on the date-time marks, and they were added to the IIA Clinic as a god for the soul - they could miss a couple of days or even put a date from the future.
Nosocomial strokes, heart attacks and resuscitation measures were not coded in any way and were not recorded in the table in relation to the patient's ID. They should be sought in the epicrises and diary entries. Therefore, the remaining 4 triggers were unformalized, that is, they required parsing unstructured text.
To do this, we used the natural language processing tool (natural language processing) - SAS Contextual Analysis . This is a web-based solution with a visual interface that allows you to create text-processing models even in the absence of programming skills and knowledge of linguistics (however, you still can’t do without knowledge of the subject area and the language in which the text is written).
Now these issues have become fashionable to solve using neural networks. But we deliberately left them and applied the mechanism of linguistic rules, because:
- A good result in neural networks is possible only on a high-quality, pre-marked by doctors sample of tens of thousands of records, and we did not have it from the word
- the neural network does not give a clear explanation of its decision (it cannot be interpreted), and doctors cannot work with a black box - they have to understand which symptoms, indicators or actions indicate adverse events
How to train the system
Although we dealt with all the triggers from the list, the main efforts were focused on identifying nosocomial strokes and heart attacks (we will call this, for short, VBI). These are one of the most dangerous triggers, which, besides damage to the health of patients, are terrible because they are not advertised by medical staff. And if the management does not know about the problem, he cannot deal with it.
With VBI everything was not easy. There was no standard or regulation that obliged to document the facts of stroke or heart attack in a uniform form: some doctors described stroke as “acute cerebrovascular accident”, others as (oh, yes!) Stroke, and others as “stroke” ". Sometimes, nosocomial infection was seen only by prescribed treatment.
Basically, we could:
- Interview all doctors how they describe strokes and heart attacks. However, there was a risk of missing something - no one keeps in mind the list of records made once and the reference book of abbreviations. And to speak on this topic was a little willing.
- Together with the doctors, go through all the epicrises and analyze whether there are signs of nosocomial infection in them or not. But this amount of time was neither with us nor with them.
We acted differently: we loaded a collection of texts into Contextual Analysis and built thematic models that selected key ideas for each record. Without getting into the text of the document (for example, an epicrisis), it was possible to select only entries with the subject “stroke” or “NMC” and study them separately on the subject of HFI described in the text: what words are used, at what distance are they there are, etc. Plus models themselves offered possible formulations for describing key ideas.
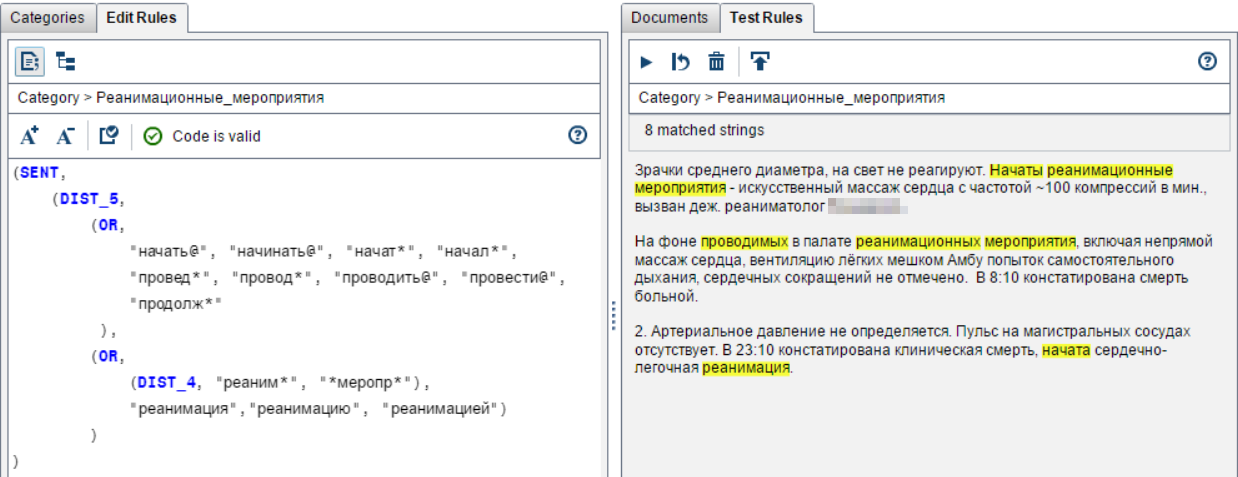
After the thematic marking of the documents, we communicated with the doctors, refined and developed the linguistic rules for identifying events pointing to triggers. The rules took into account the grammatical forms of words, the distance between them, their order, position (in one sentence, paragraph, beginning / end of the text), etc.
So we were looking for resuscitation:
And so - strokes:
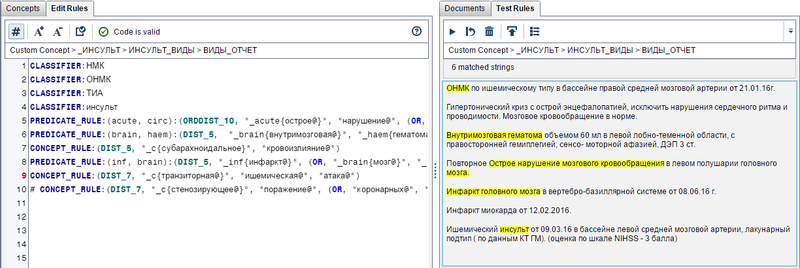
When analyzing a text, you should always evaluate the distance between the keywords and their order so as not to capture too much. Here is an example when all the right words (“acute”, “violation”, “cerebral”, “blood circulation”) are in the phrase, but there is no nosocomial stroke:

It was very important to separate the description of the fact of nosocomial stroke from the description of the consequences of a previous stroke, the same keywords were used in:
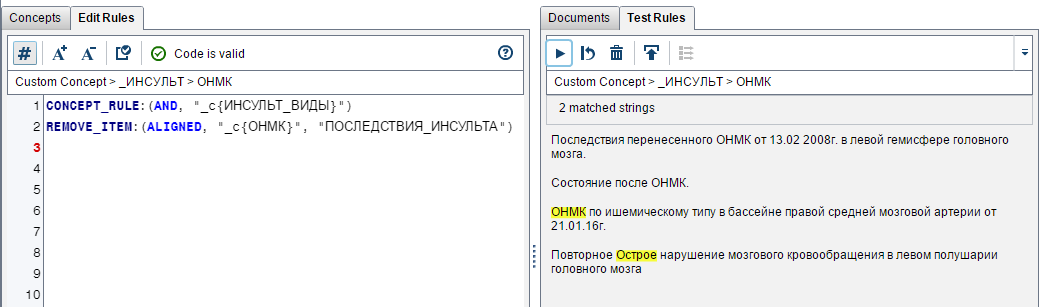
Exclude the rule “The consequences of a stroke” (above in Remove_item):
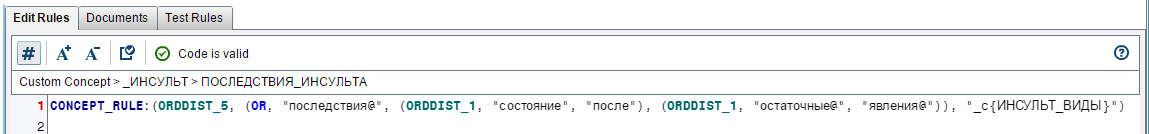
Together with the doctors, we developed about 30 linguistic rules that determined whether there are signs of triggers in the epicrises. They were downloaded from Contextual Analysis in the form of a scoring code that was connected to the executable evaluation process records in the SAS Enterprise Guide.
However, for nosocomial strokes and heart attacks, the process of deciding whether there is a trigger does not end there. We should have removed from the number of candidates for the trigger those cases that could be predicted upon admission of the patient. To do this, we compared the results of rule processing with the table of diagnoses.
Let me remind you that a trigger is an event (worsening the patient’s condition), an unexpectedin terms of diagnosis upon admission. This is a signal of a medical error or a hospital problem requiring systemic measures to eliminate future complications, and not just any deterioration in the patient’s health.
Suppose Contextual Analysis assigned the label “nosocomial infarction” to some record. We check the diagnosis: if the patient was admitted with coronary heart disease, then the risk of myocardial infarction was high. This event, though not auspicious, but, alas, expected. Sign trigger trigger not assignable.
If the patient was admitted with appendicitis and had a stroke during treatment, then this could be a medical error. For example, they did not keep up with the pressure or provoked its jump with some kind of drugs or actions. Records assign the attribute "trigger".
The result was the following business process:
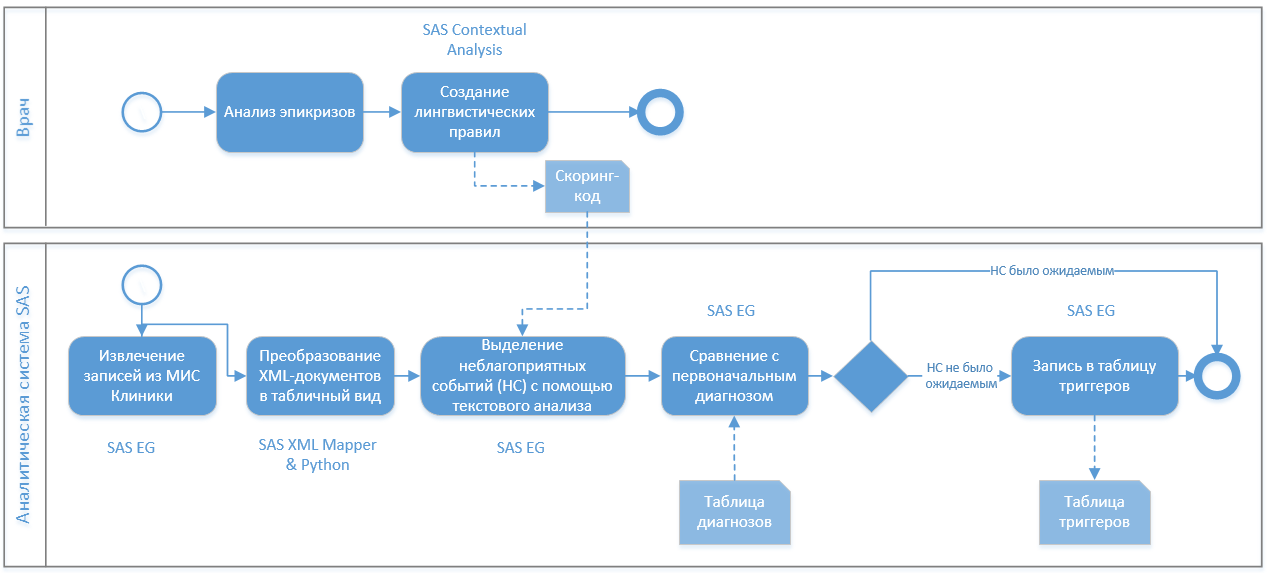
It was convenient for doctors - they could independently complement the linguistic rules for parsing the epicrises, which were then uploaded to the scoring code and picked up by the analytical system.
How to visualize the data
At the last stage, we set up a report in SAS Visual Analytics - this is our web-based product for visualization and BI tasks. It was updated every 5 minutes and showed statistics on the occurrence of triggers in the context of departments, doctors and patients. The responsible doctor (for example, the head of the cardiology department) went to the report and looked at what triggers were detected in the last hour, day, week. Could “fail” to the department, see the trigger dynamics for the period, and so on.:
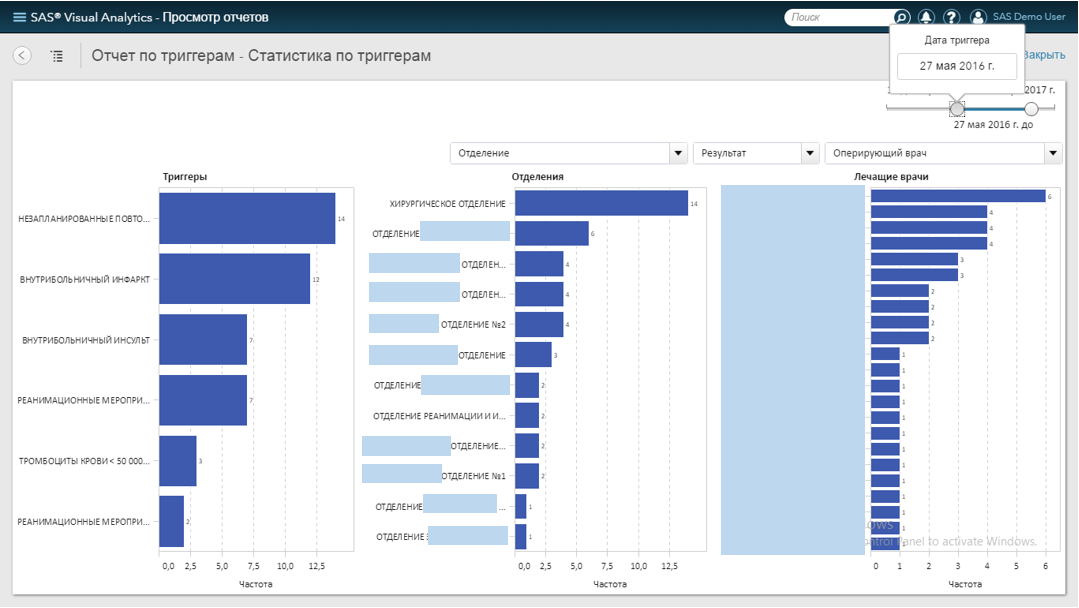
In order not to load the article with screenshots (especially “smeared”), we recorded a small demonstration on the depersonalized data:
We also wanted to set up automatic distribution of trigger notifications - this is a good tone for analytical systems that track critical indicators. Especially since the mailing functionality is built into SAS Visual Analytics. But the Clinic did not want to give access to the mail server, just as it refused to organize SMS-mailing through conjugation with external services.
How it all ended
The hospital management conducted an experiment by comparing the results of the manual detection of triggers of adverse events by a team of expert doctors and an automatic analysis conducted by the SAS system. The result was not in favor of people: the SAS system found more than a medical board. For some triggers - several times more:
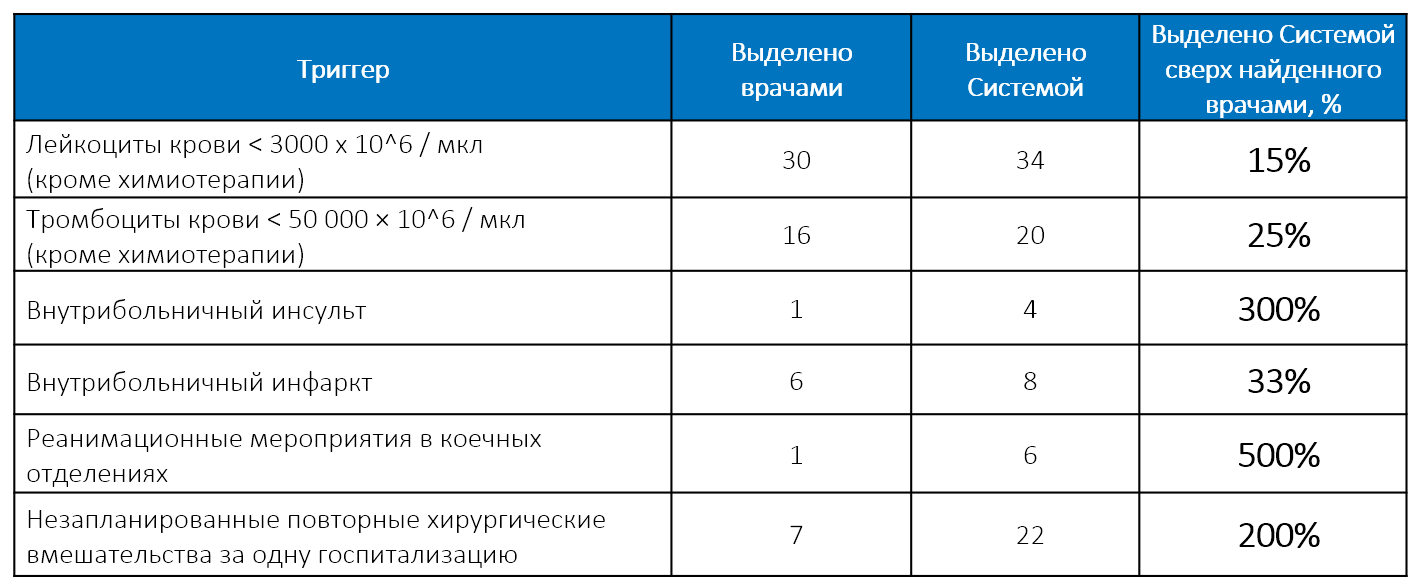
But the increased accuracy is not the main thing that the trigger detection system provided. Most importantly, it allowed:
- Ensure continuous monitoring of all medical records. Not randomly selected or the most egregious cases, but one and all. Not only once a quarter, but in a mode close to real time.
- Free up the time of highly qualified staff to engage in core activities. Only as part of the experiment, it was possible to confuse the medical staff with a full-scale manual audit. In the usual mode, there is no time to do this - if the doctors mess around with the records, there will be no one to treat people.
Important for the success of the project was the full support of the administration - the Head Doctor, his deputies and heads of departments. The Head of the Clinic was educated in the USA, so the idea of management based on quality management and automated data analysis turned out to be close and understandable to him.
Alas, shortly before the full-scale implementation of the analytical system, the Head Doctor left his post. His changer was frankly conservative and did not like to wash dirty linen in public. The clinic wrote off the results of a promising project "in the table" and returned to the methods of work, proven over years of practice.
Although it is not pleasant to make an unclaimed product, the experimentation at the Clinic was very useful for us in the next project on the audit of medical cards in the CHI system. But more about that another time.