# Token Analysis and Control for Design Systems: A Tool for Preventing Errors and Simplifying Versioning
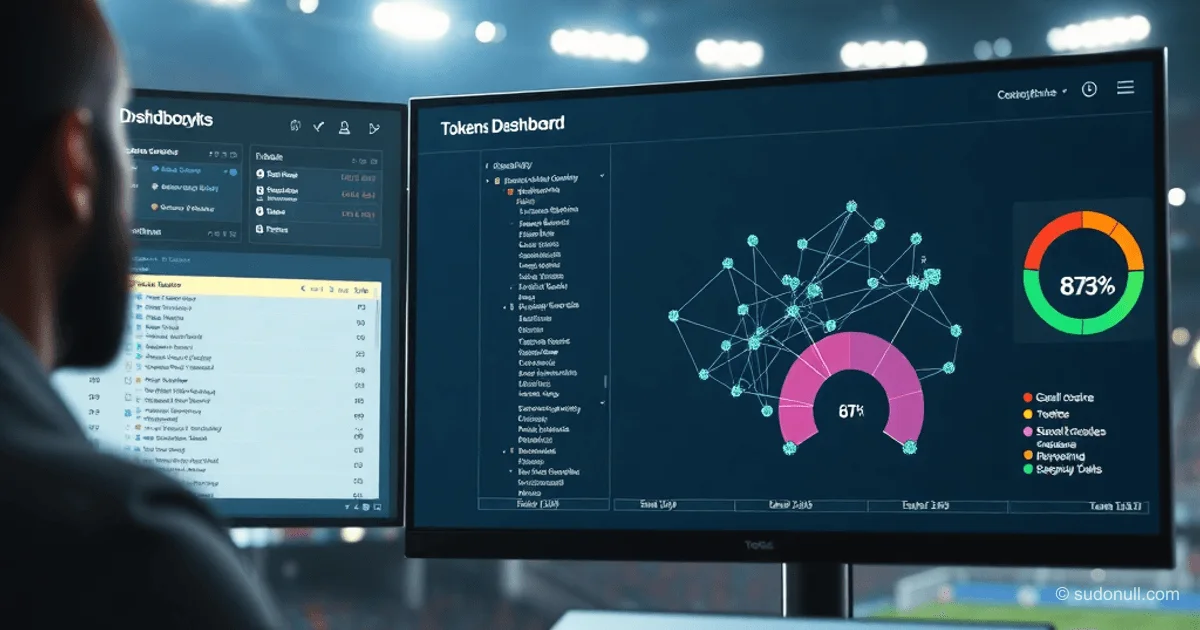
As design systems scale beyond 20 components and multiple brands, token management turns into chaos. Errors in JSON files, circular references, and inconsistencies between themes can lead to critical failures. Tokens Dashboard—a free, open-source tool—solves these issues by providing a unified dashboard for analyzing, versioning, and visualizing tokens.
Problems in Managing Design System Tokens
When a design system goes beyond basic components, manual token management becomes an overwhelming task. Designers export data from Figma, developers get pull requests with thousands of lines of changes, but figuring out exactly which tokens are affected and whether the system's integrity is intact is practically impossible. Critical risks include:
- Use of Cyrillic characters instead of Latin ones (e.g., Russian 's' in color hex codes)
- Circular references between tokens
- Mismatches in token structure between themes (missing token in one brand)
- Excessive nesting (reference chain depth >3)
- Hardcoding values directly instead of referencing primitives
These errors often only surface in production, causing interfaces to crash when switching themes or adding new brands. Standard text editors and diff tools can't handle semantic token analysis.
Installation and Running Tokens Dashboard
The tool is cross-platform (Mac OS, Linux, Windows) and requires no installation. The process involves three steps:
- Download the archive from the GitHub repository
- Unpack it into any directory
- Run the script based on your OS:
- For Mac/Linux: run-mac-linux.sh
- For Windows: run-windows.bat
After launch, your browser will automatically open the web interface. To analyze, upload JSON token files (individual files, folder, or archive). The system supports import via the central button or the menu in the top-right corner. All data is processed locally—no byte leaves your computer.
Key Metrics for Evaluating Token Quality
Tokens Dashboard structures analysis through four categories of metrics, turning raw JSON data into actionable insights:
- Architectural metrics—assessment of structural integrity:
- Total Values: total number of tokens in the system
- Unique tokens: tokens specific to individual modes (brands/themes)
- Varying: tokens with different values across modes (e.g., background color in light/dark theme)
- Static: identical values across all modes (indicating redundancy)
- Error and warning metrics—identifying critical threats:
- Orphans: tokens missing in one of the modes (will cause crashes when switching themes)
- Broken: references to non-existent tokens
- Errors: syntactic errors (Cyrillic instead of Latin, type conflicts)
- Performance metrics—evaluating efficiency:
- Chain depth: maximum token nesting depth (values >3 lead to slowdowns)
- Hardcoded: semantic tokens with hardcoded values
- Unused: unused primitives (increase system size)
- Health Score—an overall health indicator for the system. Calculated as 100 points for a perfect state minus penalties for each issue found. Allows tracking progress after refactoring.
Modes for Detailed Analysis
The interface provides specialized modes, activated via the sidebar menu:
- Explorer: tree navigation through all tokens with mode filtering. Shows value hierarchy and helps quickly find duplicates.
- Nodes: dependency graph visualization. Each node is a token; edges show references between them. Helps detect circular references and isolated elements.
- Compare/Static: side-by-side comparison of token values between themes. Highlights differing properties (e.g., colors for dark/light mode).
- Diff: analysis of changes between versions. Shows added, removed, and modified tokens after importing a new version.
- Specialized modes (Orphans, Broken, Errors): focus on specific issue types with bulk export options for fixes.
- High usage: ranking tokens by usage frequency. Identifies critical elements and potential failure points.
Practical Refactoring Implementation
The system turns abstract metrics into concrete actions. For example, when detecting Orphan tokens:
- In Orphans mode, export a list of problematic tokens
- For each item, check which modes lack the value
- Add default values or align structure across brands
Similarly, Hardcoded mode identifies tokens with direct hex codes instead of references to color primitives. This enables:
- Automating value replacements via pattern search
- Verifying new references via Health Score
- Ensuring Chain depth doesn't exceed critical thresholds
The key advantage is integrating all stages: from error detection to fix verification in a single environment. This shortens the refactoring cycle from days to hours.
What Matters
- Automated analysis: The tool detects errors impossible to spot manually (circular references, Cyrillic in hex codes).
- Health Score as KPI: The overall metric allows quantifying refactoring progress and justifying costs for design system improvements.
- Versioning via Diff: Version comparisons prevent regressions during token updates—critical for teams with parallel designer and developer work.
- Portability: No installation or dependencies simplifies integration into any workflow—from small projects to enterprise solutions.
Tokens Dashboard transforms token management from drudgery into a strategic task. Instead of hunting for a needle in a haystack, developers get a system map with risk zones marked. This is especially valuable for multi-brand products, where token consistency directly impacts frontend stability. The tool has proven effective in projects with 500 to 10,000+ tokens, reducing design system maintenance time by 40–60%.
— Editorial Team










No comments yet.