Observability in Go: Choosing Between QueryTracer, Metrics, and OpenTelemetry
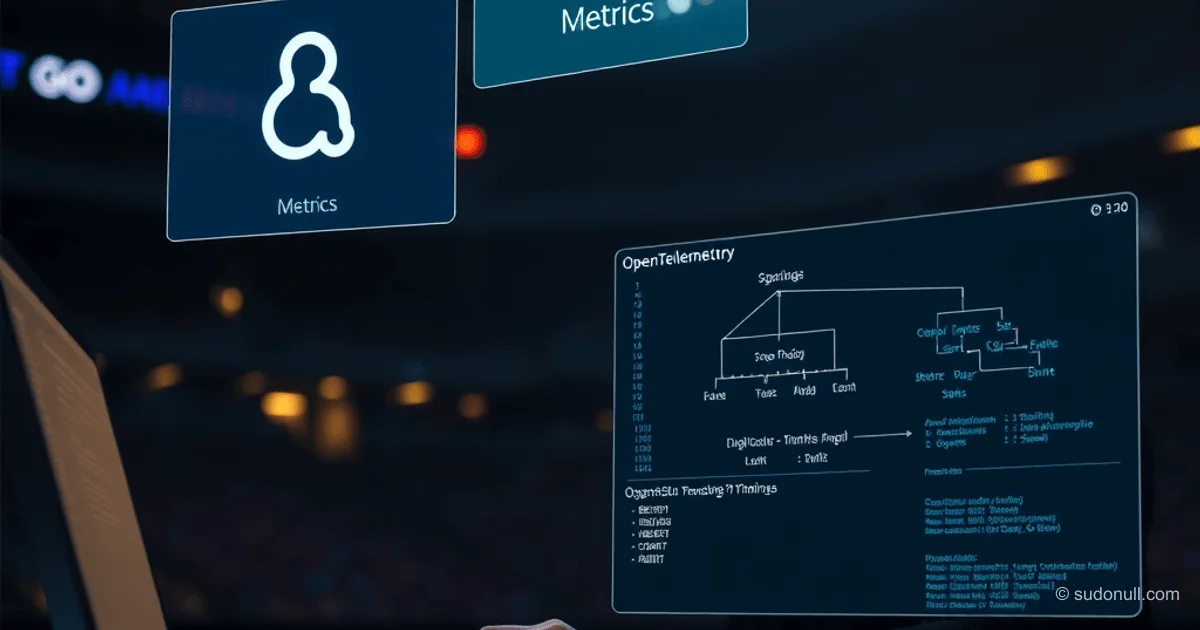
When integrating PostgreSQL into Go applications, developers often face a choice of observability tools. Metrics, QueryTracer, and OpenTelemetry solve different problems, but they're easy to confuse. Let's break down when to use each and how to avoid common pitfalls, based on a real-world case involving a decorator and transactions.
Three Levels of Observability: Metrics, Tracing, and Context
Metrics are the basic level of observability. They answer the question "what's happening": for example, a spike in errors after deployment or p99 endpoint response time jumping from 50 ms to 800 ms. Collecting metrics is cheap in terms of resources and enables quick anomaly detection. However, metrics lack context: they show that a query slowed down but don't explain why. Tracing is needed to answer that.
QueryTracer is an interface provided by the pgx driver for intercepting operations at the driver level. It generates separate events for each transaction stage: BEGIN, the query itself, and COMMIT. It's not a metrics collection tool but a hook where you can insert logic for creating spans, logging SQL, or collecting metrics. Importantly: QueryTracer itself doesn't send data — it just provides a mechanism to generate it.
OpenTelemetry (OTel) handles distributed tracing. A span is created at the HTTP request handler level and passed through the context (context.Context) down the stack: service, repository, driver. Each layer adds a child span, forming an execution tree. In a visualization system (e.g., Jaeger), you see the full picture: which specific DB query was slow and in what context. OTel runs continuously but uses sampling to reduce overhead: for example, only 10% of requests are traced. If a request is sampled, the full span tree is recorded.
Decorator Example: Where the Problem Hides
In typical projects, a decorator over the repository is used for metrics collection. Here's an implementation example:
func WithDBMetricsValueT any (T, error)) (T, error) {
    start := time.Now()
    result, err := fn()
    seconds := time.Since(start).Seconds()

    metrics.ObserveDatabaseQueryDuration(operation, seconds)
    if err != nil {
        metrics.IncDatabaseErrors(operation)
        return result, CheckDBError(operation, err)
    }

    return result, err
}
For methods that execute a single SQL query, the decorator works accurately: the metric matches the query execution time. However, in methods with transactions, things change. Consider this example:
func (r *BookingRepo) CreateBooking(ctx context.Context, b *models.Booking) (int64, error) {
    const operation = "create_booking"

    return WithDBMetricsValue(operation, func() (int64, error) {
        if err := r.validateBooking(b); err != nil {
            return 0, err
        }

        tx, err := r.db.BeginTxx(ctx, nil)
        if err != nil {
            return 0, err
        }
        defer func() { _ = tx.Rollback() }()

        var id int64
        err = tx.QueryRowContext(ctx, createBookingAtomicQuery, ...).Scan(&id)

        if err != nil {
            if errors.Is(err, sql.ErrNoRows) {
                return 0, models.ErrSlotOccupied
            }
            return 0, err
        }

        if err = tx.Commit(); err != nil {
            return 0, err
        }

        return id, nil
    })
}
The decorator measures the entire block's time, including validation, transaction start, query execution, and commit. The create_booking = 45ms metric doesn't reveal which stage takes 40 ms. Meanwhile, QueryTracer breaks the transaction into three separate events:
- BEGIN = 0.1ms
- INSERT = 40ms
- COMMIT = 2ms
This granularity is critical for diagnosing performance bottlenecks.
Implementing QueryTracer: Interfaces and Pitfalls
QueryTracer consists of interfaces in pgx, each for a specific operation type. For example, BatchTracer is used for Batch operations:
type BatchTracer interface {
    TraceBatchStart(ctx context.Context, conn *Conn, data TraceBatchStartData) context.Context
    TraceBatchQuery(ctx context.Context, conn *Conn, data TraceBatchQueryData)
    TraceBatchEnd(ctx context.Context, conn *Conn, data TraceBatchEndData)
}
Implementation requires creating a struct that satisfies these interfaces:
type MyTracer struct{}

func (t *MyTracer) TraceQueryStart(ctx context.Context, conn *Conn, data TraceQueryStartData) context.Context {
    // Query start: create a span or log
    return ctx
}

func (t *MyTracer) TraceQueryEnd(ctx context.Context, conn *Conn, data TraceQueryEndData) {
    // Query end: record time, send metric
}

// Attach to config
config.ConnConfig.Tracer = &MyTracer{}
Key pitfalls:
- If you don't implement BatchTracer, Batch operations will go unnoticed. No error occurs, but data is lost.
- For OTel integration, manually create spans inside QueryTracer methods and pass context correctly.
- QueryTracer doesn't replace metrics: additional logic is needed for aggregation.
Stack Comparison: sqlx, pgx, and Custom Solutions
Tool choice depends on the current stack and detail requirements. Here are three options:
- sqlx + otelsql
- Setup: One line of code.
- Pros: No driver change needed, basic tracing support.
- Cons: No Batch or CopyFrom support, no custom logic.
- Recommendation: Good for simple projects without complex DB operations.
- pgx + otelpgx
- Setup: One line of code.
- Pros: Full Batch and CopyFrom support, automatic span creation.
- Cons: Requires switching from sqlx to pgx.
- Recommendation: Best for new projects or migrations.
- pgx + MyTracer
- Setup: Manual interface implementation.
- Pros: Full control (custom metrics, advanced logging).
- Cons: High complexity, maintenance required.
- Recommendation: Only for specific needs not covered by otelpgx.
Important: In all cases, context (context.Context) must be passed through all app layers — from handler to driver. Otherwise, spans become root-level and lose ties to the original user request.
Key Takeaways
- Metrics show the problem but not the cause. Use them for monitoring, not deep diagnostics.
- QueryTracer is a tracing hook, not for metrics. It breaks transactions into stages for detailed analysis.
- OpenTelemetry requires proper context propagation. Ensure context.Context flows through all app layers.
- Decorators work for simple metrics but not transactions. Use QueryTracer or OTel for intra-transaction diagnostics.
- Stack choice: Stick with otelsql if using sqlx without complex ops. Switch to pgx + otelpgx for full visibility.
— Editorial Team









No comments yet.