Splunk 7.2 What's New? SmartStore, load management and more ...
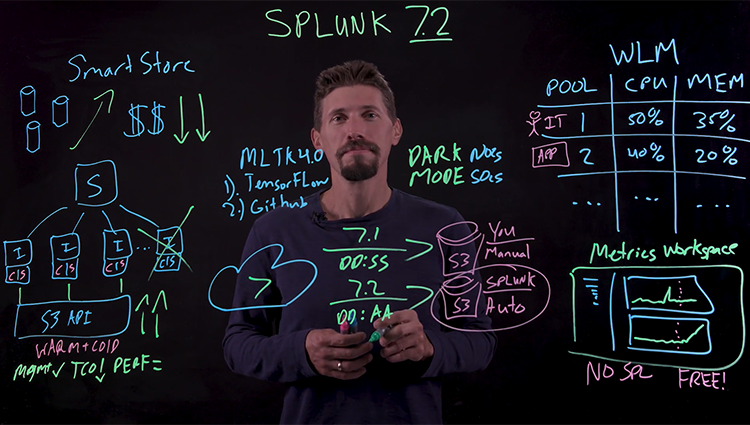
A few days ago, Splunk released a new release of its platform, Splunk 7.2, in which many innovations have appeared to optimize performance, including a new data storage scheme, administration of used performance and much more. See the details under the cut.
SmartStore
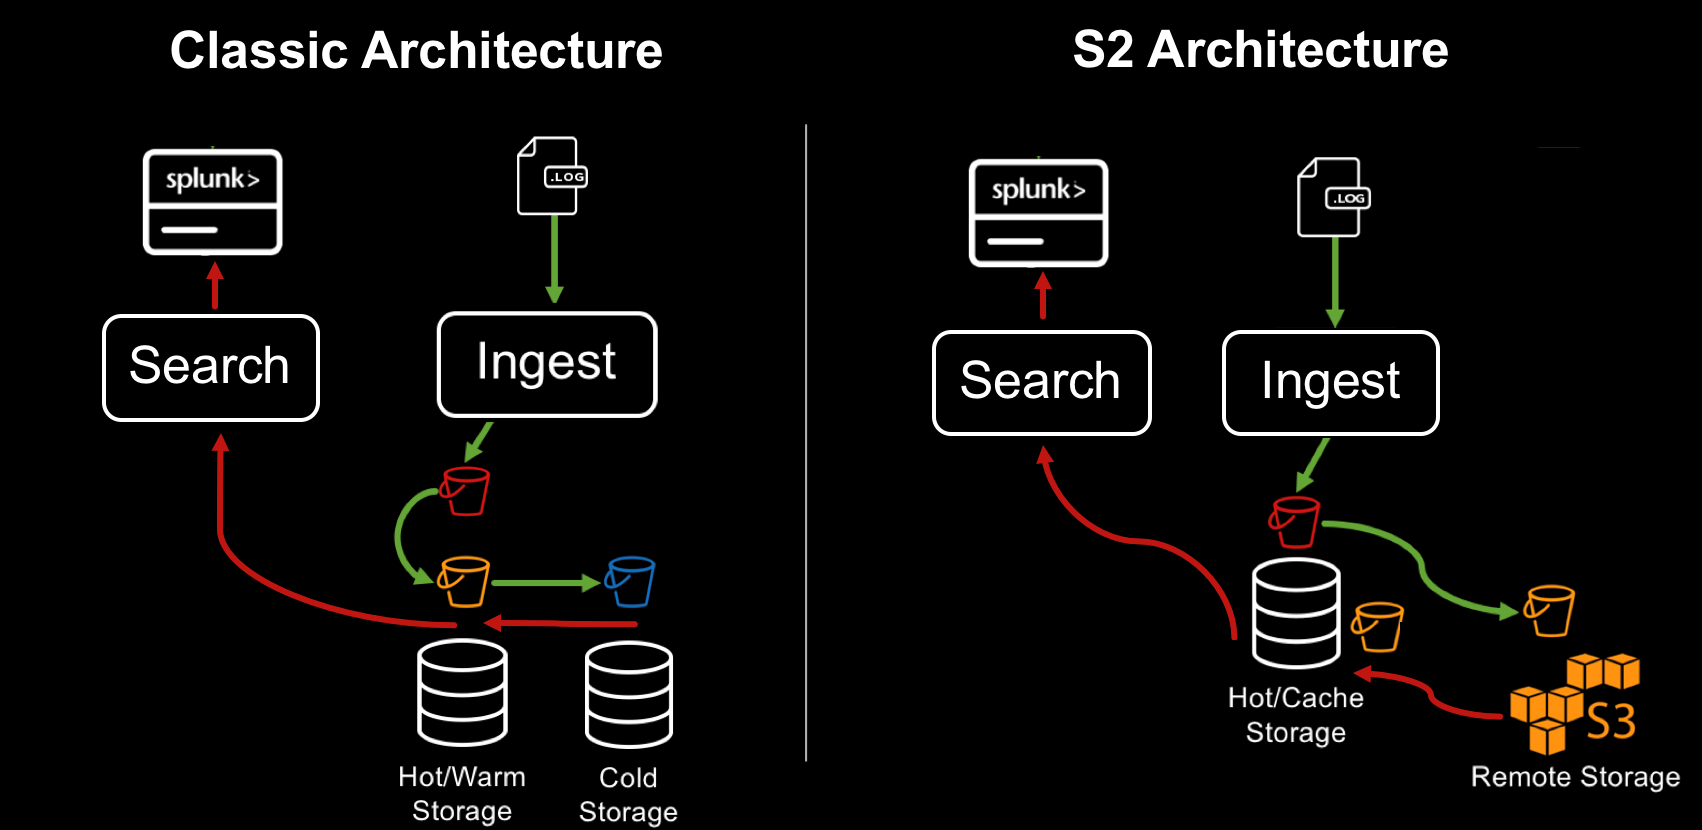
SmartStore is a new way to manage data warehouses in Splunk. Previously, all data was stored in indexers, it allowed the data to be easily accessible for processing. If necessary, expand the volume to the cluster was added a new indexer. This model is great for low and medium data volumes. When you add more data, you need not only more space, but more processing power. However, with exponentially growing volumes of data, the demand for storage exceeds the demand for the ability to quickly calculate. SmartStore allows you to host data both locally on indexers or on remote repositories. The movement of data between indexers and remote storage is controlled by the cache manager, which is located on the indexers.
With SmartStore, you can reduce the size of the indexer storage to a minimum and select the optimal computing resources for I / O. Most of the data is stored in a remote storage, while the indexer contains a local cache that contains a minimal amount of data: hot data, copies of warm data that have recently been involved in searches.
When is it better to use SmartStore?
- Infrastructure costs slow down scaling and limit data retention.
- Data archiving is not an affordable solution, as old data (~ 1 year) must be searchable.
- A large Splunk deployment, usually more than ~ 10 indexers.
- The majority (more than 95%) of requests are executed for the latest data (less than 90 days).
- Search queries for older data (> 90 days) are rare, and slow search performance is acceptable.
Workload management
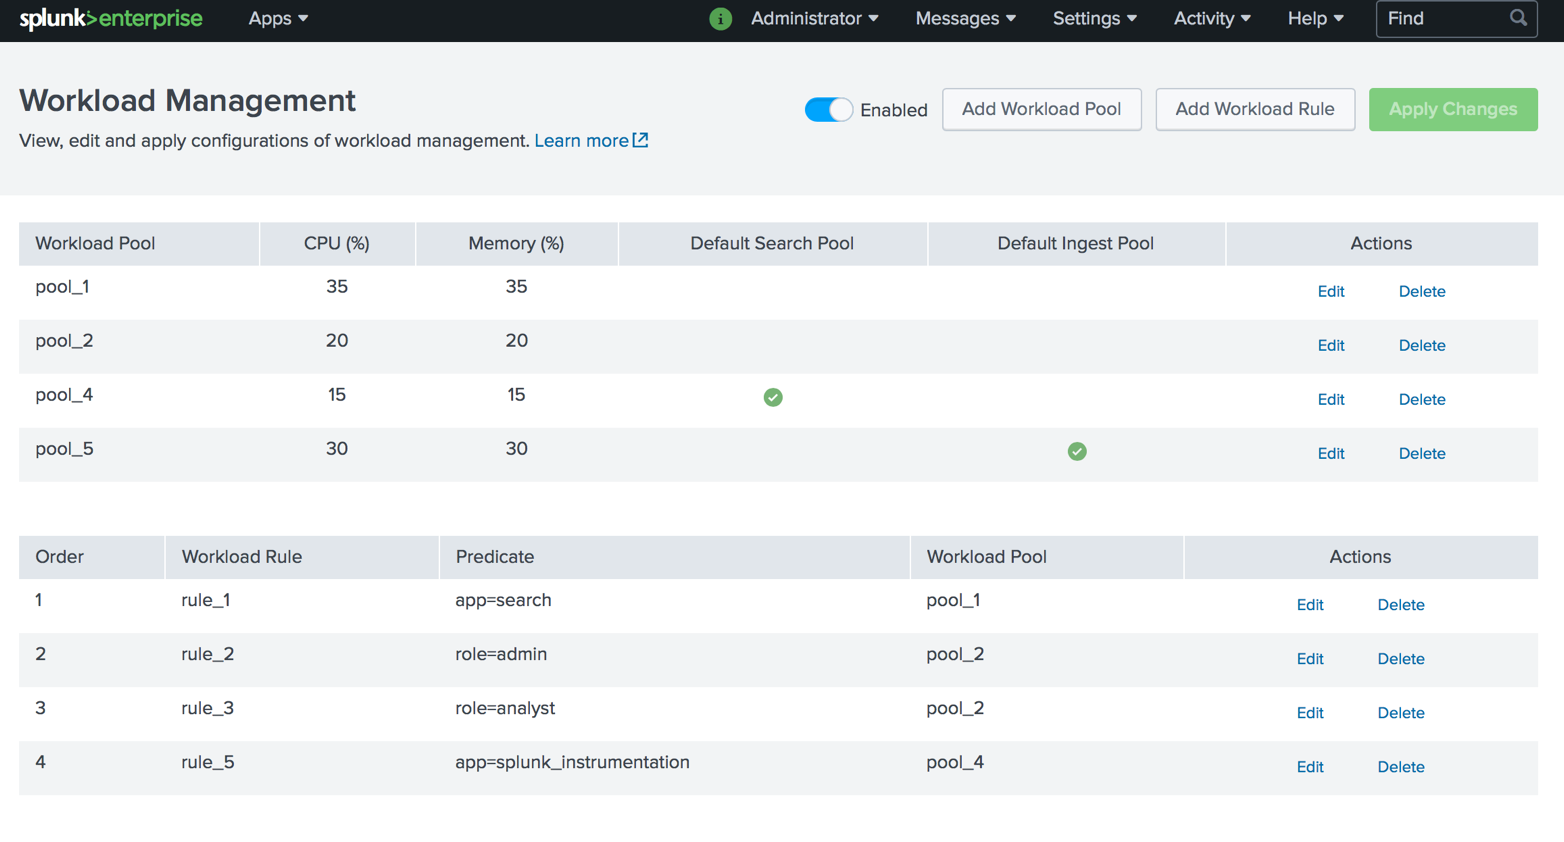
Workload Management is a mechanism based on a system resource reserve policy (CPU, memory) for downloading data and performing search queries in accordance with business priorities. This allows administrators to classify workloads into different groups and reserve portions of system resources (CPU, memory) per workload group, regardless of the total system load.
When is it better to use?
- To specify the priority of key requests and tasks;
- To limit the impact on the overall performance of heavy searches;
- To avoid delays when loading data due to resources spent on search.
Splunk real-time health monitoring
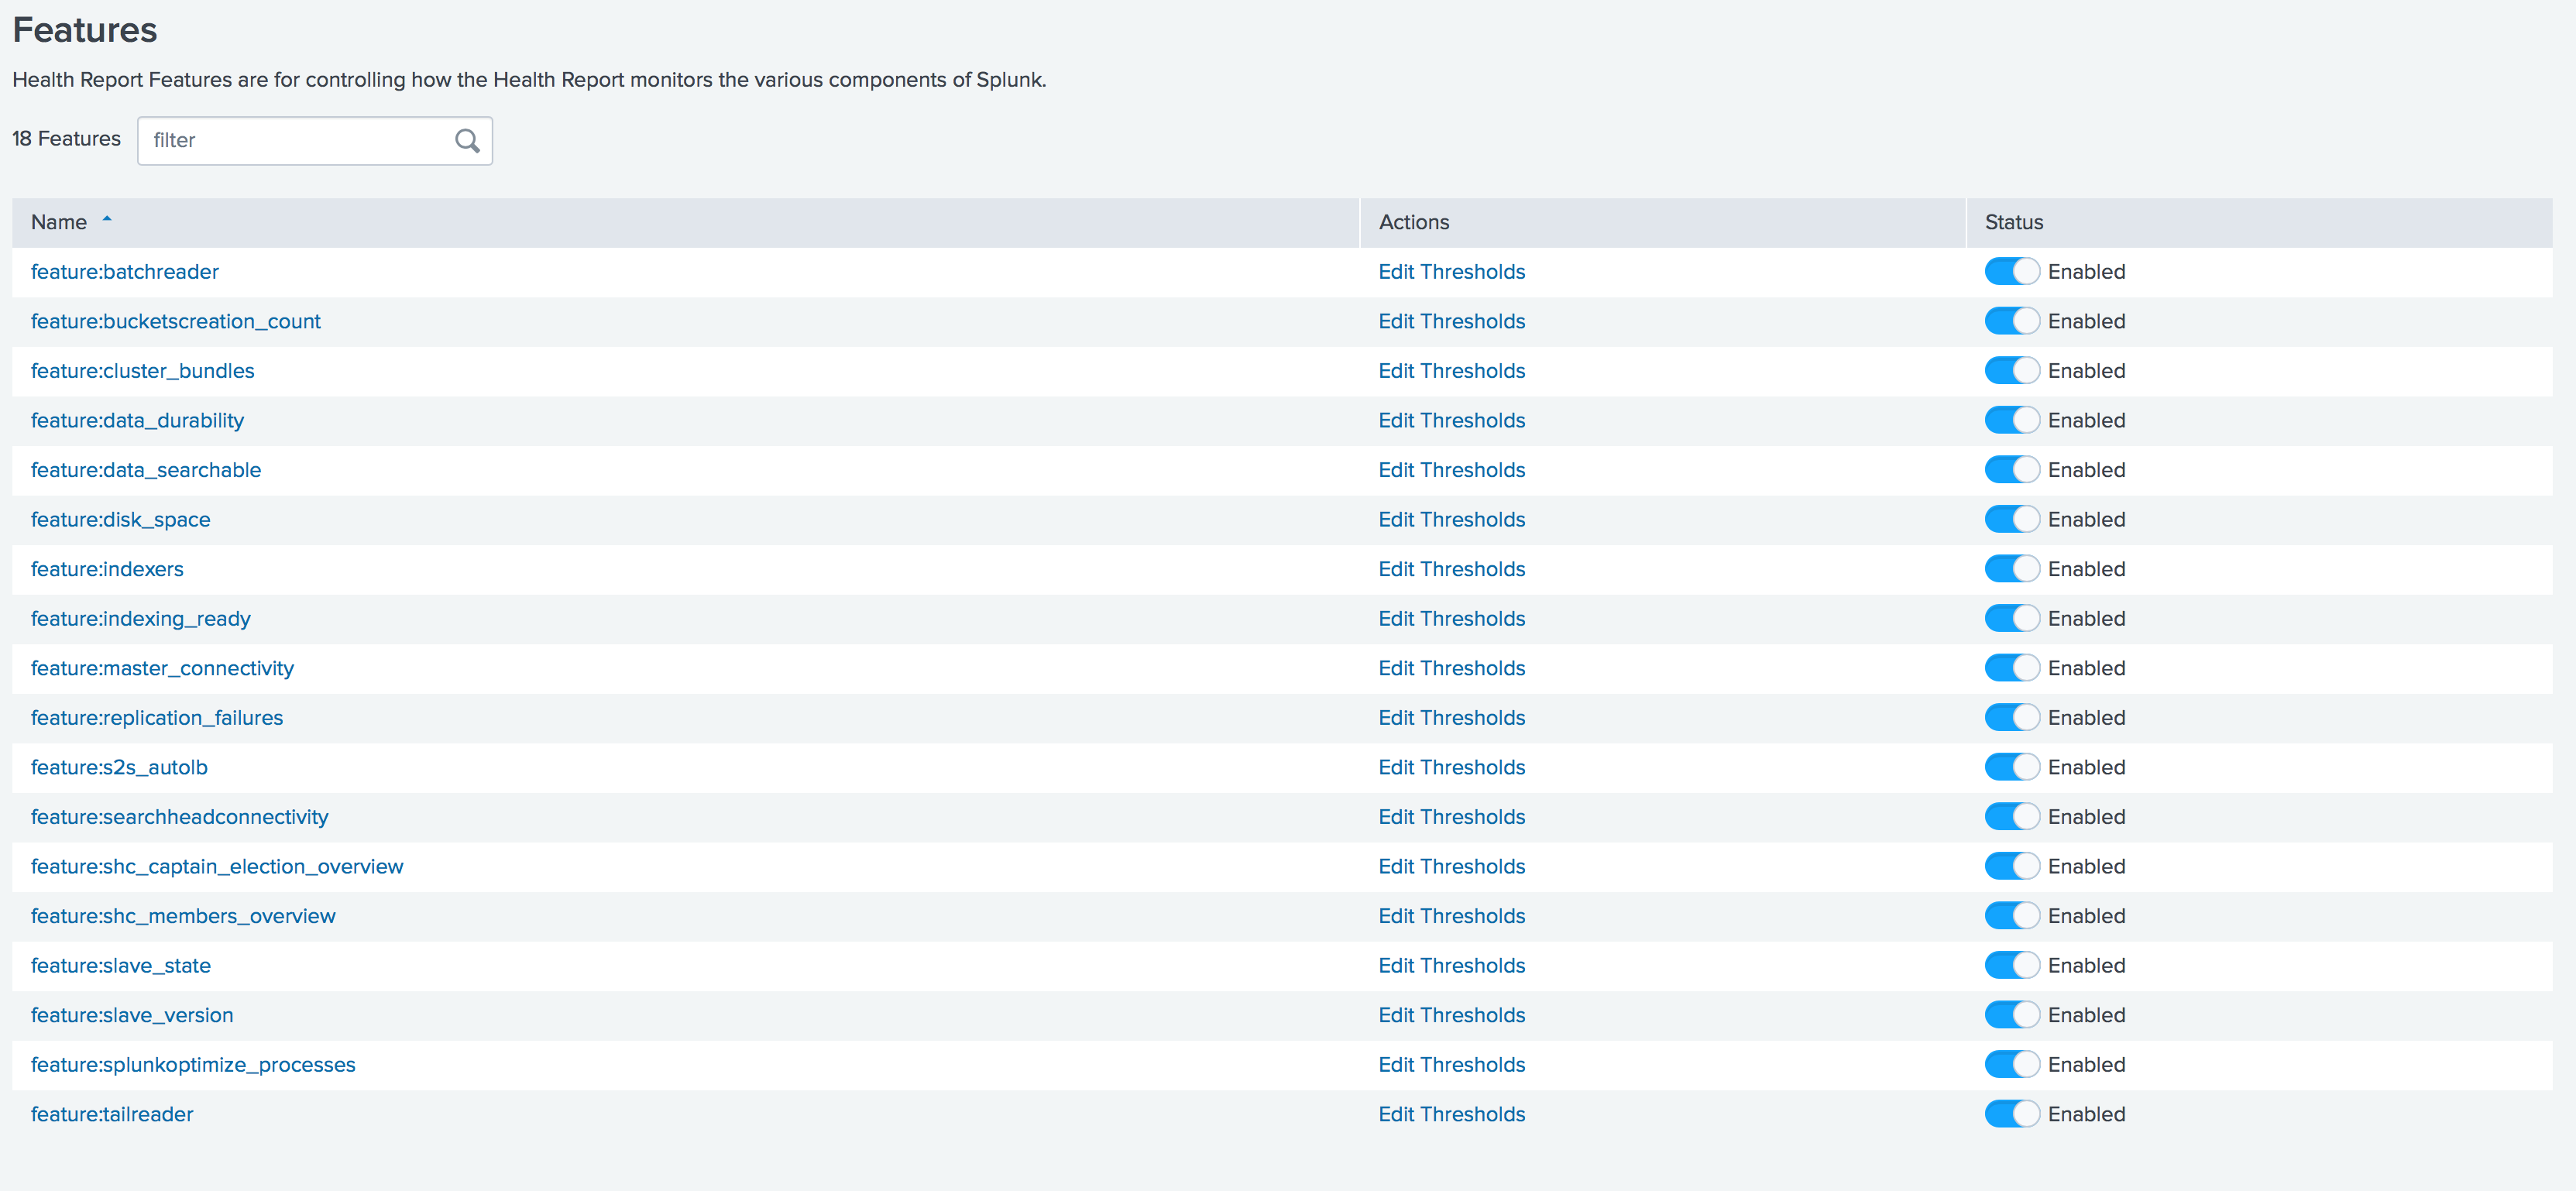
In release 7.2, Splunk health monitoring tools have been significantly expanded. A health report manager is now available, through which you can enable / disable functions and set thresholds for individual functions directly through the graphical interface.
You can also set up Splunk health alerts to email, Telegram, Slack, etc.

Metrics
Also, a new level out functions for working with metrics. First, a completely new tool for analyzing and monitoring metrics appeared without using search queries - Splunk Metrics Workspace . It provides an easy to use visual analysis interface. You can create interactive visualizations in the workspace, perform various analytical functions to get an idea of the indicators.
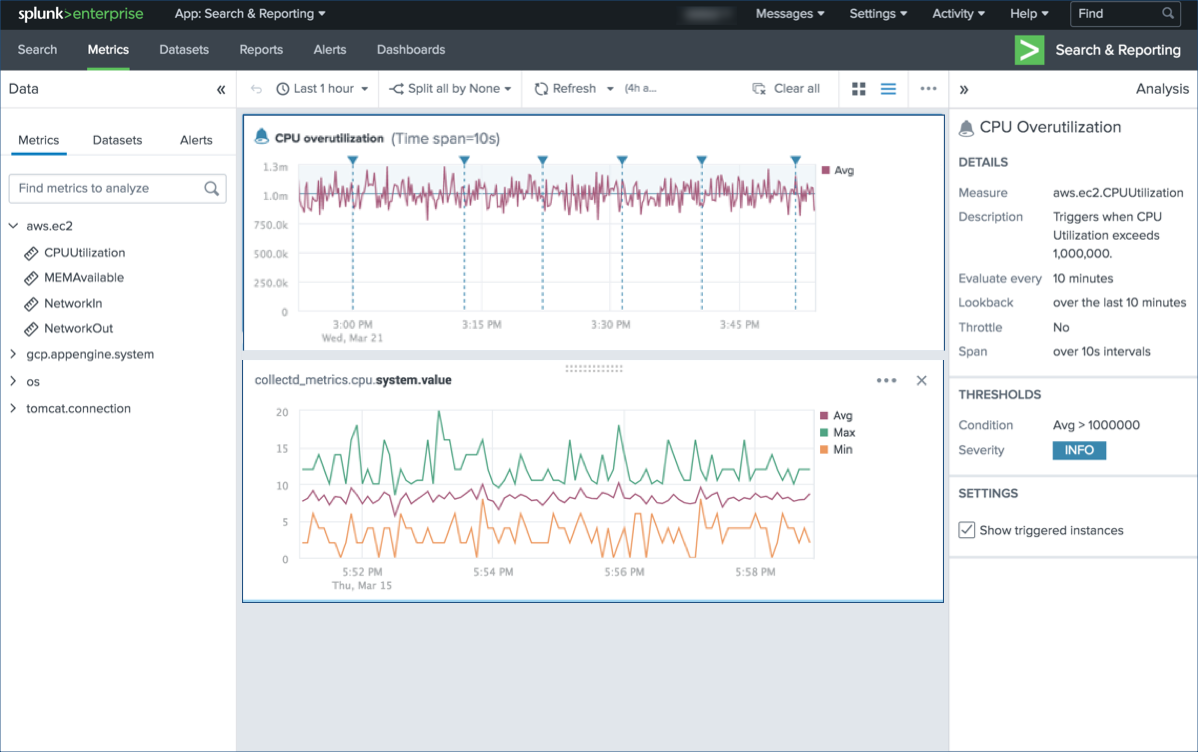
Analytical operations and functions:
- Aggregation
- Comparison of time - the imposition of the previous schedule on the current schedule.
- Separation - shows the results for a specific measurement.
- Filters - include or exclude certain results.
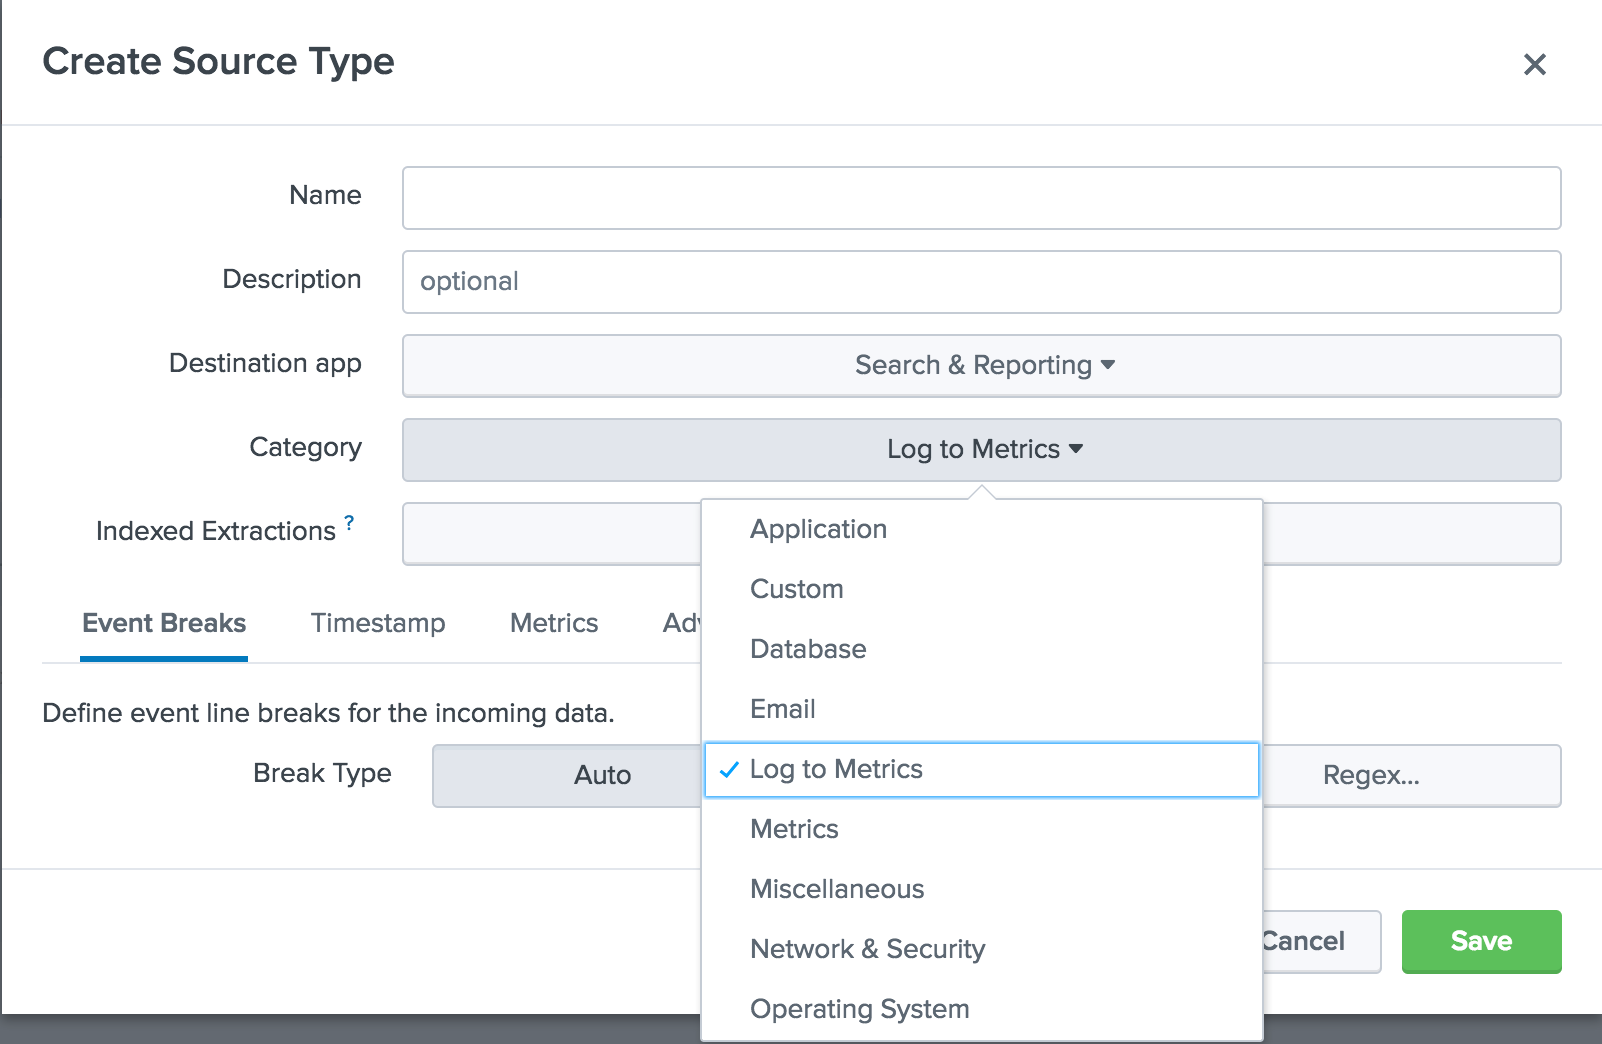
Secondly, the possibility of converting structured and unstructured logs into metrics. Previously, there were two main methods for receiving metrics in Splunk: using agents such as statsd and collectd, as well as creating and storing data using mcollect. The new Log to Metrics feature allows the Splunk platform to convert logs containing metric data to data points of discrete indicators. You can also define metrics that should be extracted as metrics, and create a blacklist of fields that should not appear in the metric data.
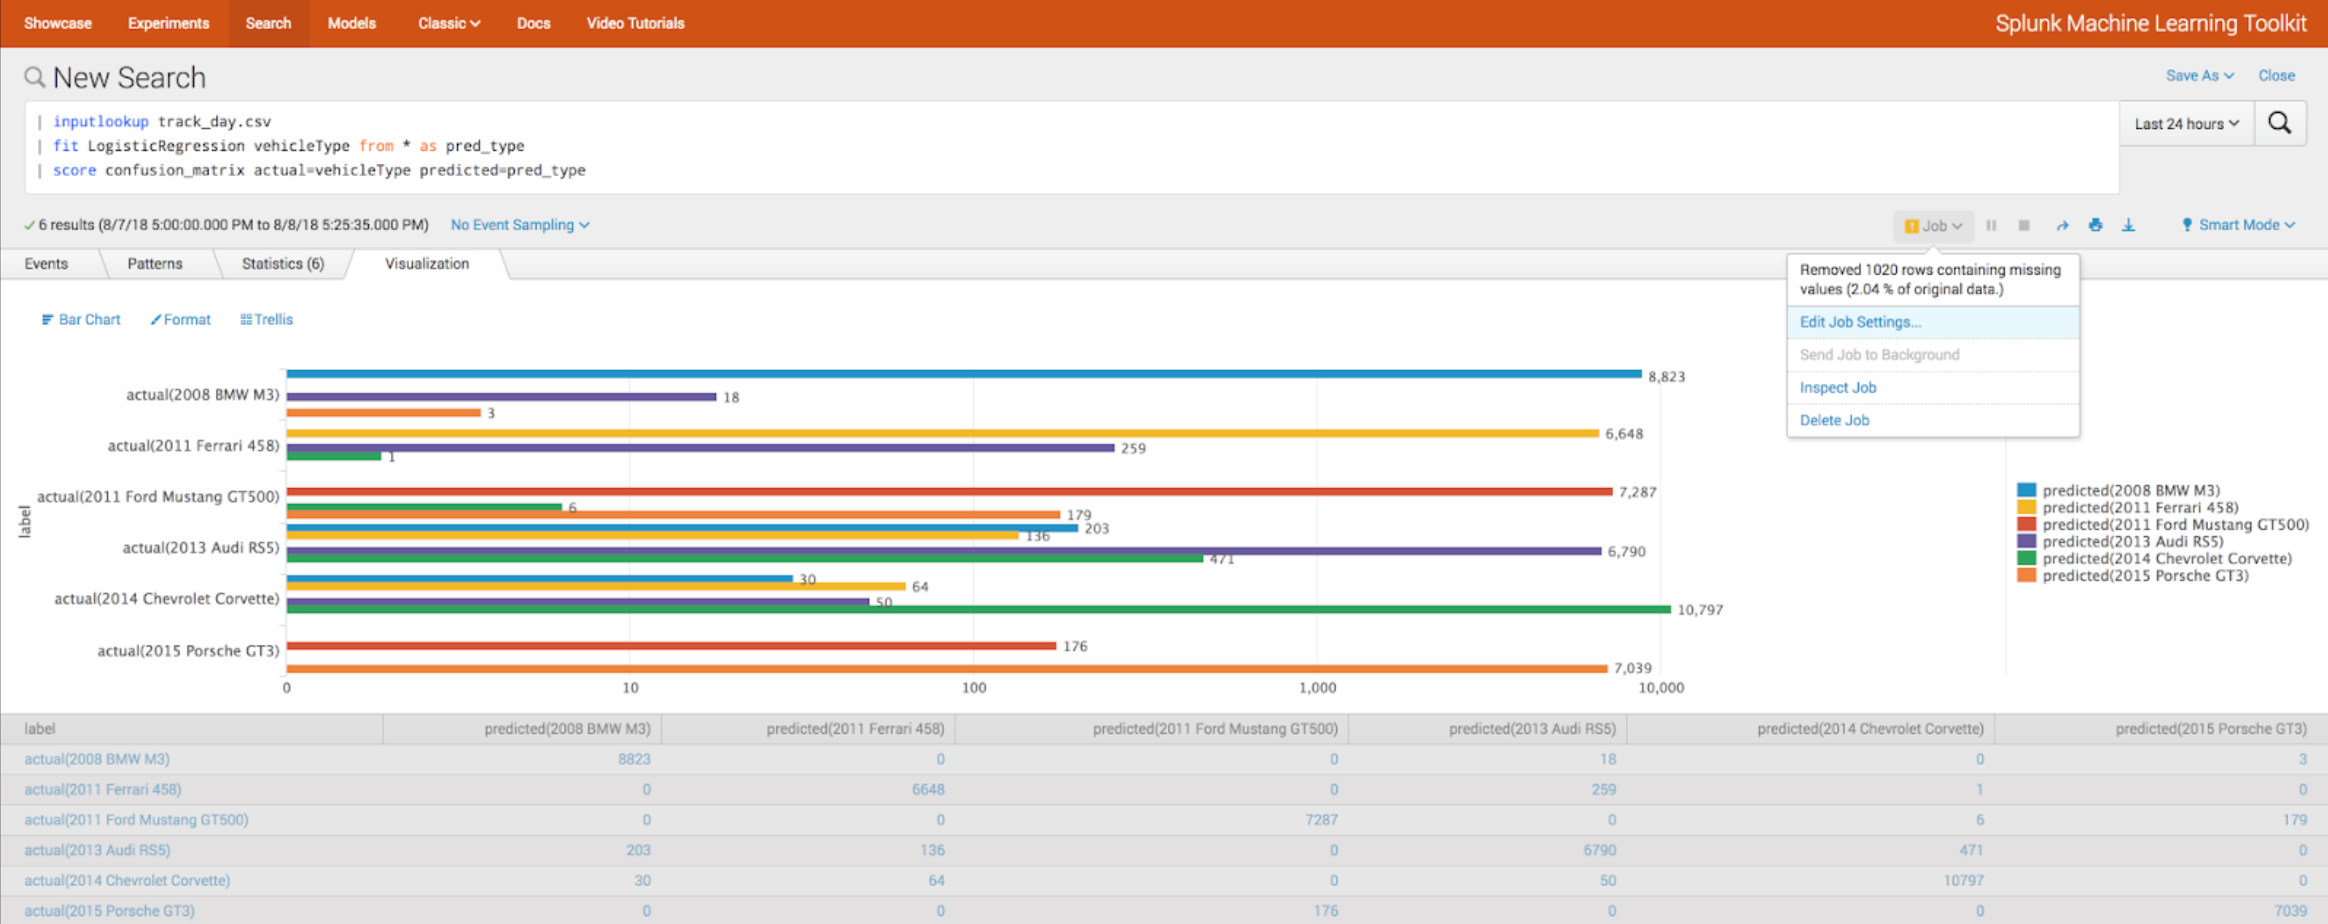
MTLK 4.0
With the new release of Splunk a new version of Splunk Machine Learning Toolkit is coming out. We wrote about previous MTLK releases earlier , but now let's see what's new now.
Integration:
- Tensorflow
- Apache spark
- Github
New algorithms:
- LocalOutlierFactor
- MLP Classifier
Algorithm Evaluation
- Score function
- Cross validation (kfold_cv parameter)
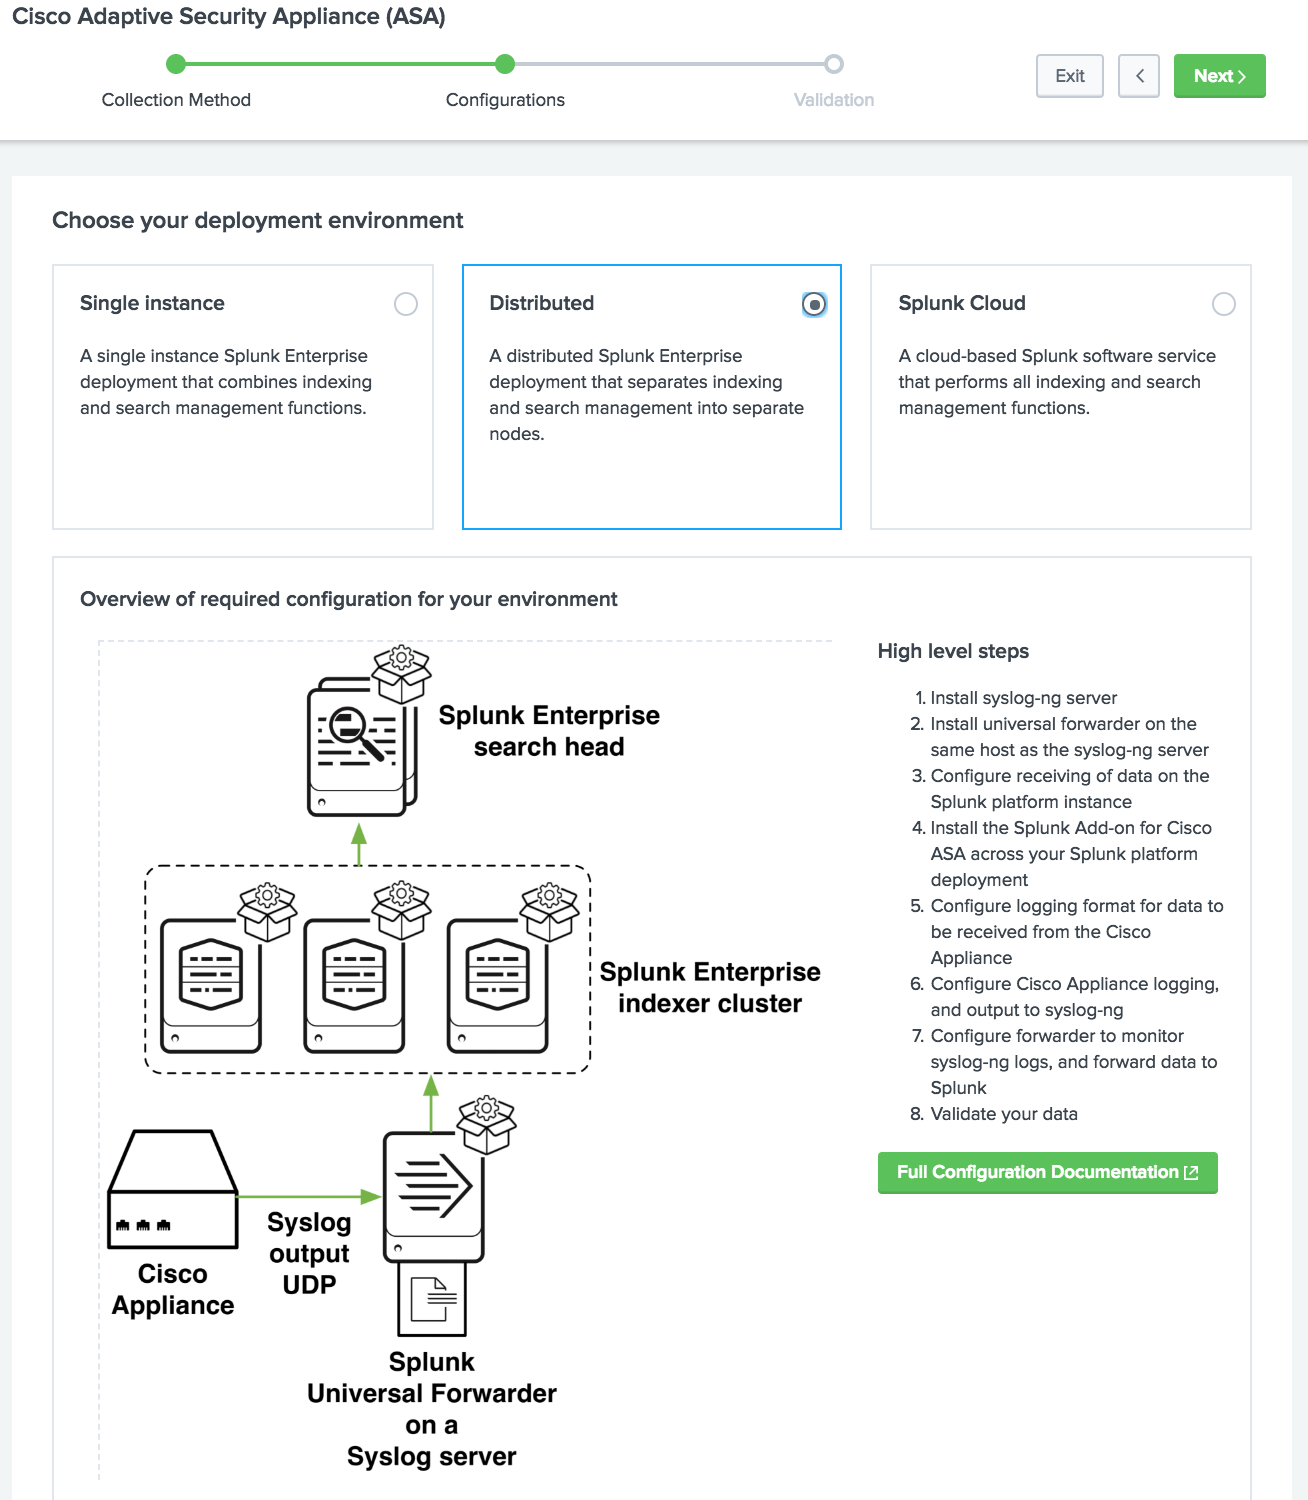
Managed Data Onboarding
A new graphical user interface with a data download guide that helps Splunk users understand the essential concepts of getting data from various sources in Splunk.
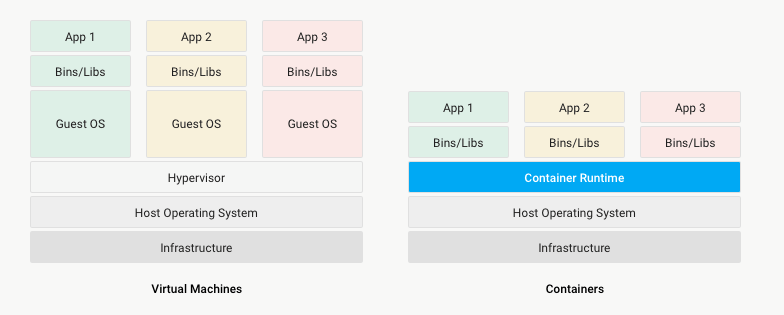
Docker support
With the release of Enterprise 7.2, Splunk users now have the ability to deploy Splunk in a Docker container. The container is a lightweight software package that combines application code along with the runtime environment, tools, system libraries, and environment settings necessary to run it. This allows you to abstract applications from the environment in which they run, isolate them from other applications, and simplifies scaling.
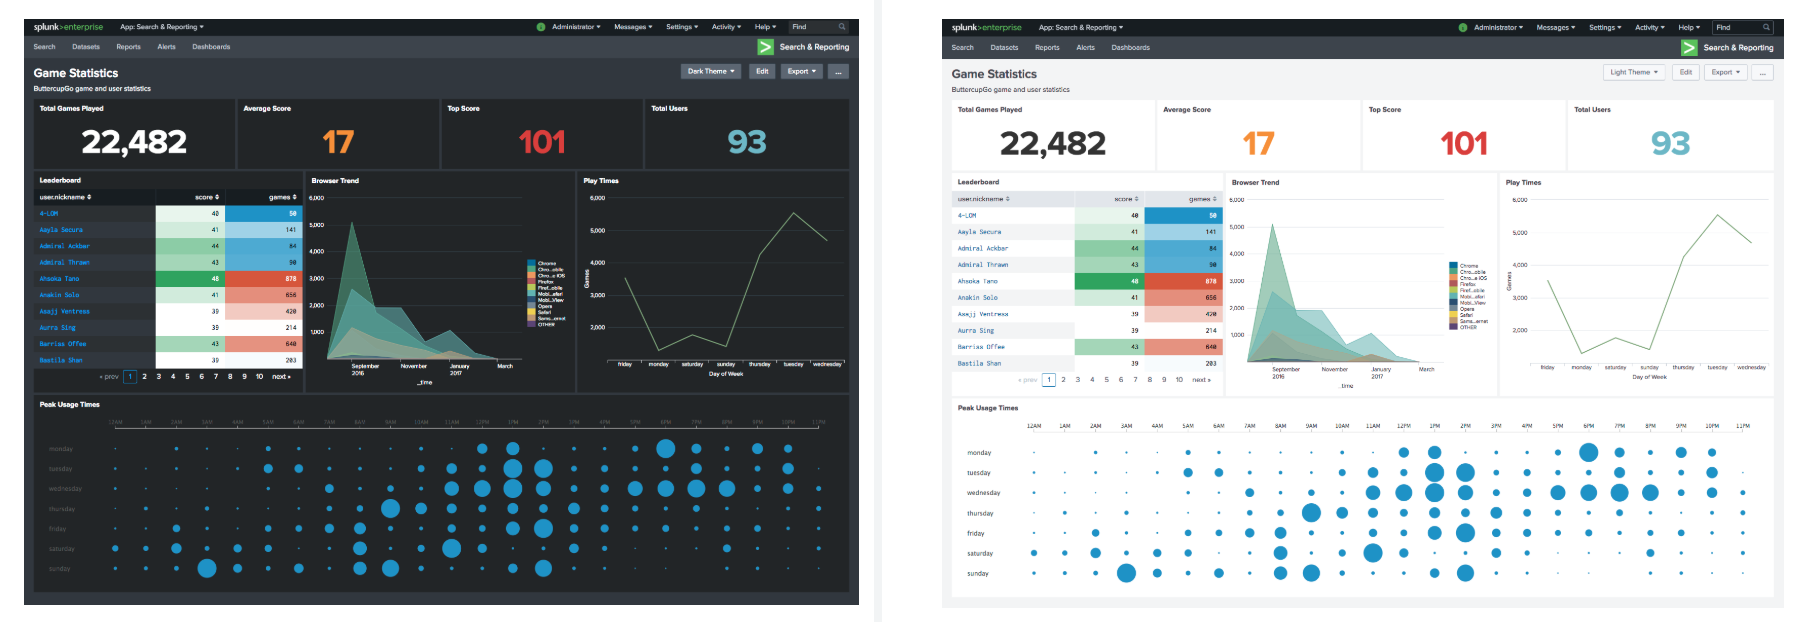
Dark interface
Yes Yes! Now you can use the dark theme developed by Splunk designers in their dashboards. Of course, earlier it was also possible to set up a dark background of dashboards using CSS, but in order for the theme to look normal, it was also necessary to select and add a color palette for all elements, which is quite a chore. Now this issue is solved by pressing a single button.
For the most in-depth study of all the new features, it is worth installing the Splunk Enterprise 7.2 Overview application , as well as watching the official release video .
If you still have not tried Splunk, then it's time to start, the free version up to 500MB per day is available to everyone. And if you have questions or problems with Splunk - you can ask themus , and we will help.
We are the official Premier Splunk Partner .