rfg_drawer or OTDR Editor
Introduction
Not so long ago I was transferred to the office, to the design and engineering department. I worked as a communications installer in one of the not-so-large organizations in the city. Then there was an increase to a more prestigious position in the organization - an optical fiber splicer. This whole action took place over 3 years.
During this time, we have built many facilities in the city and in the regions, including the whole cities entangled in the FTTH / FTTB network, so that we already had experience in the construction and maintenance of some documentation.
They transferred me to VET at the very peak of documentation, by the end of the year two large facilities were closed in different cities. They put me at the computer, explained what was missing, gave the data and determined the deadlines.
This is where the fun began.
Go
They gave me the most unpleasant task, it was necessary to make OTDR reports on all measurements that were carried out throughout the construction. Since there were two objects, and the OTDR was rushing here and there, we did not have all the measurements. There was also no input control carried out when the optical cable arrived at the warehouse before it was laid. What is usually done in cases when the train left and nothing is returned? They begin to rummage through old traces and look for data similar in length. There were not as many as we would like. I decided to search the Internet for program editors for reflectograms, such were found, but were paid. A lot of what I tried were ordinary Viewers, there were online simulators for the “production” of ref.
I dug for a long time on the Internet in search of the structure of the SOR file, it did not end with anything good. Here, purely by accident, in the OTDR View program from SVPRIBOR I discovered data export to a CSV file. And when I opened this file with Notepad, I was incredibly happy to see there:
0.000000; -17.723000
0.003267; -0.863000
0.006535; -0.863000
0.009802; -0.863000
0.013070; -0.863000
0.016337; -0.863000
0, 019604; -0.863000
0.022872; -2.445000
0.026139; -4.276000
...
4.982791; -21.518999
4.986059; -19.915001
4.989326; -22.038000
4.992593; -25.032000
4.995861; -39.894001
4.999128; -39.894001
These were the X, Y values for the graph.
It remains to do the small thing, take Delphi, the TChart component and draw a graph using the changed data. The data had to be corrected manually in Excel, but the result was not long in coming.
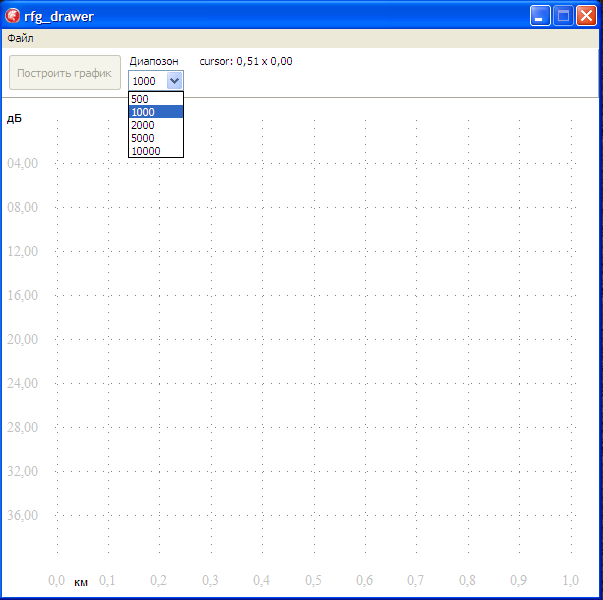
The main window of the program
Abilities
• Range selection;
• Downloading data in CSV, TXT format (both exported CSV and processed by CSV, TXT program);
• Saving data in CSV, TXT formats (for future changes);
• Saving in BMP format (for future use in OTDR report).
The result of the program

Total
In a short time, a program was written that could draw any trace of any complexity. Depended, of course, on imagination and certain standards and conditions.
I will not post the listing of the full program, there is nothing special and complicated in it.
Thanks for attention!