RFM analysis on the knee (Excel)
Good afternoon! In the summer of 2014, working as an ordinary analyst and suffering greatly from procrastination, he participated in the creation of an online clothing store. Having successfully “washed down” the management accounting system for this project , he found in the eyes of the owner a halo of the God of analytics in general, and Excel in particular)) Since then, the owner, being a clever man, albeit terribly lazy, has attracted me to solve all tasks that are more or less close to analytics. I want to share the result of one of these tasks. Under the cut, my RFM analysis implementation option. It will be interesting to owners of a small B2C business who do not have a significant research budget, as well as to everyone who is interested in the practical application of Excel in business.
Oftop: with an RFM tag on Habré only 2 articles, and both of corporate blogs. It’s strange why there is so little content on the subject, because on Habré there are a lot of people from e-commerce related area?
However, I quit pouring water and suggest, for starters, to agree on terms. Further, RFM analysis means the analysis of customer value for the company. In fact, a slightly advanced version of ABC analysis , only with a focus not on products, but on customers. The focus is on formalizing the size of each client’s benefit for the business. In order to identify this benefit, each customer is considered according to the following parameters:
R ecency - novelty (time since the last purchase)
F requency - frequency (frequency of purchases for the period)
Monetary - monetization (cost of purchases for the period)
Given :
1. History of sales of the online store in the form of .xlsx uploads, like

Sic! Do not look for meaning in the numbers, everything is semi-randomly changed by 1-2 orders of magnitude
2. TK from the owner, the full version of which sounds no more difficult than the phrase “Can you do RFM analysis?”
Result :
At first, spent half a day thinking “How to do it all using computed pivot table objects to make them beautiful. ” As a result, I scored for beauty and made it in an hour using an intermediate sheet and the usual formulas like "= IF", etc.
3. Intermediate calculations
To calculate the time since the last purchase, you need the current date (standard function in Excel = DATE ()) and the date of the client’s last purchase. Since the unloading was an unordered array of “Date-Client-purchase_amount”, it was difficult to identify the last purchase date for each of the customers. The problem was resolved by sorting the entire date range in the unloading (I ask you not to blame for the “collective farm style”, but at that moment I scored on beauty, because I wanted to quickly implement the solution in my head). Columns of initial information are marked in green. In the first line I left the formulas for understanding, and sorted them by column in descending order (the column was created using concatenation)

4. The components of the “Summary” sheet
Now we collect the result of the RFM analysis on one sheet. We start from the list of clients (sorting does not matter) - copy the list of clients from the first sheet and leave only unique records using the standard functionality (Data - Delete duplicates). In column B using VLOOKUP pull the date of the last customer order. The formula in column C counts the number of sales orders for the entire upload. Column D similarly considers the amount of customer orders. And column E calculates for us the number of days since the last purchase by the customer.
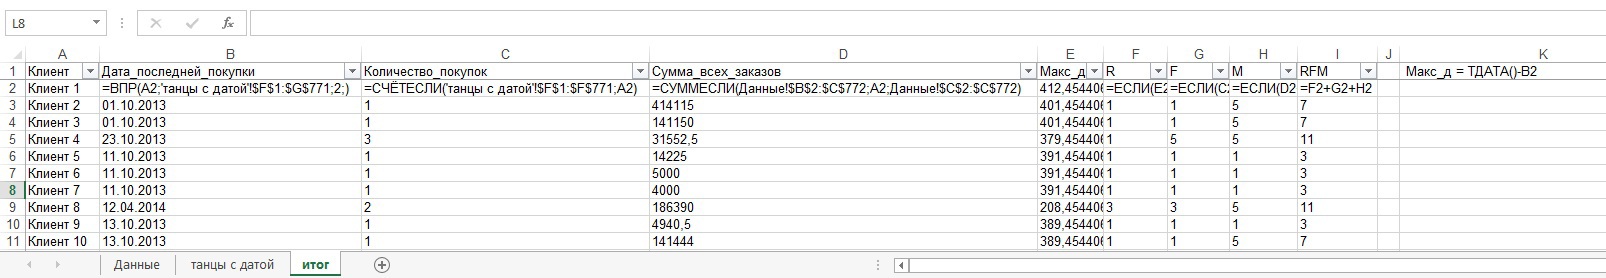
Sic! An example of the formula for column E is shown in cell K1, and only values are stored in column E to demonstrate the result
5. Recency (time since the last purchase)
The essence of the selected formula is as follows: we look at which of the five equal intervals from 0 to the maximum (highlighted in the formula in red) contains the value of each cell of column E and put a rating from 1 (a client who bought something from us a year ago) to 5 (a client who bought what or recently).

6. Frequency (frequency of purchases for the period) and Monetary (cost of purchases for the period).
The formulas are identical, so let's look at the example of Frequency. In this case, we divided the entire population into 3 equal to the number of members of the aggregate interval and look at which of these intervals the value in column C applies with ratings of 1 (the customer who purchases from us less often than others), 3, 5 (the customer who purchases from us more often than others )
For those who find it difficult or lazy to understand the definition of median on Wikipedia: the median is a value dividing the data set into 2 equal parts. Example: arithmetic mean value of 5 customers who made 1, 2, 2, 2, 100 purchases = 21.4 (the average temperature in the hospital that does not tell us anything); the median for the same series = 2.
Conclusion : I did not write about adding all the indicators together and sorting in the descending order of the rightmost column of the “Summary” sheet — I think it’s clear)) My goal - to create a system “on the knee”, was fully achieved . I give "as is . " Adding these lines, I understand that my definition of the median and the example are also not the easiest (for those who did not have mathematical statistics at the university). If anyone offers a simpler and more understandable option - I will replace it.
Oftop: with an RFM tag on Habré only 2 articles, and both of corporate blogs. It’s strange why there is so little content on the subject, because on Habré there are a lot of people from e-commerce related area?
However, I quit pouring water and suggest, for starters, to agree on terms. Further, RFM analysis means the analysis of customer value for the company. In fact, a slightly advanced version of ABC analysis , only with a focus not on products, but on customers. The focus is on formalizing the size of each client’s benefit for the business. In order to identify this benefit, each customer is considered according to the following parameters:
R ecency - novelty (time since the last purchase)
F requency - frequency (frequency of purchases for the period)
Monetary - monetization (cost of purchases for the period)
Given :
1. History of sales of the online store in the form of .xlsx uploads, like
Sic! Do not look for meaning in the numbers, everything is semi-randomly changed by 1-2 orders of magnitude
2. TK from the owner, the full version of which sounds no more difficult than the phrase “Can you do RFM analysis?”
Result :
At first, spent half a day thinking “How to do it all using computed pivot table objects to make them beautiful. ” As a result, I scored for beauty and made it in an hour using an intermediate sheet and the usual formulas like "= IF", etc.
3. Intermediate calculations
To calculate the time since the last purchase, you need the current date (standard function in Excel = DATE ()) and the date of the client’s last purchase. Since the unloading was an unordered array of “Date-Client-purchase_amount”, it was difficult to identify the last purchase date for each of the customers. The problem was resolved by sorting the entire date range in the unloading (I ask you not to blame for the “collective farm style”, but at that moment I scored on beauty, because I wanted to quickly implement the solution in my head). Columns of initial information are marked in green. In the first line I left the formulas for understanding, and sorted them by column in descending order (the column was created using concatenation)
4. The components of the “Summary” sheet
Now we collect the result of the RFM analysis on one sheet. We start from the list of clients (sorting does not matter) - copy the list of clients from the first sheet and leave only unique records using the standard functionality (Data - Delete duplicates). In column B using VLOOKUP pull the date of the last customer order. The formula in column C counts the number of sales orders for the entire upload. Column D similarly considers the amount of customer orders. And column E calculates for us the number of days since the last purchase by the customer.
Sic! An example of the formula for column E is shown in cell K1, and only values are stored in column E to demonstrate the result
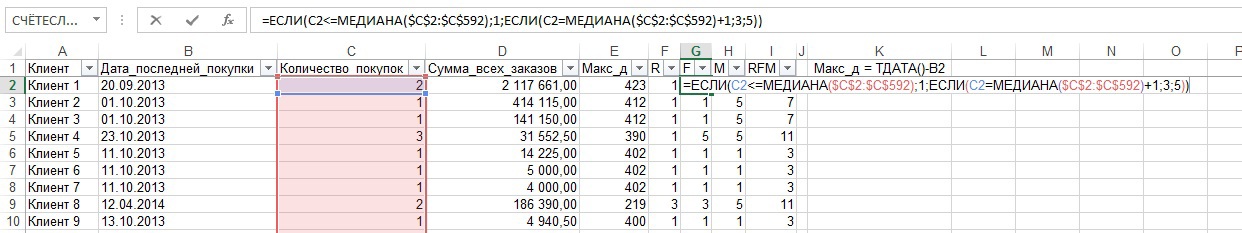
5. Recency (time since the last purchase)
The essence of the selected formula is as follows: we look at which of the five equal intervals from 0 to the maximum (highlighted in the formula in red) contains the value of each cell of column E and put a rating from 1 (a client who bought something from us a year ago) to 5 (a client who bought what or recently).
6. Frequency (frequency of purchases for the period) and Monetary (cost of purchases for the period).
The formulas are identical, so let's look at the example of Frequency. In this case, we divided the entire population into 3 equal to the number of members of the aggregate interval and look at which of these intervals the value in column C applies with ratings of 1 (the customer who purchases from us less often than others), 3, 5 (the customer who purchases from us more often than others )
For those who find it difficult or lazy to understand the definition of median on Wikipedia: the median is a value dividing the data set into 2 equal parts. Example: arithmetic mean value of 5 customers who made 1, 2, 2, 2, 100 purchases = 21.4 (the average temperature in the hospital that does not tell us anything); the median for the same series = 2.
Conclusion : I did not write about adding all the indicators together and sorting in the descending order of the rightmost column of the “Summary” sheet — I think it’s clear)) My goal - to create a system “on the knee”, was fully achieved . I give "as is . " Adding these lines, I understand that my definition of the median and the example are also not the easiest (for those who did not have mathematical statistics at the university). If anyone offers a simpler and more understandable option - I will replace it.