Who is following Habrahabr?
Hello, Habr!
A year has passed since my previous article, and my graphomaniac took over laziness and forced to publish another small study.
The title of the article, of course, is slightly hypocritical (but it sounds beautiful). It would be more correct to call it this way: "Who is subscribed to Vkontakte Habrahabr"
As you probably already understood, it became interesting for me to see who, where and how reads Habr, likes Habr, reposts Habr (however, the last two paragraphs did not fit into this article). And at the same time understand what cities, countries, universities, etc. the most "hardened" in VK.
Who cares to see the amusing charts, graphs and numbers about this, please, under the cat.

Warning .
First, a couple of warning lines. I am not a professional sociologist; I am not a professional SMM scholar or web analyst. I could overlook some things, I can call some concepts unprofessionally. For this, I ask you not to beat (at least in the face), but to point out inaccuracies and comments in the comments. As far as possible, I will supplement and correct. Thank.
Also, I draw attention to the fact that the sample under study is the audience of the public from the Vkontakte social network. This means that the user data in it may periodically change, they may be incorrect or inaccurate. Therefore, when I say, “Habr’s readers are 146% of 91-year-old men from the Isle of Man,” this is not the ultimate truth. This is just the information specified by users in the profiles.
And the last: in this article I do not test any hypotheses. This article is more of a review, so there will simply be graphs and diagrams, no verification of statistical significance, no regression models, no degrees of freedom and chi-squares.
UPD. 11/18/2014: it just so appears that Crimea and its cities appear on many graphs and maps. By default, in Google GeoChart it is assigned to the territory of Ukraine, in VK - to Russia. Please do not look for any of my intentions in attributing Crimea to a particular state, on all the graphs and maps I just left everything by default and unchanged. An active political position is good, but not in the form of srach in the comments on Habré.
Alright, pretty talk, let's get down to business.
Data downloaded using VK Api. They were uploaded to a self-written database, where I processed and analyzed the data. Initially, I wrote this database for the analysis of other groups and public pages of Vkontakte, but when work with them was finished, I could not resist and decided to analyze Habrahabr too.
However, this article is not devoted to the description of technical aspects of the process of obtaining data from Vkontakte. There are enough examples of working with VK Api on Habré, and even the design and development of the database is all the more not worth describing. If you suddenly have questions - write.
Also, if suddenly there are suggestions to analyze some other user parameters that I did not describe about in the article or to do some other publicity and groups in the same study, write in the comments.
The sample for the study is continuous, that is, the entire audience of the public. The data were obtained in October 2014, so they may differ (most likely, slightly) from the actual ones.
To simplify the story, hereinafter I will use instead of the phrase “subscribers of the public Habrahabr VKontakte” the words “readers of Habrahabr” or “subscribers of Habrahabr” (but what is it, in the context of this article I will simply say “subscribers”). Just remember that we are talking about "contactless" Habr readers.
First, look at the gender of subscribers:
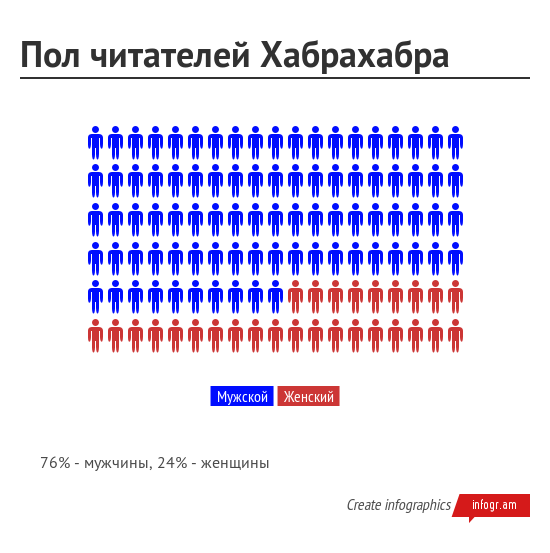
Chart 1. Distribution of subscribers by gender The
picture is quite logical. Habr is still a site for techies. Historically, there are more males among techies, and therefore there are more males among subscribers (despite the fact that in Vkontakte the ratio of men / women is approximately 53/47).
Let's look at the number of readers by age (took the range from 16 to 65).
But you will rightly notice: after all, active users of Vkontakte are mostly people up to 30-35 years old. True:

Graph 2. The general distribution of VKontakte users by age.
Therefore, on the graph I will give two lines. The first is the distribution of the number of subscribers by age in absolute numbers. The second is the "reference" distribution of subscribers, that is, how Habrahabr subscribers should be distributed by age, if they were distributed in the same way as all Vkontakte users as a whole.
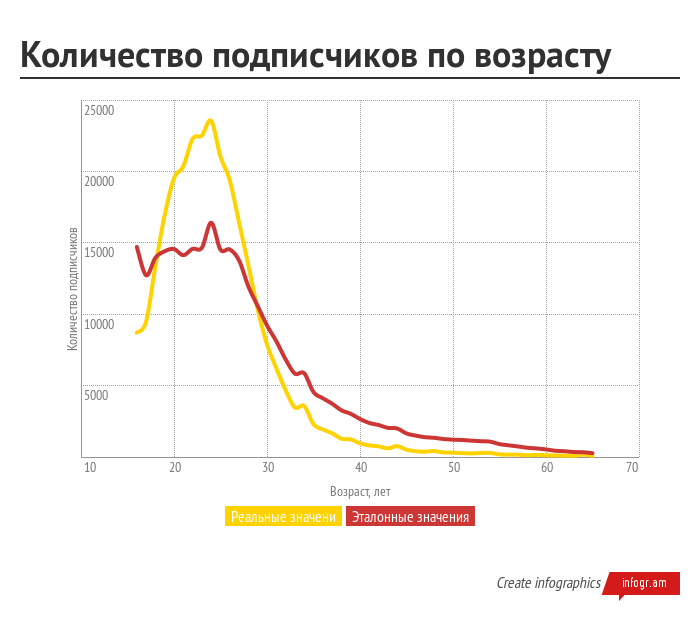
Chart 3. Absolute and “reference” values of the distribution of Habr’s subscribers by age
And to make it completely clear, I’ll give you a graph of the percentage of Habr’s subscribers to the total number of all Vkontakte users of this age:
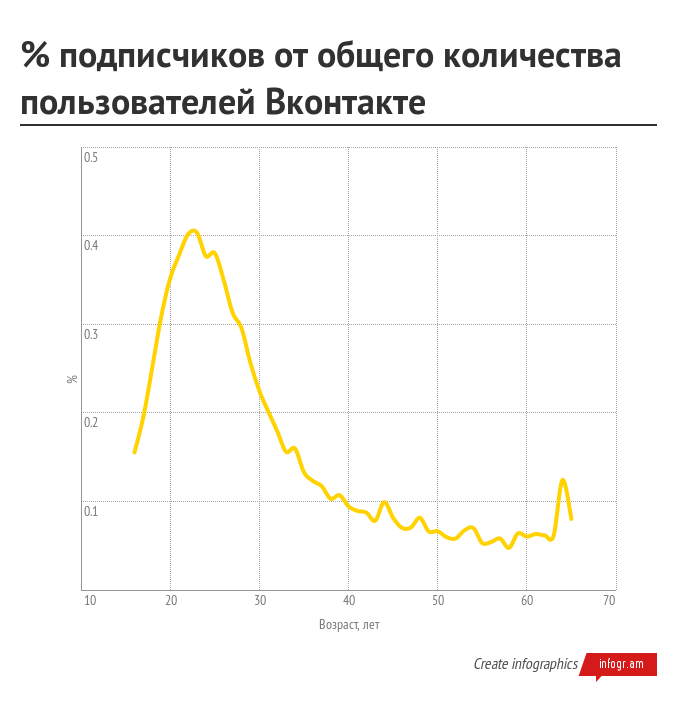
Graph 4.% of subscribers of the total number of Vkontakte users.
Quite a logical picture - the most popular Habrhabr VKontakte is used by 20-25 year-olds. The peak for 64 years is explained by the fact that by default Vkontakte is registered (or at least installed earlier) 1950 year of birth. But why such a jump is not on chart 2, I can’t explain.
Understood with age and gender, went to geography. For convenience, we divide the diagram into two different ranges (otherwise, nothing except the first four countries can be distinguished on the diagram). "Basic" of the country in which most subscribers:
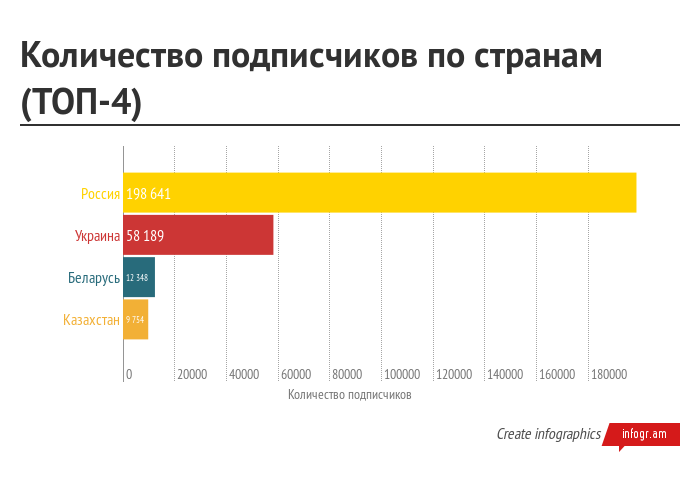
Figure 5. Countries with the most subscribers Habrahabr
and "Minorities" (limited to countries where there is at least 100 subscribers):
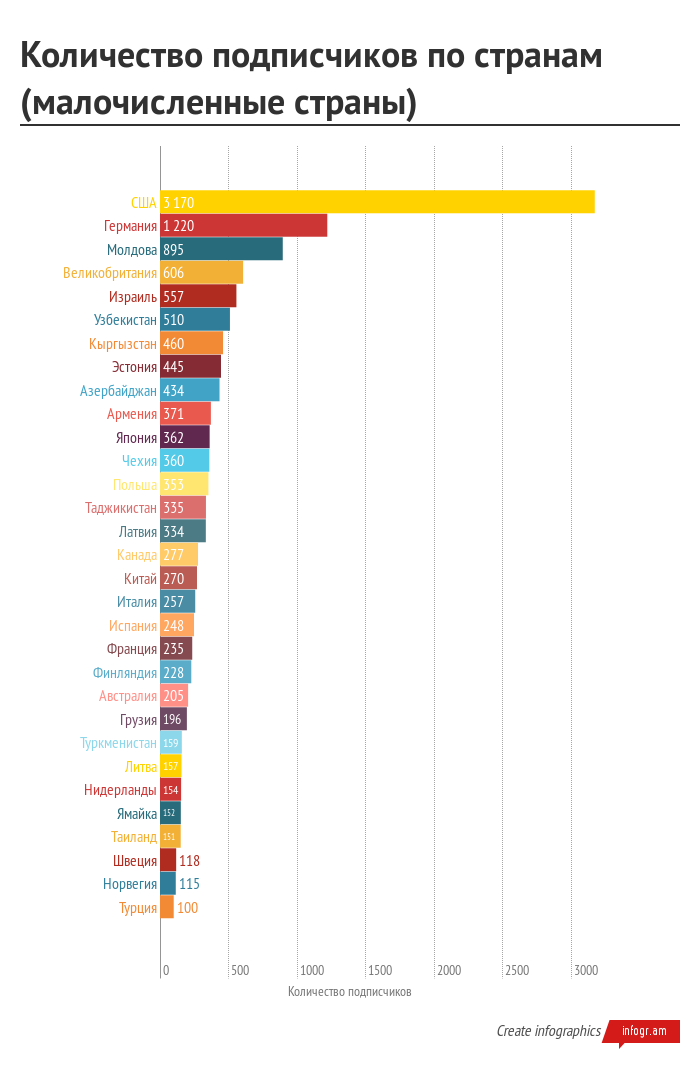
Schedule 6. "Secondary" country subscribers Habrahabr
logical question - in -first, where did I get that all those who indicated in their profile their hometown of New York really live in the USA, and not in some New Vasyuki? No way. Do not check it in any way (at least in a simple way), so you have to take a word.
Secondly, Russian language site Habrahabr. It is logical that it will be popular primarily among Russian users. But Vkontakte social network is popular mainly among Russian-speaking people. These are either residents of the ex-USSR, or emigrants, if we are talking about distant foreign countries. Therefore, let's apply the same technique as with age. Let's look at the percentage of subscribers to the total number of Vkontakte users from a particular country (hereinafter I will call this ratio the “normalized percentage of subscribers” to save time and time. Perhaps in the SMM sciences there is some kind of correct term for this concept - if is, then tell me).
We look at the chart and see interesting things:
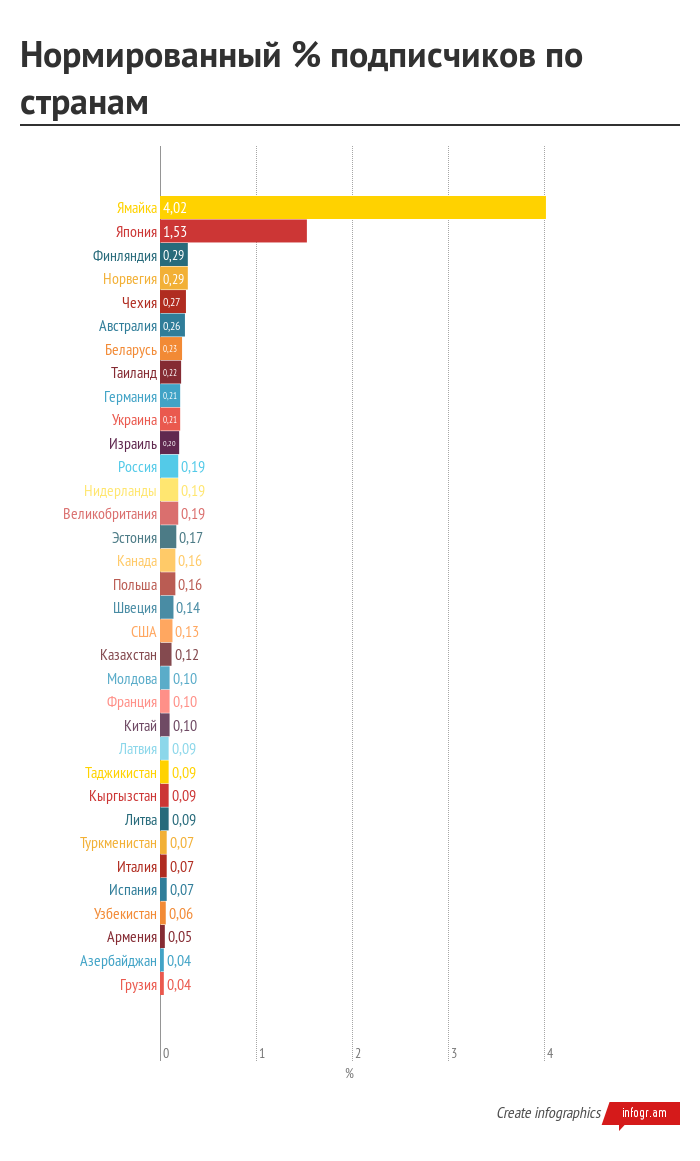
Chart 7. Percentage of subscribers to the total number of Vkontakte users by country
Surprising Jamaica and Japan. I suspect that anime and ahem are involved here ... let there be reggae music. Just look at the avatars of subscribers from Japan :)
In general, I will allow liberties and exclude them from our list as results that are suspicious.
Lyrical digression
By the way, VK has an interesting bug or feature, which is probably familiar to experienced VK API users, but for me it was an opening and made me a little nervous.
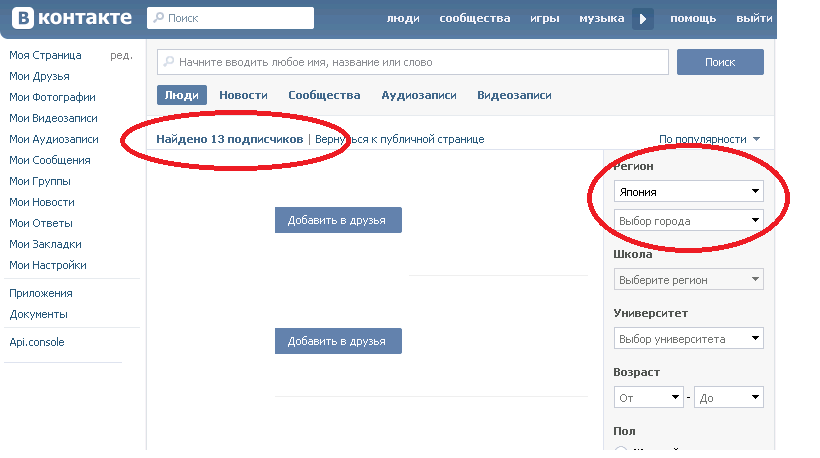
If we just search for people from Japan among the subscribers, we get only 13 people:
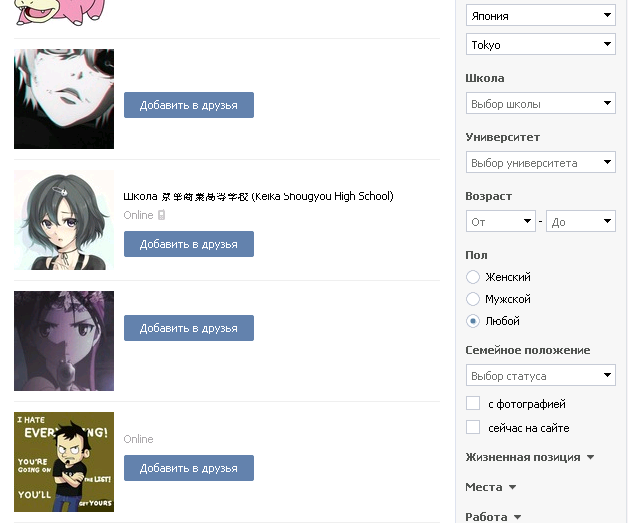
However , if we also indicate the city, we get a completely different picture:

Therefore, I studied country information based not on group searches, but on data directly from user pages .
Having removed these two wonderful countries, we get:

Chart 8. Normalized% of subscribers (without Japan and Jamaica)
The most interesting thing here is that neither Russia, nor Belarus, nor Ukraine fall into the top three.
Russia, however, shares its line with the Netherlands.
If Japan, Jamaica, or, for example, Honduras, we like to indicate as a country of residence "purely for fun," then it is difficult for me to suspect that they are doing the same with Finland or Thailand. In this regard, I suppose that, most likely, these are really subscribers living in these countries. Why then is Russia only in the middle of the list? I suppose the whole point is this: who goes abroad and at the same time actively uses social networks? I think that to a large extent highly qualified specialists in the field of IT, whom God himself ordered to be interested in Habr. So it turns out that, on average, Habr is more popular among Russian-speaking people living abroad than actually in Russia.
If you look at Europe (without the countries of the ex-USSR), then the Habr’s popularity map (countries with more than 100 subscribers are taken into account) will look something like this:
The following couple of paragraphs up to the section “Geography. Cities ”- my lyrical considerations on the topic of a search for a possibly not very interesting and not very existing relationship. To whom it is not interesting - we are scrolling immediately further.
Let's give a little more geography and economics. Let us turn our eyes to where the situation should be simpler, namely, to the countries of the ex-USSR. The overwhelming majority of the Russian-speaking population here, so you can evaluate the popularity of Habr on VKontakte with a lesser degree of mistrust.
It’s not very interesting to look at the countries of the ex-USSR just like that, I want to understand why in a particular country interest in Habr is higher. It will be logical to assume (hell, I still could not resist the hypotheses, although I promised at the beginning) that the higher the level of development of information and communication technologies (ICT index) in the country, the more there is interest in sites of such subjects (read, to Habr ) Information on ICT is taken from here (no data on Tajikistan, Kyrgyzstan and Turkmenistan).
First the graph:
Graph 9. The dependence of the normalized% of subscribers on the ICT index.
I don’t even know what to say here. I planned that there will be a strong correlation, and I, playing the role of Captain of Evidence, will simply voice this fact. However, the dependence, frankly, is not so hot (Pearson's correlation coefficient, for example, will be about 0.5). Ukraine stands out very much. The first thought was that in Ukraine all interest in Habr is concentrated in only a few cities or regions, which causes such a gap. However, if you look at the map of Ukraine, we will see that the normalized percentage is distributed fairly evenly: I
expected to see a different picture in absolute numbers, but here everything is more or less even:

So either the ICT index is biased, or the people of Ukraine are interested in Habré despite its low value, or it really has nothing to do with it.
By the way, if for the sake of interest to build a schedule similar to schedule 9, for all countries (except Japan and Jamaica), we get almost the same picture:

Figure 10. The dependence of the normalized% of subscribers on the ICT index (for all countries).
Let's go the beaten path. We will study the percentage of Habr’s subscribers to the total number of Vkontakte users from this city. We will consider only those cities in which the number of subscribers is more than 10.
For starters, for the solemnity of the moment, let us look at the world map. The points indicate cities where the number of Habr subscribers is more than 10. Some cities might not get on the map due to the mismatch between the city names in VK and the Google Chart API - I was too lazy to manually edit hundreds of names, so sorry, the main thing is that the scope is clear!

Well, do not forget that this is all just data from the social network, and not from the passport page. So, perhaps, all those who indicated "Melbourne" actually live in my native Dolgoprudny.
By the way, I mentioned my hometown for a reason. Look at the TOP-30 of Russian cities by the percentage of Habr subscribers:
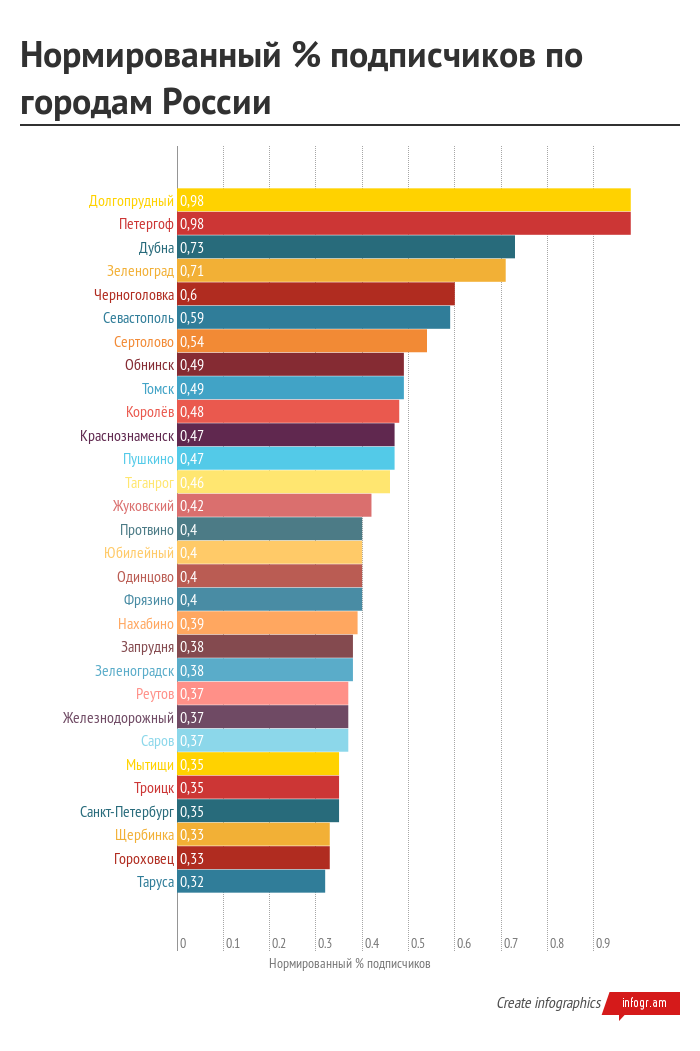
Chart 11. Normalized% of subscribers by Russian cities. TOP-30
Such pride for my hometown I experienced the last time a couple of years ago, when FC Dolgoprudny won the third division of the Russian Football Championship. I honestly didn't push anything. I can still make an accidental mistake or some feature of the behavior of VKontakte, which “palm off” more data in the search from your city, but it’s also unlikely.
I suspect that this indicator is explained by the large number of students at the Moscow Institute of Physics and Technology (we’ll go further).
If you look at the same diagram, but around the world, the picture will be more fun:
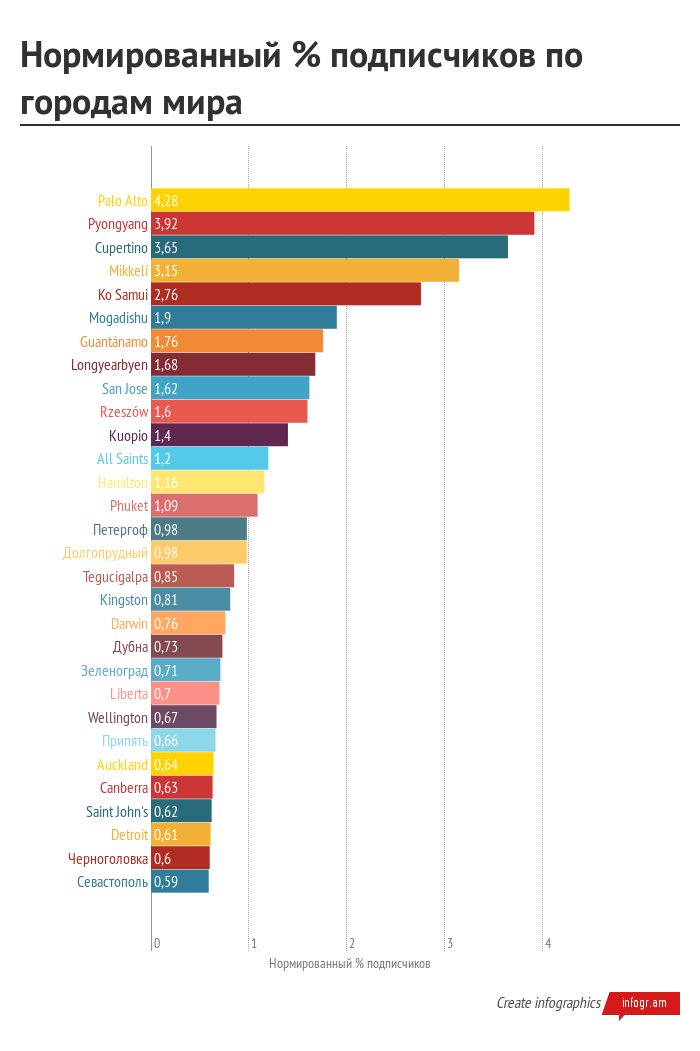
Chart 12. Normalized% of subscribers by world cities. TOP-30 I
suspect that the data is not very reliable. But, at least, it’s clear where many Habrach residents would dream to live :)
I’m probably already tired of you with geography. Let's move on.
First, let's take the TOP-30 by the absolute number of subscribers (many universities are hidden by privacy settings, so do not be surprised at the small absolute numbers):

Chart 13. Number of university subscribers
No surprises in my opinion. Now, let’s look, as always, at the normalized percentage of subscribers:
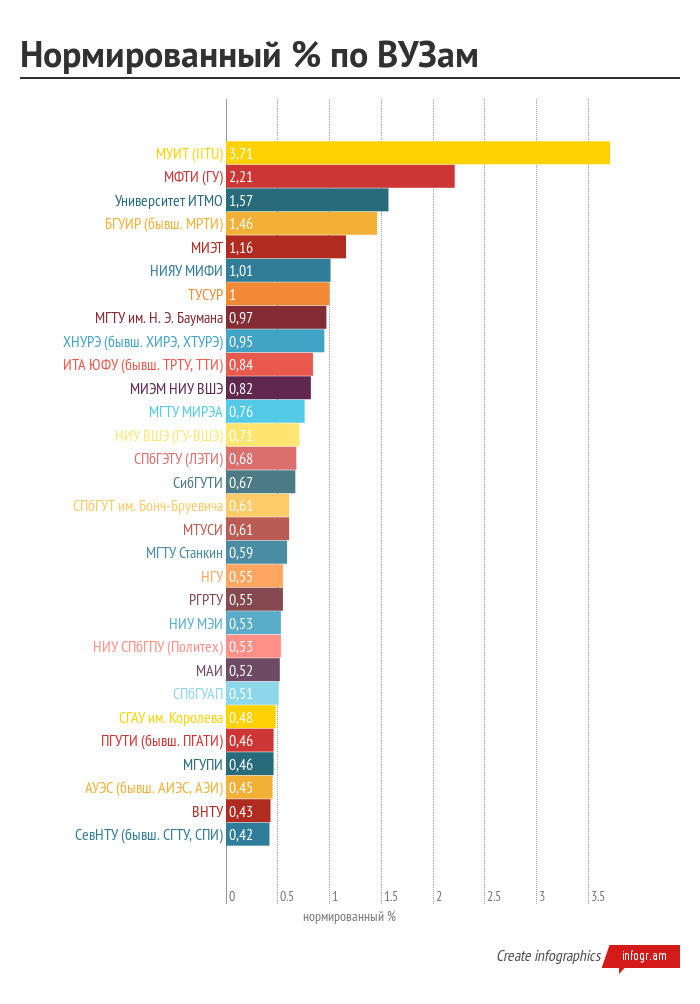
Chart 14. Normalized% of subscribers by university It is interesting
that Kazakhstan is in the first place. Of the Russian universities, as I expected above, MIPT is the most inveterate.
A couple more charts that I could not help but make:
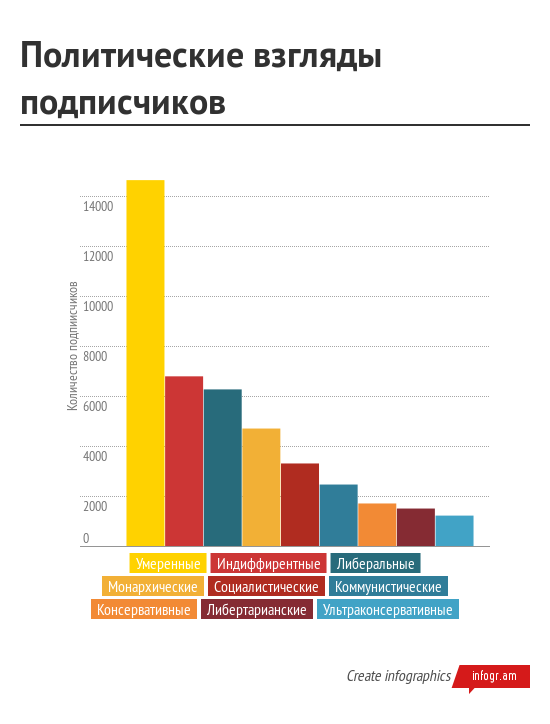
Chart 15. Political views
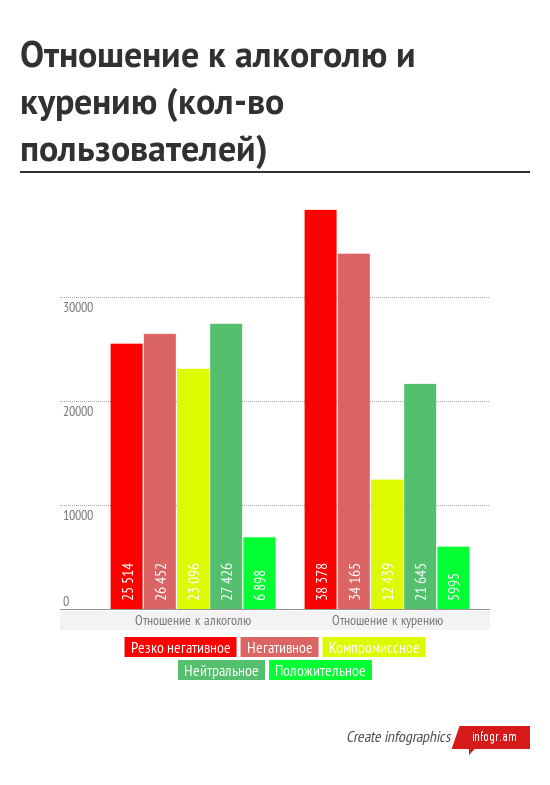
Chart 16. Attitude to alcohol and smoking
As we can see, smoking is perceived worse than alcohol (however, this is a general contact, if not global trend)

Chart 17. Marital status.
Interestingly, on the whole VK people are 1.5 times more married than in the status of “not married.” And in general, the distribution is different:
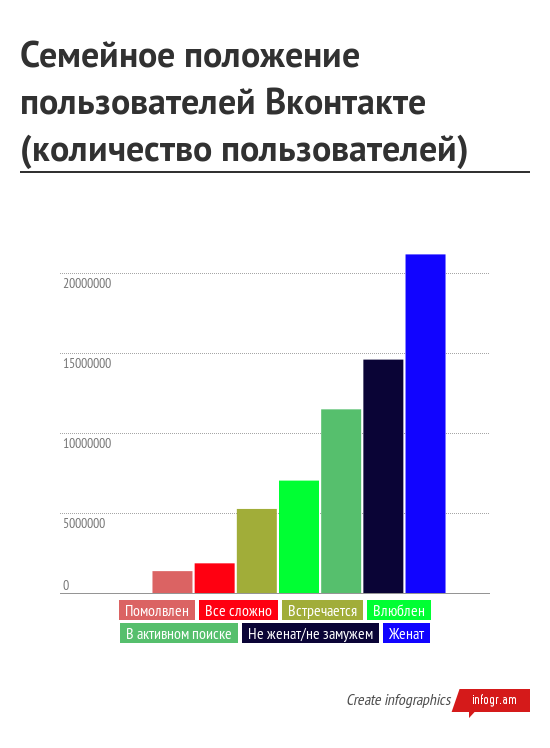
Chart 18. Marital status of VK users. The
differences will even be statistically significant, but there is nothing surprising here - Habr’s subscribers are mostly young and therefore have not managed to get married together legally.
So, to summarize the results and give out prizes “for the vkontakte vkontakte”:
The most deserted country - Belarus.
The most deserted city - Palo Alto .
The most deserted city in Russia is Dolgoprudny.
The most inveterate university is MIPT .
Well, and you, a 24-year-old single MSU graduate with moderate political views and no bad habits, I hope it was at least a little interesting.
If my hands reach, and some of the Khabrovsk citizens are interested, then in the next article we will analyze likes and reposts, I still have a lot of material.
Thanks for attention.
A year has passed since my previous article, and my graphomaniac took over laziness and forced to publish another small study.
The title of the article, of course, is slightly hypocritical (but it sounds beautiful). It would be more correct to call it this way: "Who is subscribed to Vkontakte Habrahabr"
As you probably already understood, it became interesting for me to see who, where and how reads Habr, likes Habr, reposts Habr (however, the last two paragraphs did not fit into this article). And at the same time understand what cities, countries, universities, etc. the most "hardened" in VK.
Who cares to see the amusing charts, graphs and numbers about this, please, under the cat.
Warning .
First, a couple of warning lines. I am not a professional sociologist; I am not a professional SMM scholar or web analyst. I could overlook some things, I can call some concepts unprofessionally. For this, I ask you not to beat (at least in the face), but to point out inaccuracies and comments in the comments. As far as possible, I will supplement and correct. Thank.
Also, I draw attention to the fact that the sample under study is the audience of the public from the Vkontakte social network. This means that the user data in it may periodically change, they may be incorrect or inaccurate. Therefore, when I say, “Habr’s readers are 146% of 91-year-old men from the Isle of Man,” this is not the ultimate truth. This is just the information specified by users in the profiles.
And the last: in this article I do not test any hypotheses. This article is more of a review, so there will simply be graphs and diagrams, no verification of statistical significance, no regression models, no degrees of freedom and chi-squares.
UPD. 11/18/2014: it just so appears that Crimea and its cities appear on many graphs and maps. By default, in Google GeoChart it is assigned to the territory of Ukraine, in VK - to Russia. Please do not look for any of my intentions in attributing Crimea to a particular state, on all the graphs and maps I just left everything by default and unchanged. An active political position is good, but not in the form of srach in the comments on Habré.
Alright, pretty talk, let's get down to business.
Data and its processing
Data downloaded using VK Api. They were uploaded to a self-written database, where I processed and analyzed the data. Initially, I wrote this database for the analysis of other groups and public pages of Vkontakte, but when work with them was finished, I could not resist and decided to analyze Habrahabr too.
However, this article is not devoted to the description of technical aspects of the process of obtaining data from Vkontakte. There are enough examples of working with VK Api on Habré, and even the design and development of the database is all the more not worth describing. If you suddenly have questions - write.
Also, if suddenly there are suggestions to analyze some other user parameters that I did not describe about in the article or to do some other publicity and groups in the same study, write in the comments.
The sample for the study is continuous, that is, the entire audience of the public. The data were obtained in October 2014, so they may differ (most likely, slightly) from the actual ones.
results
To simplify the story, hereinafter I will use instead of the phrase “subscribers of the public Habrahabr VKontakte” the words “readers of Habrahabr” or “subscribers of Habrahabr” (but what is it, in the context of this article I will simply say “subscribers”). Just remember that we are talking about "contactless" Habr readers.
Floor
First, look at the gender of subscribers:
Chart 1. Distribution of subscribers by gender The
picture is quite logical. Habr is still a site for techies. Historically, there are more males among techies, and therefore there are more males among subscribers (despite the fact that in Vkontakte the ratio of men / women is approximately 53/47).
Age
Let's look at the number of readers by age (took the range from 16 to 65).
But you will rightly notice: after all, active users of Vkontakte are mostly people up to 30-35 years old. True:
Graph 2. The general distribution of VKontakte users by age.
Therefore, on the graph I will give two lines. The first is the distribution of the number of subscribers by age in absolute numbers. The second is the "reference" distribution of subscribers, that is, how Habrahabr subscribers should be distributed by age, if they were distributed in the same way as all Vkontakte users as a whole.
Chart 3. Absolute and “reference” values of the distribution of Habr’s subscribers by age
And to make it completely clear, I’ll give you a graph of the percentage of Habr’s subscribers to the total number of all Vkontakte users of this age:
Graph 4.% of subscribers of the total number of Vkontakte users.
Quite a logical picture - the most popular Habrhabr VKontakte is used by 20-25 year-olds. The peak for 64 years is explained by the fact that by default Vkontakte is registered (or at least installed earlier) 1950 year of birth. But why such a jump is not on chart 2, I can’t explain.
Geography. Country
Understood with age and gender, went to geography. For convenience, we divide the diagram into two different ranges (otherwise, nothing except the first four countries can be distinguished on the diagram). "Basic" of the country in which most subscribers:
Figure 5. Countries with the most subscribers Habrahabr
and "Minorities" (limited to countries where there is at least 100 subscribers):
Schedule 6. "Secondary" country subscribers Habrahabr
logical question - in -first, where did I get that all those who indicated in their profile their hometown of New York really live in the USA, and not in some New Vasyuki? No way. Do not check it in any way (at least in a simple way), so you have to take a word.
Secondly, Russian language site Habrahabr. It is logical that it will be popular primarily among Russian users. But Vkontakte social network is popular mainly among Russian-speaking people. These are either residents of the ex-USSR, or emigrants, if we are talking about distant foreign countries. Therefore, let's apply the same technique as with age. Let's look at the percentage of subscribers to the total number of Vkontakte users from a particular country (hereinafter I will call this ratio the “normalized percentage of subscribers” to save time and time. Perhaps in the SMM sciences there is some kind of correct term for this concept - if is, then tell me).
We look at the chart and see interesting things:
Chart 7. Percentage of subscribers to the total number of Vkontakte users by country
Surprising Jamaica and Japan. I suspect that anime and ahem are involved here ... let there be reggae music. Just look at the avatars of subscribers from Japan :)
In general, I will allow liberties and exclude them from our list as results that are suspicious.
Lyrical digression
By the way, VK has an interesting bug or feature, which is probably familiar to experienced VK API users, but for me it was an opening and made me a little nervous.
If we just search for people from Japan among the subscribers, we get only 13 people:
However , if we also indicate the city, we get a completely different picture:
Therefore, I studied country information based not on group searches, but on data directly from user pages .
Having removed these two wonderful countries, we get:
Chart 8. Normalized% of subscribers (without Japan and Jamaica)
The most interesting thing here is that neither Russia, nor Belarus, nor Ukraine fall into the top three.
Russia, however, shares its line with the Netherlands.
If Japan, Jamaica, or, for example, Honduras, we like to indicate as a country of residence "purely for fun," then it is difficult for me to suspect that they are doing the same with Finland or Thailand. In this regard, I suppose that, most likely, these are really subscribers living in these countries. Why then is Russia only in the middle of the list? I suppose the whole point is this: who goes abroad and at the same time actively uses social networks? I think that to a large extent highly qualified specialists in the field of IT, whom God himself ordered to be interested in Habr. So it turns out that, on average, Habr is more popular among Russian-speaking people living abroad than actually in Russia.
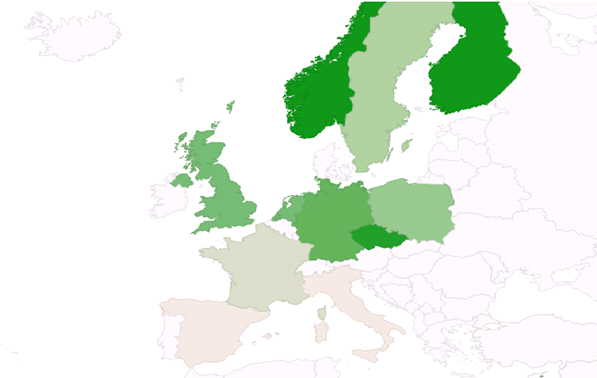
If you look at Europe (without the countries of the ex-USSR), then the Habr’s popularity map (countries with more than 100 subscribers are taken into account) will look something like this:
The following couple of paragraphs up to the section “Geography. Cities ”- my lyrical considerations on the topic of a search for a possibly not very interesting and not very existing relationship. To whom it is not interesting - we are scrolling immediately further.
Let's give a little more geography and economics. Let us turn our eyes to where the situation should be simpler, namely, to the countries of the ex-USSR. The overwhelming majority of the Russian-speaking population here, so you can evaluate the popularity of Habr on VKontakte with a lesser degree of mistrust.
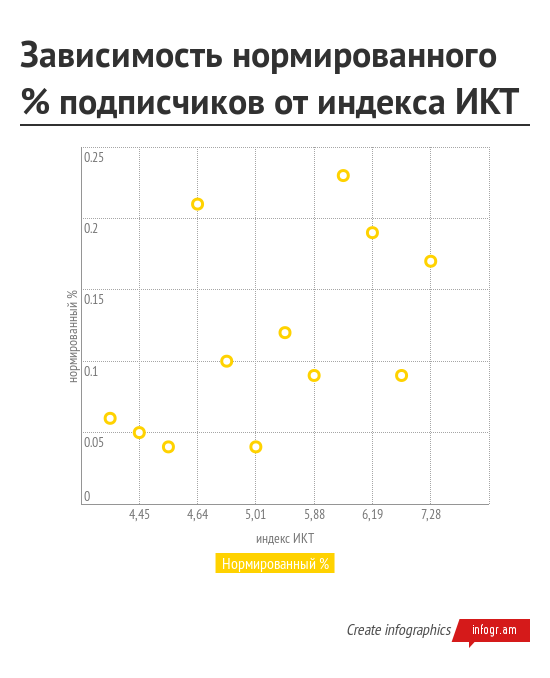
It’s not very interesting to look at the countries of the ex-USSR just like that, I want to understand why in a particular country interest in Habr is higher. It will be logical to assume (hell, I still could not resist the hypotheses, although I promised at the beginning) that the higher the level of development of information and communication technologies (ICT index) in the country, the more there is interest in sites of such subjects (read, to Habr ) Information on ICT is taken from here (no data on Tajikistan, Kyrgyzstan and Turkmenistan).
First the graph:
Graph 9. The dependence of the normalized% of subscribers on the ICT index.
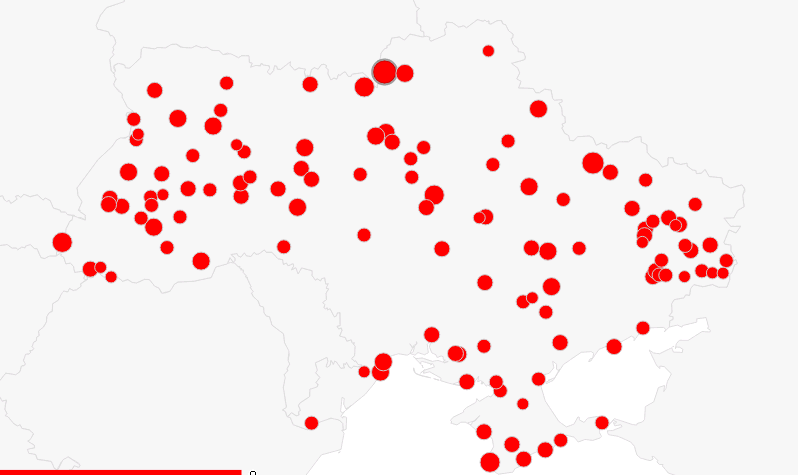
I don’t even know what to say here. I planned that there will be a strong correlation, and I, playing the role of Captain of Evidence, will simply voice this fact. However, the dependence, frankly, is not so hot (Pearson's correlation coefficient, for example, will be about 0.5). Ukraine stands out very much. The first thought was that in Ukraine all interest in Habr is concentrated in only a few cities or regions, which causes such a gap. However, if you look at the map of Ukraine, we will see that the normalized percentage is distributed fairly evenly: I
expected to see a different picture in absolute numbers, but here everything is more or less even:
So either the ICT index is biased, or the people of Ukraine are interested in Habré despite its low value, or it really has nothing to do with it.
By the way, if for the sake of interest to build a schedule similar to schedule 9, for all countries (except Japan and Jamaica), we get almost the same picture:
Figure 10. The dependence of the normalized% of subscribers on the ICT index (for all countries).
Geography. Cities
Let's go the beaten path. We will study the percentage of Habr’s subscribers to the total number of Vkontakte users from this city. We will consider only those cities in which the number of subscribers is more than 10.
For starters, for the solemnity of the moment, let us look at the world map. The points indicate cities where the number of Habr subscribers is more than 10. Some cities might not get on the map due to the mismatch between the city names in VK and the Google Chart API - I was too lazy to manually edit hundreds of names, so sorry, the main thing is that the scope is clear!
Well, do not forget that this is all just data from the social network, and not from the passport page. So, perhaps, all those who indicated "Melbourne" actually live in my native Dolgoprudny.
By the way, I mentioned my hometown for a reason. Look at the TOP-30 of Russian cities by the percentage of Habr subscribers:
Chart 11. Normalized% of subscribers by Russian cities. TOP-30
Such pride for my hometown I experienced the last time a couple of years ago, when FC Dolgoprudny won the third division of the Russian Football Championship. I honestly didn't push anything. I can still make an accidental mistake or some feature of the behavior of VKontakte, which “palm off” more data in the search from your city, but it’s also unlikely.
I suspect that this indicator is explained by the large number of students at the Moscow Institute of Physics and Technology (we’ll go further).
If you look at the same diagram, but around the world, the picture will be more fun:
Chart 12. Normalized% of subscribers by world cities. TOP-30 I
suspect that the data is not very reliable. But, at least, it’s clear where many Habrach residents would dream to live :)
I’m probably already tired of you with geography. Let's move on.
Universities
First, let's take the TOP-30 by the absolute number of subscribers (many universities are hidden by privacy settings, so do not be surprised at the small absolute numbers):
Chart 13. Number of university subscribers
No surprises in my opinion. Now, let’s look, as always, at the normalized percentage of subscribers:
Chart 14. Normalized% of subscribers by university It is interesting
that Kazakhstan is in the first place. Of the Russian universities, as I expected above, MIPT is the most inveterate.
Political views, worldview, etc.
A couple more charts that I could not help but make:
Chart 15. Political views
Chart 16. Attitude to alcohol and smoking
As we can see, smoking is perceived worse than alcohol (however, this is a general contact, if not global trend)
Chart 17. Marital status.
Interestingly, on the whole VK people are 1.5 times more married than in the status of “not married.” And in general, the distribution is different:
Chart 18. Marital status of VK users. The
differences will even be statistically significant, but there is nothing surprising here - Habr’s subscribers are mostly young and therefore have not managed to get married together legally.
Summary
So, to summarize the results and give out prizes “for the vkontakte vkontakte”:
The most deserted country - Belarus.
The most deserted city - Palo Alto .
The most deserted city in Russia is Dolgoprudny.
The most inveterate university is MIPT .
Well, and you, a 24-year-old single MSU graduate with moderate political views and no bad habits, I hope it was at least a little interesting.
If my hands reach, and some of the Khabrovsk citizens are interested, then in the next article we will analyze likes and reposts, I still have a lot of material.
Thanks for attention.