News from Xamarin Evolve 2014 - Insights monitoring system, Android Player emulator, Profiler, UITest, prototyping in Sketches
- Xamarin Insights - a new monitoring system monitors everything that happens in the application from uncaught exceptions to button clicks, including the duration of operations and device data
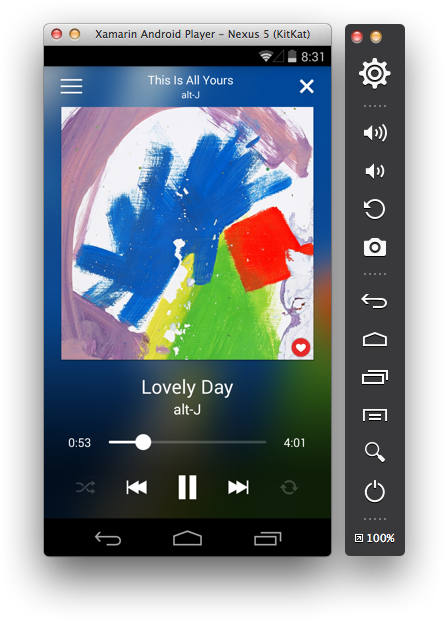
- the Xamarin Android Player emulator runs on Windows or Mac using hardware virtualization and allows you to quickly debug applications
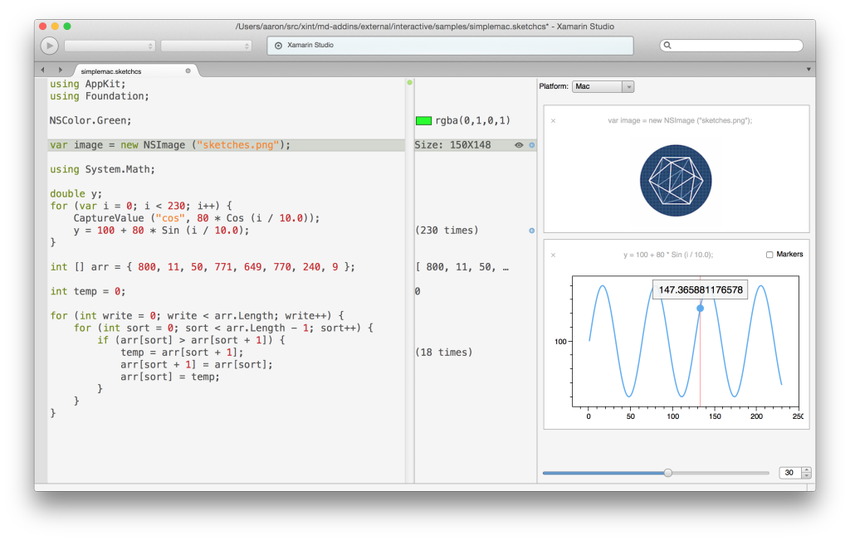
- Sketches allow you to quickly write code in C # or F # and immediately see the results of its execution including the user interface
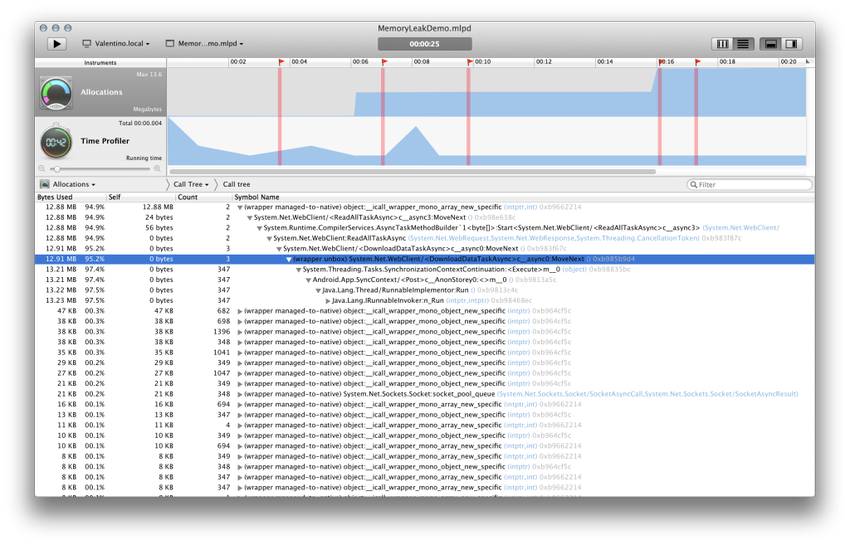
- Xamarin Profiler collects information on performance problems and memory leaks
- Xamarin Test improvements Cloudinclude Xamarin.UITest - a new framework for automatic, cross-platform testing of the user interface in the Xamarin Test Cloud, video recording of what is happening on the device’s screen during the test, and hyper-parallel testing on a large number of devices, reducing test time
— the six largest developers of components for. Net - Syncfusion , Telerik , Infragistics , Steema , ComponentOne , DevExpress , transferred them to Xamarin.Forms. All components will be available in the Xamarin Component store this year. Components from SyncFusion and Telerik are available right now. IBM Partnership Concluded in ReleaseIBM MobileFirst SDK for Xamarin and IBM MobileFirst Add-Ons for Xamarin Studio and Visual Studio
Xamarin Insights is a real-time monitoring system that allows you to identify and track situations affecting users with a simple and effective API. You can add Insights to applications with a single line of code. Insights will report all uncaught native or managed exceptions. In addition to this, you can track both completed and active sessions, along with full access to device statistics, such as the operating system and screen resolution.
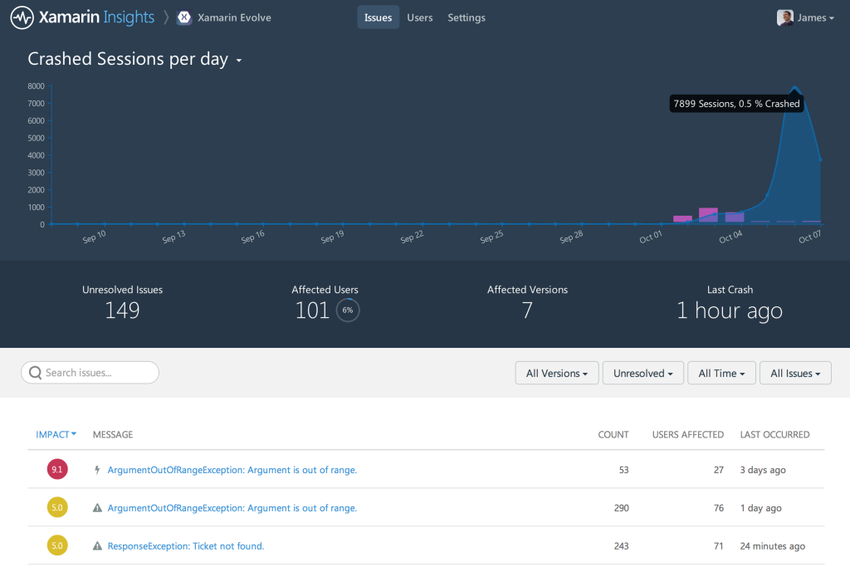
If you want more control, you can track all caught exceptions along with any additional data that will help you understand what is happening using the simple Insights API. In addition to tracking crashes, Insights allows you to track any events that have occurred in your application by calling a single method - from pageviews to button clicks. You can also track performance by recording the time it takes for slow operations. Insights allow you to combine event tracking with user identification so that you can examine any desired details and reproduce the situation in which the error occurred.
All information is available from the Insights admin panel. But since developers need real-time feedback, Insights integrates seamlessly with services like GitHub, HipChat, Visual Studio Online, Campfire and many others, allowing you to instantly receive alerts about important information for you. For several months from now, Xamarin Insights will be available to all Xamarin subscribers for free. Prices will be announced at the end of this period, but a generous plan will be included in the Xamarin subscription at no extra cost.
One of the most painful places for all Android developers is an outdated, slow and inconvenient emulator. New Xamarin Android Playeruses hardware virtualization (VT-x and AMD-V) and graphics acceleration (OpenGL 2.0) on Windows or Mac to ensure the fastest possible launch and best performance. Android Player is built using Xamarin.Mac on OSX, WPF on Windows and uses native interfaces optimized for the idioms of each platform. The user interface shows the battery status, GPS location and integrates directly into ADB, allowing all existing tools to work directly with the new emulator. Installing the APK and adding Google Play Services is very simple - just drag and drop the APK into the Xamarin Android Player window. The preview version comes with Android KitKat 4.4.2, API Level 19, one form factor and is free for Xamarin subscribers.
Sketches improve the standard cycle "wrote, assembled, deployed, tested." Start writing code and watch how it works. You will see the intermediate results of your changes along with the effect that they will have on the user interface. Sketches are well-suited for learning new APIs, prototyping ideas, and quick iterations in design. Once you find the code that suits you, you simply copy it into your application or you can take part of the code from the application and study it in an isolated, but lively software environment. This is extremely convenient when debugging. A preliminary version of Sketches is already available for iOS, Android, and Mac in the Xamarin Studio Beta Channel, Visual Studio support for Android, iOS and Windows will be added soon. More in the documentation.
Profiling resembles the work of a detective. It is like investigating a crime or making a diagnosis - developers should use their skills to collect a complete picture, but a good tool like a magnifying glass or a stethoscope can help gather evidence to solve the puzzle. Xamarin profilerIs a tool to help you discover, analyze, and improve your C # mobile app. The profiler collects information about the managed side of Xamarin apps for iOS and Android, helping you understand exactly what it takes to spend time improving the application. You can use it to look for memory leaks, performance bottlenecks, or just to lick the application before release. Xamarin Profiler comes in two versions - for Mac and Windows - that seamlessly integrate with your Xamarin toolkit. A preliminary version is already available for download.
Xamarin.UITest is a new framework for automated testing of the user interface in any mobile application. Local tests with Xamarin.UITest run on your simulator or device and can output test results directly to Xamarin Studio or Visual Studio. Xamarin.UITest is based on Calabash, one of the most popular frameworks for automated testing of mobile applications in the world. The framework provides a consistent interface for cross-platform testing of any application for iOS or Android, including non-Xamarin applications and even hybrid applications that use HTML and CSS in WebViews. The local version has a lot of possibilities, but the real power of Xamarin.UITest is that you can do a local test and without making any changes place it in the Xamarin Test Cloud, By scaling your testing to more than 1000 real, unlocked Android and iOS devices in a cloud environment designed for performance and reliability. Xamarin.UITest can be installed fromNuGet now and start writing local tests using documentation.

Improved
Recorders Xamarin Test Cloud generates screenshots as you progress through the steps of your test. This way you can make sure that your application looks great even at unusual resolutions for you. However, some user experiences are poorly conveyed by screenshots alone. To fix this, a preliminary version of the video of what is happening on the screen in the Xamarin Test Cloud is presented. It includes the full passage of tests, including animation. The preview version is available for Android starting with version 4.0 and is fully integrated with the Xamarin Test Cloud web portal.
Improved test execution
An important improvement to the Xamarin Test Cloud is the hyper-parallel execution of tests. At the moment, when you run a test on 10 unique devices, this test is already running on each of them at the same time, but individual stages of the test are performed in turn. Hyper-parallel test execution takes this to the next level. There are many instances of the same device in our laboratory, so that we can break down the test set into pieces and run them in parallel on the same devices. In the end, the results are collected together as if the test was performed on one device, but you will get the result much faster. We use the Xamarin Test Cloud to test our own products. For example, the Xamarin.Forms team has one of the largest test suites, which takes 2.5 hours to complete in the standard configuration.
Based on five Xamarin blog entries:
Enterprise Component Vendors Join
Xamarin. Forms Ecosystem Xamarin Platform Previews
New Xamarin Test Cloud Features
Introducing Xamarin Insights: Real-time Monitoring for Your Apps
IBM and Xamarin Partner to Accelerate Enterprise Mobility
- the Xamarin Android Player emulator runs on Windows or Mac using hardware virtualization and allows you to quickly debug applications
- Sketches allow you to quickly write code in C # or F # and immediately see the results of its execution including the user interface
- Xamarin Profiler collects information on performance problems and memory leaks
- Xamarin Test improvements Cloudinclude Xamarin.UITest - a new framework for automatic, cross-platform testing of the user interface in the Xamarin Test Cloud, video recording of what is happening on the device’s screen during the test, and hyper-parallel testing on a large number of devices, reducing test time
— the six largest developers of components for. Net - Syncfusion , Telerik , Infragistics , Steema , ComponentOne , DevExpress , transferred them to Xamarin.Forms. All components will be available in the Xamarin Component store this year. Components from SyncFusion and Telerik are available right now. IBM Partnership Concluded in ReleaseIBM MobileFirst SDK for Xamarin and IBM MobileFirst Add-Ons for Xamarin Studio and Visual Studio
Xamarin insights
Xamarin Insights is a real-time monitoring system that allows you to identify and track situations affecting users with a simple and effective API. You can add Insights to applications with a single line of code. Insights will report all uncaught native or managed exceptions. In addition to this, you can track both completed and active sessions, along with full access to device statistics, such as the operating system and screen resolution.
If you want more control, you can track all caught exceptions along with any additional data that will help you understand what is happening using the simple Insights API. In addition to tracking crashes, Insights allows you to track any events that have occurred in your application by calling a single method - from pageviews to button clicks. You can also track performance by recording the time it takes for slow operations. Insights allow you to combine event tracking with user identification so that you can examine any desired details and reproduce the situation in which the error occurred.
All information is available from the Insights admin panel. But since developers need real-time feedback, Insights integrates seamlessly with services like GitHub, HipChat, Visual Studio Online, Campfire and many others, allowing you to instantly receive alerts about important information for you. For several months from now, Xamarin Insights will be available to all Xamarin subscribers for free. Prices will be announced at the end of this period, but a generous plan will be included in the Xamarin subscription at no extra cost.
Xamarin Android Player
One of the most painful places for all Android developers is an outdated, slow and inconvenient emulator. New Xamarin Android Playeruses hardware virtualization (VT-x and AMD-V) and graphics acceleration (OpenGL 2.0) on Windows or Mac to ensure the fastest possible launch and best performance. Android Player is built using Xamarin.Mac on OSX, WPF on Windows and uses native interfaces optimized for the idioms of each platform. The user interface shows the battery status, GPS location and integrates directly into ADB, allowing all existing tools to work directly with the new emulator. Installing the APK and adding Google Play Services is very simple - just drag and drop the APK into the Xamarin Android Player window. The preview version comes with Android KitKat 4.4.2, API Level 19, one form factor and is free for Xamarin subscribers.
Sketches
Sketches improve the standard cycle "wrote, assembled, deployed, tested." Start writing code and watch how it works. You will see the intermediate results of your changes along with the effect that they will have on the user interface. Sketches are well-suited for learning new APIs, prototyping ideas, and quick iterations in design. Once you find the code that suits you, you simply copy it into your application or you can take part of the code from the application and study it in an isolated, but lively software environment. This is extremely convenient when debugging. A preliminary version of Sketches is already available for iOS, Android, and Mac in the Xamarin Studio Beta Channel, Visual Studio support for Android, iOS and Windows will be added soon. More in the documentation.
Profiler
Profiling resembles the work of a detective. It is like investigating a crime or making a diagnosis - developers should use their skills to collect a complete picture, but a good tool like a magnifying glass or a stethoscope can help gather evidence to solve the puzzle. Xamarin profilerIs a tool to help you discover, analyze, and improve your C # mobile app. The profiler collects information about the managed side of Xamarin apps for iOS and Android, helping you understand exactly what it takes to spend time improving the application. You can use it to look for memory leaks, performance bottlenecks, or just to lick the application before release. Xamarin Profiler comes in two versions - for Mac and Windows - that seamlessly integrate with your Xamarin toolkit. A preliminary version is already available for download.
Xamarin.UITest and Xamarin Test Cloud
Xamarin.UITest is a new framework for automated testing of the user interface in any mobile application. Local tests with Xamarin.UITest run on your simulator or device and can output test results directly to Xamarin Studio or Visual Studio. Xamarin.UITest is based on Calabash, one of the most popular frameworks for automated testing of mobile applications in the world. The framework provides a consistent interface for cross-platform testing of any application for iOS or Android, including non-Xamarin applications and even hybrid applications that use HTML and CSS in WebViews. The local version has a lot of possibilities, but the real power of Xamarin.UITest is that you can do a local test and without making any changes place it in the Xamarin Test Cloud, By scaling your testing to more than 1000 real, unlocked Android and iOS devices in a cloud environment designed for performance and reliability. Xamarin.UITest can be installed fromNuGet now and start writing local tests using documentation.
Improved
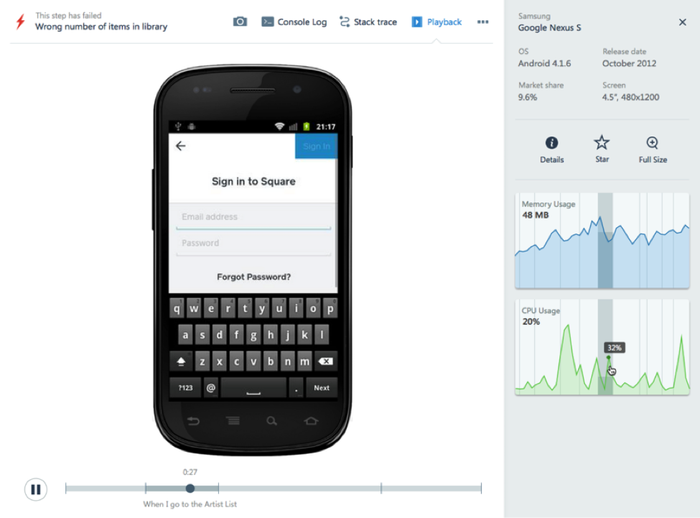
Recorders Xamarin Test Cloud generates screenshots as you progress through the steps of your test. This way you can make sure that your application looks great even at unusual resolutions for you. However, some user experiences are poorly conveyed by screenshots alone. To fix this, a preliminary version of the video of what is happening on the screen in the Xamarin Test Cloud is presented. It includes the full passage of tests, including animation. The preview version is available for Android starting with version 4.0 and is fully integrated with the Xamarin Test Cloud web portal.
Improved test execution
An important improvement to the Xamarin Test Cloud is the hyper-parallel execution of tests. At the moment, when you run a test on 10 unique devices, this test is already running on each of them at the same time, but individual stages of the test are performed in turn. Hyper-parallel test execution takes this to the next level. There are many instances of the same device in our laboratory, so that we can break down the test set into pieces and run them in parallel on the same devices. In the end, the results are collected together as if the test was performed on one device, but you will get the result much faster. We use the Xamarin Test Cloud to test our own products. For example, the Xamarin.Forms team has one of the largest test suites, which takes 2.5 hours to complete in the standard configuration.
Based on five Xamarin blog entries:
Enterprise Component Vendors Join
Xamarin. Forms Ecosystem Xamarin Platform Previews
New Xamarin Test Cloud Features
Introducing Xamarin Insights: Real-time Monitoring for Your Apps
IBM and Xamarin Partner to Accelerate Enterprise Mobility