We collect NetFlow cheaply and angrily
TL; DR : The author has assembled a NetFlow / sFlow collector from GoFlow , Kafka , ClickHouse , Grafana and a crutch on Go.
Hello, I am an exploiter and I love to know what is happening in the infrastructure. And I also love to climb into someone else's business, and this time I climbed into the net.
Suppose you have your network equipment and a bag of monoliths sticking to the Internet, microservices and microservices monoliths with their dependencies in the form of databases, caches and FTP servers. And sometimes some of the inhabitants of this bag begin to misbehave on the net.
Here are just some examples of such pranks:
- backup outside the prescribed window in 40 streams;
- configuration errors sending the application in one DC to the cache of another DC;
- application questions in the next rack to the same cache “give me this half-megabyte object from the cache two hundred times a second.
SNMP counters from switch ports or VMs will only give an approximate picture of what is happening, but I want accuracy and speed of problem analysis. The NetFlow / IPFIX and sFlow protocols come to the rescue , which generate rich traffic information directly from the network equipment. It remains to put it somewhere and somehow process it.
From the available NetFlow collectors, the following were considered:
- flow-tools - did not like storage in files (for a long time to make samples, especially operative in the process of reacting to an incident) or MySQL (having a table there in billions of rows seems like a rather bleak idea);
- Elasticsearch + Logstash + Kibana is a very resource-intensive bundle, up to 6 cores of an old 2.2 GHz CPU to receive 5000 flows (flows) per second. However, Kibana allows you to stick across any filters in the browser, which is valuable;
- vflow - did not like the output format (JSON, which without modification cannot be added to the same Elasticsearch);
- box solutions - did not like either the high price or the small difference from the selected one.
A selected was described in the presentation of Louis Poinsignon at RIPE 75 . The general scheme of a simple collector is as follows:
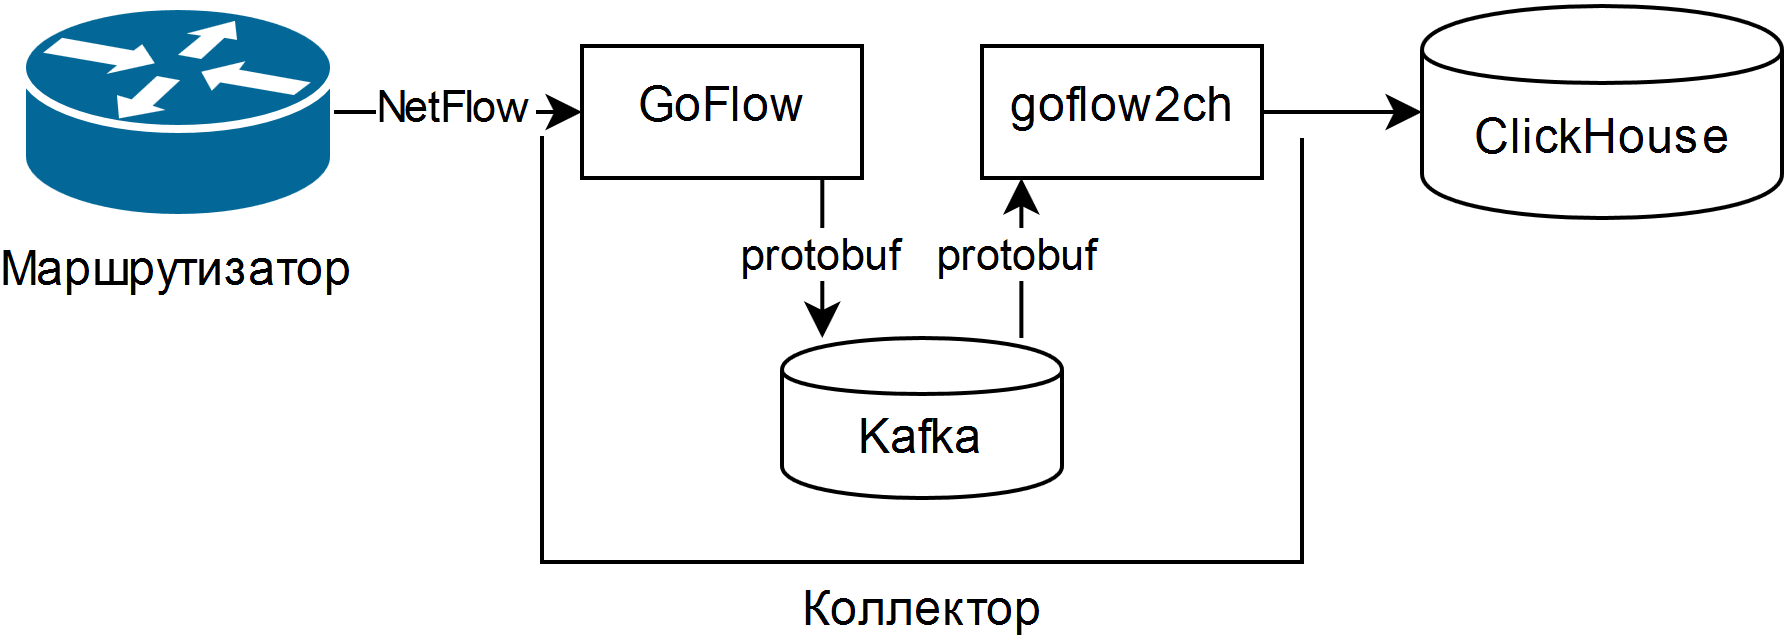
GoFlow parses NetFlow / sFlow packages and puts them into a local Kafka in protobuf format. The self-written “shovel” goflow2ch takes the messages out of Kafka and puts them in Clickhouse in batches for better performance. The scheme does not address the issue of high availability at all, but for each component there are either standard or more or less simple external means of its provision.
Tests have shown that the CPU cost of parsing and saving the same 5000 threads per second is about a quarter of the CPU core, and the disk space occupied is on average 11-14 bytes per slightly truncated stream.
To display information, use either a Web UI for ClickHouse called Tabix , or a plugin for Grafana .
Advantages of the scheme:
- the ability to ask arbitrary questions about the state of the network using the SQL dialect;
- undemanding of resources and horizontal scalability. Old / slow processors and magnetic hard disks will do;
- if necessary, a full-fledged data pipeline is collected for analyzing network events, including in real time using Kafka Streams, Flink or analogs;
- the ability to change the storage to an arbitrary minimum means.
Cons too decent:
- to ask questions, you need to know well SQL and its ClickHouse dialect; there are no ready reports and graphs;
- Many new moving parts in the form of Kafka, Zookeeper and ClickHouse. The first two are in Java, which can cause rejection for religious reasons. For me personally, this was not a problem, since all this was somehow used in the organization;
- have to write code. Either a “shovel” transferring data from Kafka to ClickHouse, or an adapter for recording directly from GoFlow.
Features encountered:
- It is necessary to adjust the rotation according to the size of the data in Kafka and ClickHouse, and then check that it really works. In Kafka there is a limit on the size of the log partition, and in ClickHouse there is a partition with an arbitrary key. A new partition every hour and the removal of unnecessary partitions every 10 minutes work well for operational monitoring and are made from a few lines of script;
- “Shovel” benefits from the use of consumer groups , allowing you to add more “shovels” in order to scale and resiliency;
- Kafka allows you not to lose data when dropping “shovels” or ClickHouse itself (for example, from a heavy query and / or incorrectly limited resources), but it is better, of course, to carefully configure the database;
- If you will be collecting sFlow, remember that some switches by default change the sampling rate of packets on the fly, and it is indicated for each flow.
As a result, a tool for monitoring the situation in the network, in real-time plus or minus, as well as in historical perspective, was obtained from open source components and blue electrical tape. Despite his knee pads, he has already helped reduce the time to resolve several incidents at times.