Java Garbage Collection on Infobox Jelastic Cloud Hosting
- Transfer
Performance and price are the two main, most significant factors in application hosting. We often ask ourselves how to spend less without compromising application performance. In this article, we will consider automatic memory management for Java applications hosted on the Infobox Jelastic cloud hosting service using garbage collection and the Jelastic GC Agent. At the end of the article, a little surprise.

First, let's define what garbage collection is and what it does for our Java application. Then we'll talk more about the garbage collection processes in Jelastic.
Garbage Collection (GC) is a form of automatic memory management. Its purpose is to search for objects in memory that applications no longer need and free up their space for future use.
The created object uses a certain amount of memory that remains allocated as long as there are references to this object. If there are no references to the object, it is considered no longer needed and the memory occupied by it can be freed. Thus, you do not pay for unused resources and can reduce your costs.
If the user does not specify their settings, Jelastic will configure the garbage collector as follows:
In this case, it does not matter how many cloudlets are consumed at a particular point in time. The garbage collector checks the maximum limit - the maximum allowable number of cloudlets that you have allocated to the corresponding server.

ParNew is a “stop the world” multi-threaded garbage collector. He collects a young generation of objects. Since the younger generation is usually small in size, in Jelastic this collector is used only for servers with a resource limit of less than 8 GB. Assembly based on the size of objects works very quickly and slightly affects the functioning of your application. In addition, the ParNew collector can free up unused memory, which allows vertical autoscaling to work correctly - one of the main functions of Jelastic.
Garbage-First (G1) - server-type garbage collector for multiprocessor machines with a large amount of memory. Heap is divided into fixed-size areas and G1 tracks live data in these areas. When garbage collection is needed, gc starts with areas with less live data.
G1 is focused on applications that need a large heap with limited delays in garbage collection. After deep analysis, we came to the conclusion that 8 GB of memory consumption is enough for applying G1.
Together with these settings, a specialized Jelastic garbage collection agent is used to free up used JVM memory in the OS.
If you are sure that the default GC settings in Jelastic are not optimal for your application, you can set them according to your needs. We recommend that you change the settings only if you fully understand the action that they will have on the performance of your application.
You can set your garbage collection (GC) settings based on the requirements of your application:
1. To configure Tomcat, TomEE, or Jetty, open the configuration files for your Java server.

2. Go to the server > variables.conf file .

3. In the open variables.conf file, you can specify the necessary garbage collector by setting one of the following values as the GC parameter:
4. When setting up GlassFish, you should use the same GC parameter format.
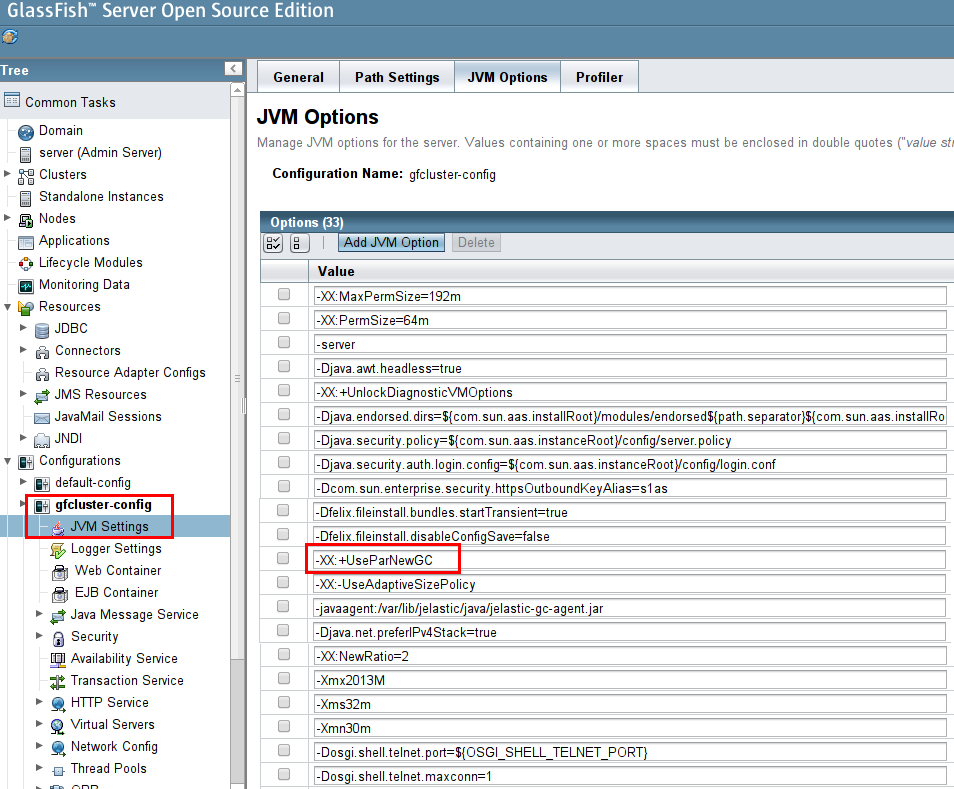
Open the GlassFish admin panel, go to Configurations > gfcluster-config > JVM Settings > JVM Options and edit the corresponding line as shown in the picture below.
5. After that, when starting your Java server, only the garbage collector you specify will be used, regardless of the resources allocated.
Please note that the Jelastic GC agent only works with two types of garbage collectors:
If you manually specify a different garbage collector, full garbage collection will be disabled.
6. You can also reduce the garbage collector's use of processor power and control how the JVM uses heap memory. To do this, you need to configure the garbage collection startup frequency by specifying the -Xmx and -Xms options.
The -Xmx option is used to start the JVM with a large maximum heap volume and free up CPU time for important processes.
The -Xms option ensures that the initial size of the JVM memory heap is equal to the maximum allocated memory limit (scaling limit).
These parameters must be specified in the variables.conf file for Tomcat, TomEE, and Jetty, or in the JVM settings for GlassFish.

The release of reserved but at the same time unused JVM memory in the OS is necessary for vertical autoscaling. Therefore, Jelastic uses a special garbage collection agent .
Jelastic GC agent includes an intelligent algorithm for monitoring consumed and free memory. Processing the monitoring results, it recognizes the possibility of freeing up some of the memory for the OS and starts a full garbage collection. If the JVM does not have free memory that can be freed up for the OS, the Jelastic GC agent does not start a full garbage collection. This approach could potentially reduce application performance degradation to zero.
The Jelastic GC agent only works for two types of garbage collectors (configured by default in Jelastic):
If you change the default GC to any other ones that do not support compression and do not free memory for the OS, the GC Jelastic agent will be disabled and will not be able to start a full garbage collection.
To configure the Jelastic agent GC, go to server > variables.conf for Tomcat, TomEE, or Jetty server.

For GlassFish GC, the Jelastic agent can be configured or disabled through the GlassFish admin panel under gfcluster-config > JVM Settings > JVM Options .

The Jelastic GC agent is enabled by default for all newly created Java application servers.
If you want to enable the GC Jelastic agent in an existing container, you should download the jelastic-gc-agent.jar file and enable the agent manually as follows:
1. Download the jelastic-gc-agent.jar file .
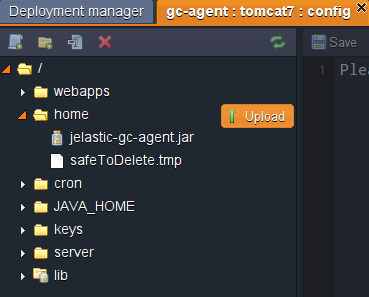
2. Go to the configuration files of your Java server and download the downloaded .jar file to the home folder .
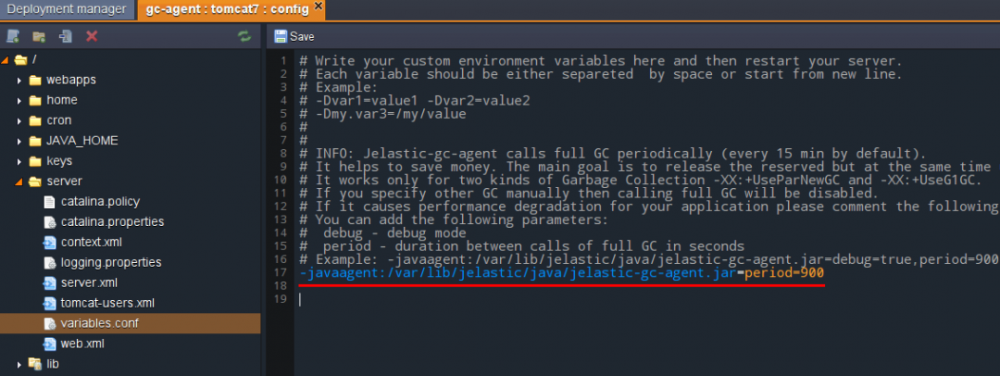
3. Go to the server > variables.conf file and specify the path to your jelastic-gc-agent.jar file in the -javaagent parameter .
The path depends on the Java server you are using:
4. Save the changes and restart the server.
If you notice that the Jelastic agent GC processes caused performance degradation for your application, comment out the following line and restart the server:
-javaagent: /var/lib/jelastic/java/jelastic-gc-agent.jar
By default, the Jelastic GC agent checks the system every 15 minutes (starting every time the JVM starts) to force the unused memory of the application. The verification period can be changed according to your needs.
To change the scan period, specify the time between starts of the full garbage collection in seconds, as shown below:
-javaagent: /var/lib/jelastic/java/jelastic-gc-agent.jar=period=900
To apply the changes, save the file and restart server.
You can enable debugging mode as follows:
-javaagent: /var/lib/jelastic/java/jelastic-gc-agent.jar=debug=true
As a result, you will be able to track GC log processes.
Please note that you can use both options (change the scan period and enable debug mode) together:
-javaagent: /var/lib/jelastic/java/jelastic-gc-agent.jar=debug=true,period=900

Save the changes and restart the server.
To display the results of the configured periodic system checks and free up memory, we will use the special Loader application .
1. Follow the link and download the Loader.war archive with the test application.
2. Download this .war archive to Jelastic.
3. Deploy this application in an environment with a Java application.
4. Open the configuration files and go to the server > variables.conf file to check the Jelastic agent Java settings.
In our case, to get the results as soon as possible, we changed the duration of the period to 60 seconds. If you change the settings, be sure to save the changes and restart the server.
5. After that, open the application in a browser and add the following parameters to the link:
/ loader? Mem = 500 & duration = 300

6. Now you can go to Statistics , where, after a while, you will see the results.

When you run an application request with parameters added to the link, memory consumption increases by 500 MB. This amount of memory will be used for 300 seconds (also in accordance with the specified parameter).
After that, memory usage will decrease as a result of the GC Jelastic agent starting to completely collect garbage. This is because the GC agent sees the opportunity to free memory, because the application has completed its active processes and no longer needs the full amount of memory.
You can run the test application a few more times to load the memory and check the process of freeing it.
7. Since we have enabled debugging mode for our Java agent, we can also track the process in Log files.
The amount of available free memory (in bytes) can be found in the catalina logs .

Thus, using this method, you can improve memory management for your application, which will reduce JVM memory consumption. As a result, you will save your money and increase the productivity of your application.
To everyone who has read until the end of the article, we give 300 rubles to your Jelastic account. Register in the trial version , after the trial is over, click on the "Switch to paid version" button in Jelastic, fill in the information about yourself and send your username to trukhinyuri@infoboxcloud.com .
Successful use of Jelastic in Infobox and good mood!
First, let's define what garbage collection is and what it does for our Java application. Then we'll talk more about the garbage collection processes in Jelastic.
Garbage collection in Java: materiel
Garbage Collection (GC) is a form of automatic memory management. Its purpose is to search for objects in memory that applications no longer need and free up their space for future use.
The created object uses a certain amount of memory that remains allocated as long as there are references to this object. If there are no references to the object, it is considered no longer needed and the memory occupied by it can be freed. Thus, you do not pay for unused resources and can reduce your costs.
GC default settings in Jelastic
If the user does not specify their settings, Jelastic will configure the garbage collector as follows:
- ParNew for all servers with a resource limit of less than 8 GB;
- G1 for servers with a resource limit of more than 8 GB (64 cloudlet or more).
In this case, it does not matter how many cloudlets are consumed at a particular point in time. The garbage collector checks the maximum limit - the maximum allowable number of cloudlets that you have allocated to the corresponding server.
ParNew Garbage Collector
ParNew is a “stop the world” multi-threaded garbage collector. He collects a young generation of objects. Since the younger generation is usually small in size, in Jelastic this collector is used only for servers with a resource limit of less than 8 GB. Assembly based on the size of objects works very quickly and slightly affects the functioning of your application. In addition, the ParNew collector can free up unused memory, which allows vertical autoscaling to work correctly - one of the main functions of Jelastic.
Garbage – First Garbage Collector
Garbage-First (G1) - server-type garbage collector for multiprocessor machines with a large amount of memory. Heap is divided into fixed-size areas and G1 tracks live data in these areas. When garbage collection is needed, gc starts with areas with less live data.
G1 is focused on applications that need a large heap with limited delays in garbage collection. After deep analysis, we came to the conclusion that 8 GB of memory consumption is enough for applying G1.
Together with these settings, a specialized Jelastic garbage collection agent is used to free up used JVM memory in the OS.
Customization of GC settings in Jelastic
If you are sure that the default GC settings in Jelastic are not optimal for your application, you can set them according to your needs. We recommend that you change the settings only if you fully understand the action that they will have on the performance of your application.
You can set your garbage collection (GC) settings based on the requirements of your application:
- by editing the variables.conf file of your Tomcat, TomEE, or Jetty server
- by changing the JVM settings in the administration panel of the GlassFish server
1. To configure Tomcat, TomEE, or Jetty, open the configuration files for your Java server.
2. Go to the server > variables.conf file .
3. In the open variables.conf file, you can specify the necessary garbage collector by setting one of the following values as the GC parameter:
-XX:+UseParNewGC
-XX:+UseG1GC
-XX:+UseConcMarkSweepGC
-XX:+UseSerialGC
4. When setting up GlassFish, you should use the same GC parameter format.
Open the GlassFish admin panel, go to Configurations > gfcluster-config > JVM Settings > JVM Options and edit the corresponding line as shown in the picture below.
5. After that, when starting your Java server, only the garbage collector you specify will be used, regardless of the resources allocated.
Please note that the Jelastic GC agent only works with two types of garbage collectors:
-XX:+UseParNewGC</li>
-XX:+UseG1GC</li>
If you manually specify a different garbage collector, full garbage collection will be disabled.
6. You can also reduce the garbage collector's use of processor power and control how the JVM uses heap memory. To do this, you need to configure the garbage collection startup frequency by specifying the -Xmx and -Xms options.
The -Xmx option is used to start the JVM with a large maximum heap volume and free up CPU time for important processes.
The -Xms option ensures that the initial size of the JVM memory heap is equal to the maximum allocated memory limit (scaling limit).
These parameters must be specified in the variables.conf file for Tomcat, TomEE, and Jetty, or in the JVM settings for GlassFish.
-Xmx<размер>m
-Xms<размер>m
Jelastic Garbage Collection Agent
The release of reserved but at the same time unused JVM memory in the OS is necessary for vertical autoscaling. Therefore, Jelastic uses a special garbage collection agent .
Jelastic GC agent includes an intelligent algorithm for monitoring consumed and free memory. Processing the monitoring results, it recognizes the possibility of freeing up some of the memory for the OS and starts a full garbage collection. If the JVM does not have free memory that can be freed up for the OS, the Jelastic GC agent does not start a full garbage collection. This approach could potentially reduce application performance degradation to zero.
The Jelastic GC agent only works for two types of garbage collectors (configured by default in Jelastic):
-XX:+UseParNewGC
-XX:+UseG1GC
If you change the default GC to any other ones that do not support compression and do not free memory for the OS, the GC Jelastic agent will be disabled and will not be able to start a full garbage collection.
To configure the Jelastic agent GC, go to server > variables.conf for Tomcat, TomEE, or Jetty server.
For GlassFish GC, the Jelastic agent can be configured or disabled through the GlassFish admin panel under gfcluster-config > JVM Settings > JVM Options .
Enable / Disable Jelastic GC Agent
The Jelastic GC agent is enabled by default for all newly created Java application servers.
If you want to enable the GC Jelastic agent in an existing container, you should download the jelastic-gc-agent.jar file and enable the agent manually as follows:
1. Download the jelastic-gc-agent.jar file .
2. Go to the configuration files of your Java server and download the downloaded .jar file to the home folder .
3. Go to the server > variables.conf file and specify the path to your jelastic-gc-agent.jar file in the -javaagent parameter .
The path depends on the Java server you are using:
- Tomcat / TomEE : / opt / tomcat / temp
- Glassfish : / opt / glassfish3 / temp
- Jetty : / opt / jetty / home
4. Save the changes and restart the server.
If you notice that the Jelastic agent GC processes caused performance degradation for your application, comment out the following line and restart the server:
-javaagent: /var/lib/jelastic/java/jelastic-gc-agent.jar
Change inspection period
By default, the Jelastic GC agent checks the system every 15 minutes (starting every time the JVM starts) to force the unused memory of the application. The verification period can be changed according to your needs.
To change the scan period, specify the time between starts of the full garbage collection in seconds, as shown below:
-javaagent: /var/lib/jelastic/java/jelastic-gc-agent.jar=period=900
To apply the changes, save the file and restart server.
Turn on debug mode
You can enable debugging mode as follows:
-javaagent: /var/lib/jelastic/java/jelastic-gc-agent.jar=debug=true
As a result, you will be able to track GC log processes.
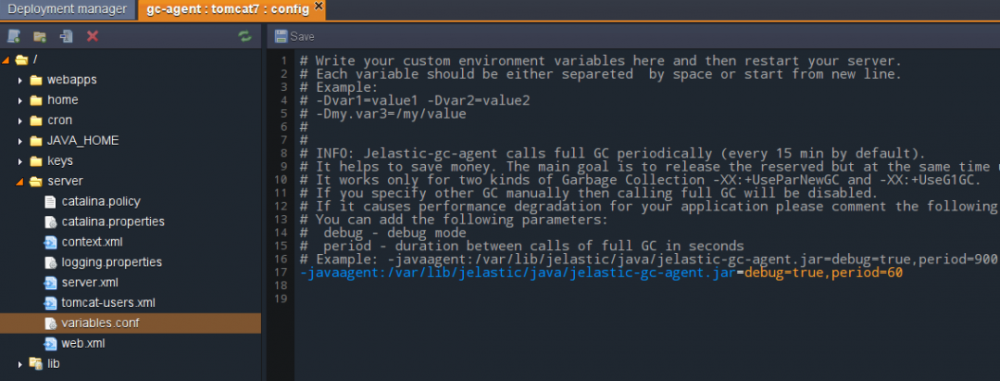
Please note that you can use both options (change the scan period and enable debug mode) together:
-javaagent: /var/lib/jelastic/java/jelastic-gc-agent.jar=debug=true,period=900
Save the changes and restart the server.
Checking garbage collection results
To display the results of the configured periodic system checks and free up memory, we will use the special Loader application .
1. Follow the link and download the Loader.war archive with the test application.
2. Download this .war archive to Jelastic.
3. Deploy this application in an environment with a Java application.
4. Open the configuration files and go to the server > variables.conf file to check the Jelastic agent Java settings.
In our case, to get the results as soon as possible, we changed the duration of the period to 60 seconds. If you change the settings, be sure to save the changes and restart the server.
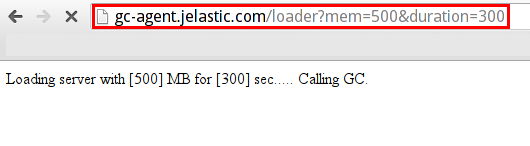
5. After that, open the application in a browser and add the following parameters to the link:
/ loader? Mem = 500 & duration = 300
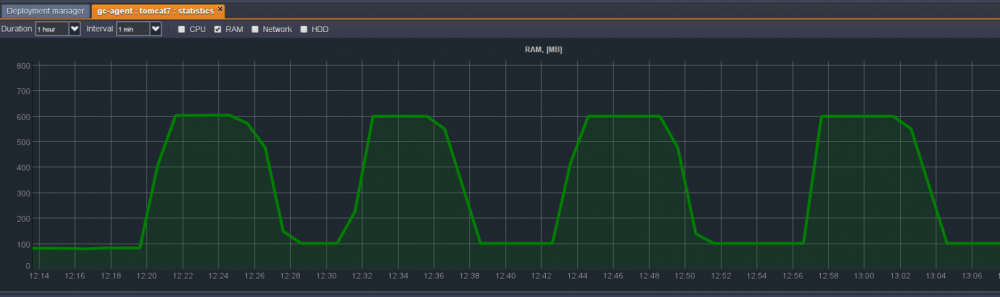
6. Now you can go to Statistics , where, after a while, you will see the results.
When you run an application request with parameters added to the link, memory consumption increases by 500 MB. This amount of memory will be used for 300 seconds (also in accordance with the specified parameter).
After that, memory usage will decrease as a result of the GC Jelastic agent starting to completely collect garbage. This is because the GC agent sees the opportunity to free memory, because the application has completed its active processes and no longer needs the full amount of memory.
You can run the test application a few more times to load the memory and check the process of freeing it.
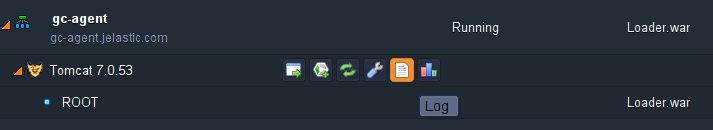
7. Since we have enabled debugging mode for our Java agent, we can also track the process in Log files.
The amount of available free memory (in bytes) can be found in the catalina logs .
Thus, using this method, you can improve memory management for your application, which will reduce JVM memory consumption. As a result, you will save your money and increase the productivity of your application.
300 rubles for Jelastic as a gift!
To everyone who has read until the end of the article, we give 300 rubles to your Jelastic account. Register in the trial version , after the trial is over, click on the "Switch to paid version" button in Jelastic, fill in the information about yourself and send your username to trukhinyuri@infoboxcloud.com .
Successful use of Jelastic in Infobox and good mood!