Algorithm Visualization
Data mining and data visualization specialist Mike Bostock has published an excellent collection with visualization of various algorithms.
The work is unique, in its own way, because in this case the graphic display is especially difficult to do: because, in fact, there is no data for analysis. “But the algorithms also demonstrate that visualization is more than just a tool for finding patterns among data,” writes Mike Bostock. “Visualization uses the human visual system to expand human intelligence : with it, we better understand important abstract processes and, I hope, other things too.”
Simply put, vision helps us think.
Mike Bostock is confident that his work helps to better understand the work of algorithms. Moreover, if someone wants to figure out the work of this or that algorithm, then it is best to try to do the visualization yourself, because trying to explain something is the best way to understand the subject.
In addition, a graphical representation of the problem helps to find errors in its implementation of the algorithm, and indeed, it is interesting in itself.
The author has published an animated representation of the following algorithms and processes:
Shuffle (shuffling)
Quick Sort
Merge Sort
generated mazes (maze generation)
Sampling
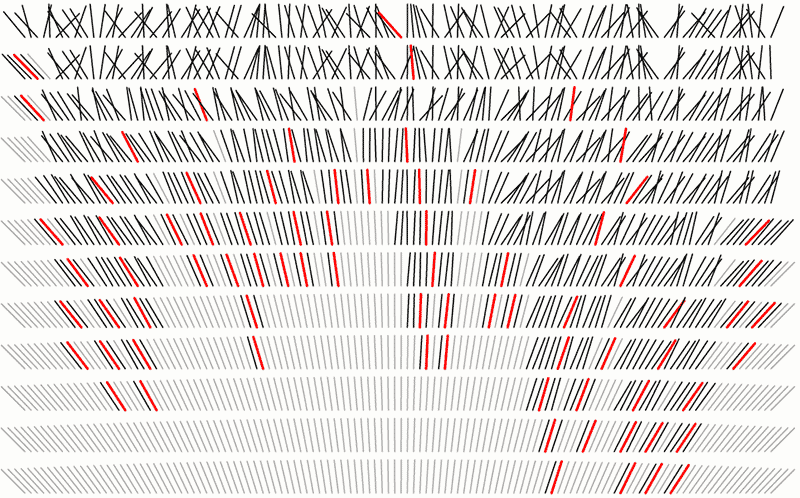
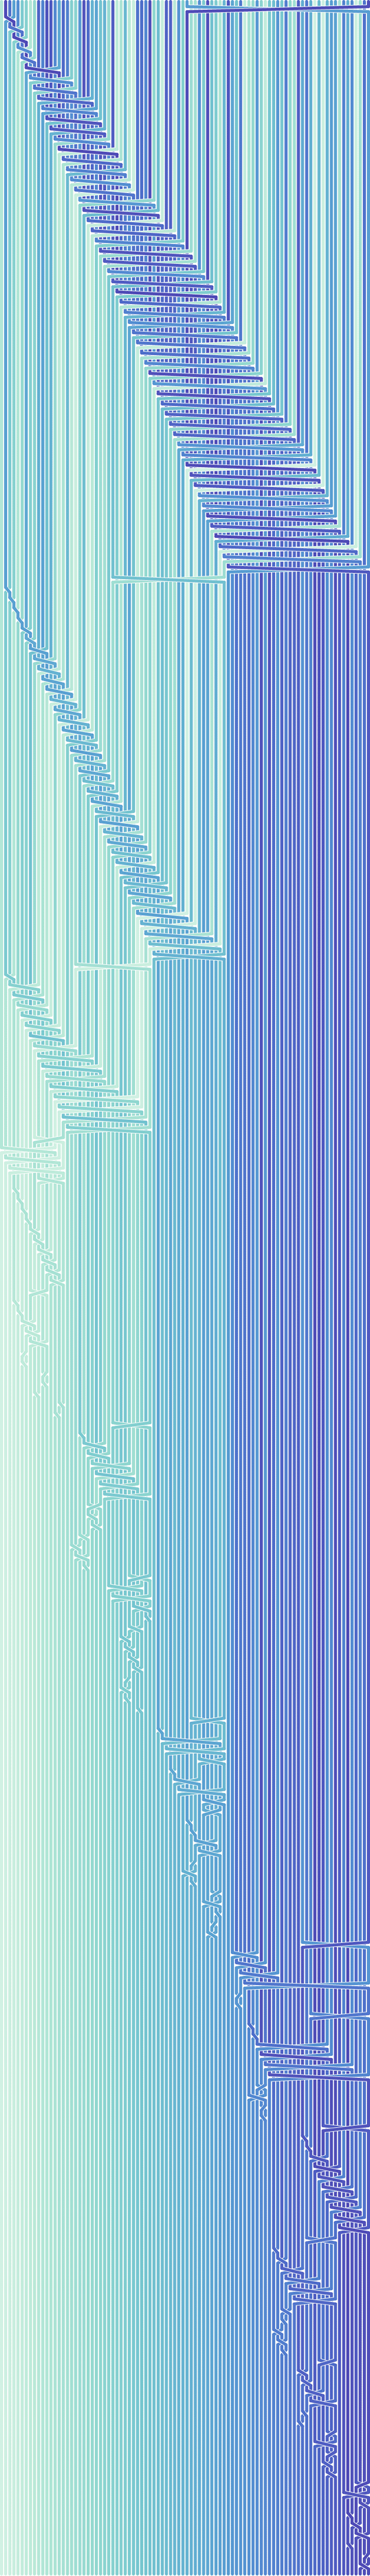
For example, for quick sorting, Mike Bostock offers three visualization options: 1) animation; 2) dense stationary exposure; and 3) rarefied stationary exposure. Each of the options has its advantages and disadvantages. So, it’s interesting to watch animation, but static pictures can be carefully studied in detail.
Two options for static rendering.
The work is unique, in its own way, because in this case the graphic display is especially difficult to do: because, in fact, there is no data for analysis. “But the algorithms also demonstrate that visualization is more than just a tool for finding patterns among data,” writes Mike Bostock. “Visualization uses the human visual system to expand human intelligence : with it, we better understand important abstract processes and, I hope, other things too.”
Simply put, vision helps us think.
Mike Bostock is confident that his work helps to better understand the work of algorithms. Moreover, if someone wants to figure out the work of this or that algorithm, then it is best to try to do the visualization yourself, because trying to explain something is the best way to understand the subject.
In addition, a graphical representation of the problem helps to find errors in its implementation of the algorithm, and indeed, it is interesting in itself.
The author has published an animated representation of the following algorithms and processes:
Shuffle (shuffling)
Quick Sort
Merge Sort
generated mazes (maze generation)
Sampling
For example, for quick sorting, Mike Bostock offers three visualization options: 1) animation; 2) dense stationary exposure; and 3) rarefied stationary exposure. Each of the options has its advantages and disadvantages. So, it’s interesting to watch animation, but static pictures can be carefully studied in detail.
Quick sort
function quicksort(array, left, right) {
  if (left < right - 1) {
    var pivot = (left + right) 9>> 1;
    pivot = partition(array, left, right, pivot);
    quicksort(array, left, pivot);
    quicksort(array, pivot + 1, right);
  }
}
function partition(array, left, right, pivot) {
  var pivotValue = array[pivot];
  swap(array, pivot, --right);
  for (var i = left; i < right; ++i) {
    if (array[i] < pivotValue) {
      swap(array, i, left++);
    }
  }
  swap(array, left, right);
  return left;
}
Two options for static rendering.

