Snap is a new reporting platform. Part 1
It's cool when reports are made not by programmers, but by the users themselves. But most of the existing report designers are insanely complex. Imagine how great it would be if your chief accountant could design your reports right in Word! Fantasy? Not at all. This is Snap from DevExpress .
See for yourself how easy this control is for programmers and end users:
Under the cut you will find a detailed description of everything that Snap can do at the moment.
We did not write a new product from scratch. Our Rich Text Editor , which implements the entire infrastructure for creating complex documents, both from the user interface and completely from the code, was taken as the basis . Using the Rich Text Editor allows you to conveniently and quickly create templates for simple and master-detail reports, without requiring additional software , and then change them , without being attached to the internal arrangement of a specific format . A serious plus to this is the ability to use end-user skills with Microsoft Word.
Then we added the data source preparation wizard used in our components, which allows users to add the data they need to work with little or no developer intervention.
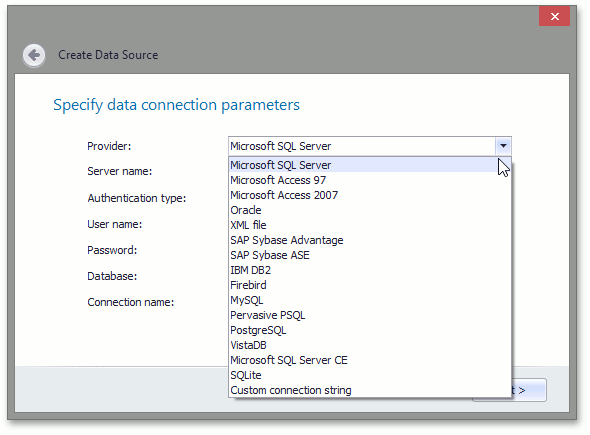
You can specify data sources not only through the user interface. Choice options are provided - in design mode or dynamically from code, at the program execution stage. After the data source has been selected and configured accordingly, you can begin to create complete reports.
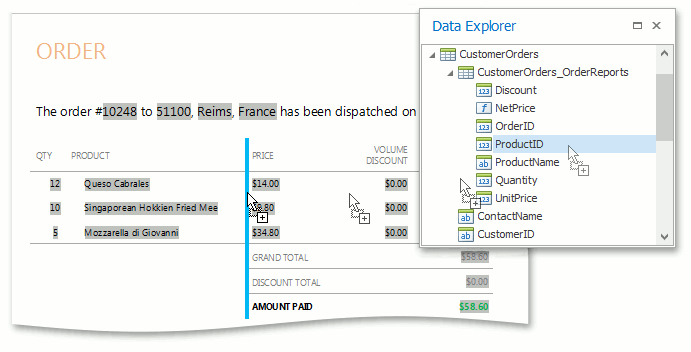
The data structure will be visually displayed in the browser panel. In order to get a finished document, simply select the required fields and drag them to the desired location, or simply double-click on them - in this case they will be added in accordance with the current position of the carriage. If you need to add data to an already created table, then this can easily be done using hot zones.

In this case, real data will be immediately used - in fact, the designer does not just create placeholders for dynamic content, but shows the final form of the report. The only difference from the end result is that a limited number of records are used in development mode. The selected data will automatically be grouped into a table, but if desired, it is easy to convert to plain text.
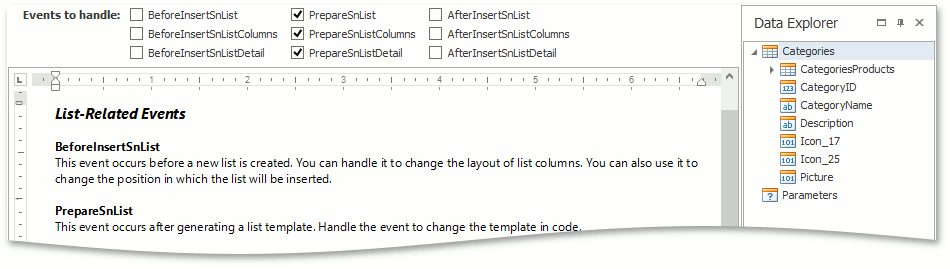
Also, the data insertion process can be more finely tuned using a well-thought-out set of events that notify of each step in the preparation of the document.
At the same time, for one report, you can use as many independent data sources as you like, and using tables or multi-column layout of the document, they can be easily compared.
It is important that Snap is a WYSIWYG editor in the full sense of the word. Regardless of whether you create a new report, modify an existing one, or use the print preview function, the document looks exactly like it will look on paper.
In addition to simply inserting data into a document, Snap provides an impressive set of functions for processing and presenting it in the right form, which includes the ability to group, sort, filter, analyze and calculate, use parameters and calculated fields, and format the results.

Not all data is conveniently presented in plain text. Snap has a whole arsenal of data visualization tools, including checkboxes, images, barcodes, graphs and sparklines.

No reporting tool can be called complete if it does not provide a simple and convenient way to create hierarchical reports.
A widespread scenario, which I would like to dwell on in more detail, is mail merge - creating a large number of documents of the same type based on a common template, in particular, preparing a mailing list with the extraction of names and addresses from the database. In order to switch the document to the preparation mode of such a template, simply select the appropriate context menu item for one of the added data sources.
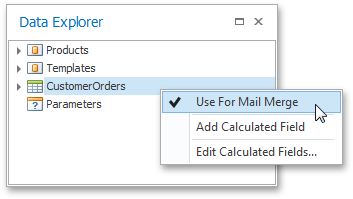
Of course, you can choose a data source in this way from the code. After that, Snap will consider the entire document as a template that must be repeated for each entry in the source. The mail merge mode also supports hierarchical data for reporting.
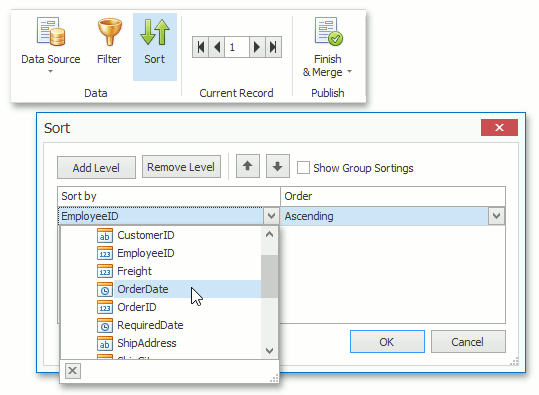
After the necessary data is added to the template, they can be processed, as in the case of a regular report. You can sort by ordering the records based on the value of one or more fields.
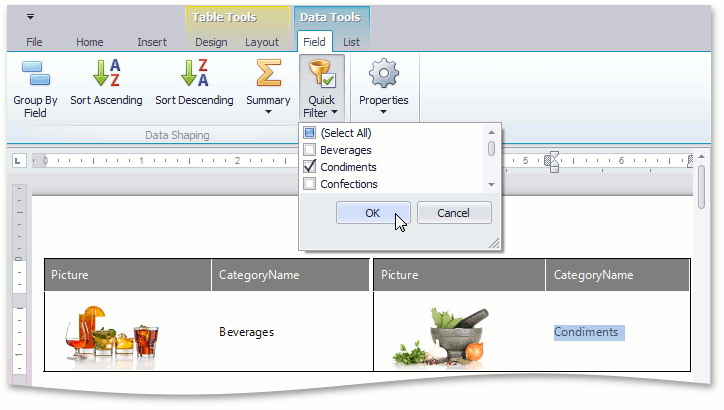
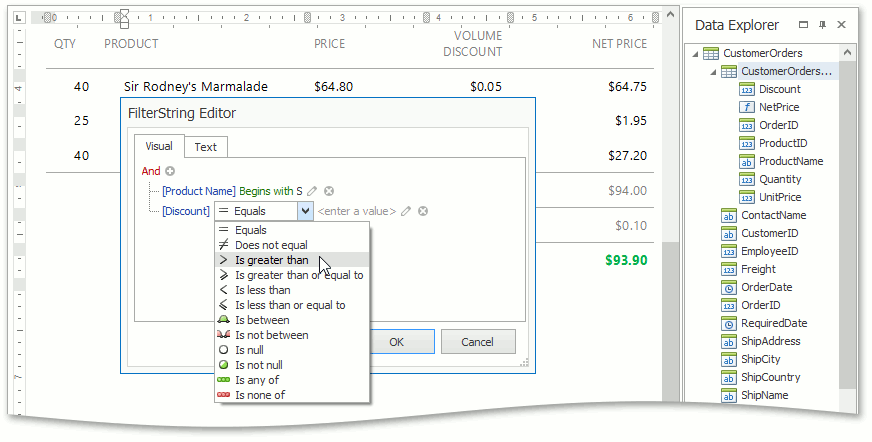
And you can filter the data to show only the necessary information. At the same time, Snap provides two possible scenarios for filtering data. You can simply explicitly select the entries that should be shown:

If simple selection is not enough, you can create a complex selection condition using the appropriate dialog:
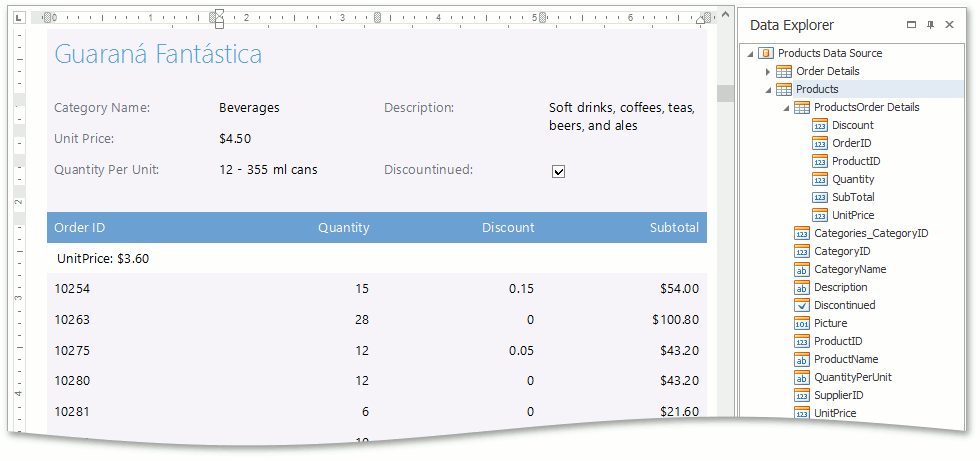
Now that everything is ready, you can see the result for a specific entry:

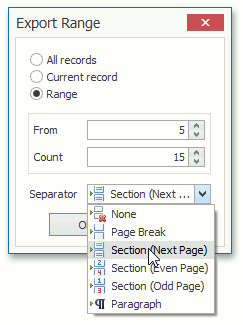
Or get the final result by sending a report to print, export it to any supported format (for example, doc, docx, rtf, odt, html, mht, pdf) or display it in a separate window in the preview mode. You can also choose which records should be included in the final document and how to separate each of the records.
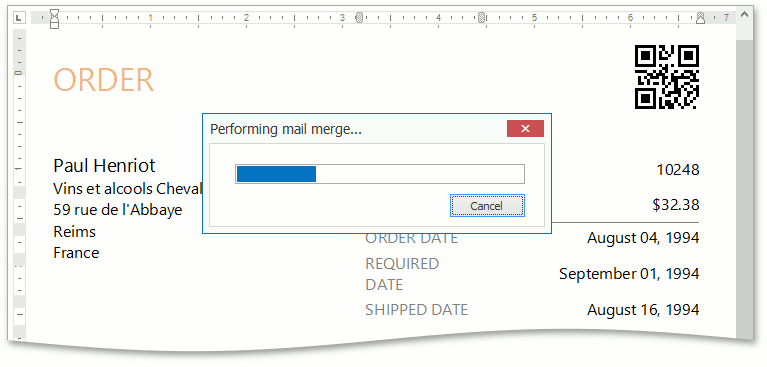
Since the operation of creating the resulting report can take considerable time, we made sure that it was carried out in a separate thread, allowing you to interact with the main application, monitor the progress of the generation and, if necessary, interrupt the creation of the report.
A boring standard form can easily be replaced with something prettier:

And now, a fly in the ointment - currently Snap is only available on the WinForms platform.
Nevertheless, I really hope that you are interested in the product. You can get to know him better by downloading the trial version .
In the second part of the article we look under the hood and get to know the technical details. I will demonstrate working with the API on the example of popular tasks that arise when preparing a report and try to prove that the ease of use by the end user was achieved without sacrificing functionality. If you have any questions - ask them in the comments, I will be glad to answer everyone.
See for yourself how easy this control is for programmers and end users:
Under the cut you will find a detailed description of everything that Snap can do at the moment.
We did not write a new product from scratch. Our Rich Text Editor , which implements the entire infrastructure for creating complex documents, both from the user interface and completely from the code, was taken as the basis . Using the Rich Text Editor allows you to conveniently and quickly create templates for simple and master-detail reports, without requiring additional software , and then change them , without being attached to the internal arrangement of a specific format . A serious plus to this is the ability to use end-user skills with Microsoft Word.
Then we added the data source preparation wizard used in our components, which allows users to add the data they need to work with little or no developer intervention.
You can specify data sources not only through the user interface. Choice options are provided - in design mode or dynamically from code, at the program execution stage. After the data source has been selected and configured accordingly, you can begin to create complete reports.
The data structure will be visually displayed in the browser panel. In order to get a finished document, simply select the required fields and drag them to the desired location, or simply double-click on them - in this case they will be added in accordance with the current position of the carriage. If you need to add data to an already created table, then this can easily be done using hot zones.
In this case, real data will be immediately used - in fact, the designer does not just create placeholders for dynamic content, but shows the final form of the report. The only difference from the end result is that a limited number of records are used in development mode. The selected data will automatically be grouped into a table, but if desired, it is easy to convert to plain text.
Also, the data insertion process can be more finely tuned using a well-thought-out set of events that notify of each step in the preparation of the document.
At the same time, for one report, you can use as many independent data sources as you like, and using tables or multi-column layout of the document, they can be easily compared.
It is important that Snap is a WYSIWYG editor in the full sense of the word. Regardless of whether you create a new report, modify an existing one, or use the print preview function, the document looks exactly like it will look on paper.
In addition to simply inserting data into a document, Snap provides an impressive set of functions for processing and presenting it in the right form, which includes the ability to group, sort, filter, analyze and calculate, use parameters and calculated fields, and format the results.
Not all data is conveniently presented in plain text. Snap has a whole arsenal of data visualization tools, including checkboxes, images, barcodes, graphs and sparklines.
No reporting tool can be called complete if it does not provide a simple and convenient way to create hierarchical reports.
A widespread scenario, which I would like to dwell on in more detail, is mail merge - creating a large number of documents of the same type based on a common template, in particular, preparing a mailing list with the extraction of names and addresses from the database. In order to switch the document to the preparation mode of such a template, simply select the appropriate context menu item for one of the added data sources.
Of course, you can choose a data source in this way from the code. After that, Snap will consider the entire document as a template that must be repeated for each entry in the source. The mail merge mode also supports hierarchical data for reporting.
After the necessary data is added to the template, they can be processed, as in the case of a regular report. You can sort by ordering the records based on the value of one or more fields.
And you can filter the data to show only the necessary information. At the same time, Snap provides two possible scenarios for filtering data. You can simply explicitly select the entries that should be shown:
If simple selection is not enough, you can create a complex selection condition using the appropriate dialog:
Now that everything is ready, you can see the result for a specific entry:
Or get the final result by sending a report to print, export it to any supported format (for example, doc, docx, rtf, odt, html, mht, pdf) or display it in a separate window in the preview mode. You can also choose which records should be included in the final document and how to separate each of the records.
Since the operation of creating the resulting report can take considerable time, we made sure that it was carried out in a separate thread, allowing you to interact with the main application, monitor the progress of the generation and, if necessary, interrupt the creation of the report.
A boring standard form can easily be replaced with something prettier:
And now, a fly in the ointment - currently Snap is only available on the WinForms platform.
Nevertheless, I really hope that you are interested in the product. You can get to know him better by downloading the trial version .
In the second part of the article we look under the hood and get to know the technical details. I will demonstrate working with the API on the example of popular tasks that arise when preparing a report and try to prove that the ease of use by the end user was achieved without sacrificing functionality. If you have any questions - ask them in the comments, I will be glad to answer everyone.