As we wrote another RFM analysis algorithm
 We recently explained why we invented our RFM segmenter, which helps to make RFM analysis in 20 seconds , and showed how to use its results in marketing.
Now we tell how it works.
Task: write a new RFM analysis algorithm
We are not satisfied with the existing approaches to RFM-analysis. Therefore, we decided to make our segmentator, which:
- It works fully automatically.
- Builds from 3 to 15 segments.
- It adapts to any field of activity of the client (no matter what it is: a flower shop or power tools).
- Determines the number and location of segments based on available data, rather than predetermined parameters that cannot be universal.
- Allocates segments so that they always have consumers (unlike some approaches, when part of the segments are empty).
How to solve the problem
When we realized the task, we realized that it was beyond the power of man, and asked for help from artificial intelligence. To teach the car to divide consumers into segments, we decided to use clustering methods .
Clustering methods are used to search for structures in the data and select groups of similar objects in them - just what is needed for RFM analysis.
Clustering refers to the methods of machine learning class " learning without a teacher ." The class is called like this because there is data, but no one knows what to do with it, so it cannot teach the machine.
We were not able to find companies using a similar approach in the market. Although found one article in which the author conducts scientific research on this topic. But, as we understood from experience, from science to business is not a single step.
Stage 1. Data pre-processing
Data needs to be prepared for clustering.
First, we check them for incorrect values: negative values, etc.
Then remove the emissions - consumers with unusual characteristics. They are few, but they can greatly affect the result, and not for the better. To separate them, we use a special method of machine learning - Local Outlier Factor .

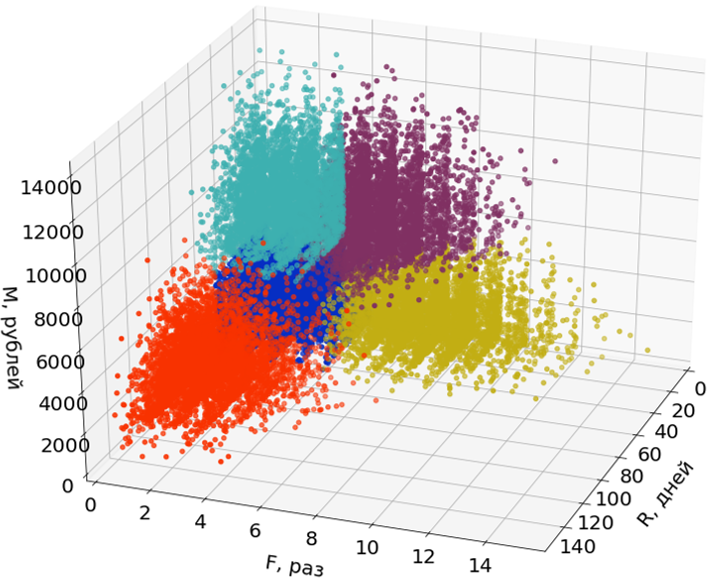
Here in the pictures I use only two dimensions (R and M) out of three to facilitate perception.
Emissions are not involved in the construction of segments, but are distributed among them after the segments are formed.
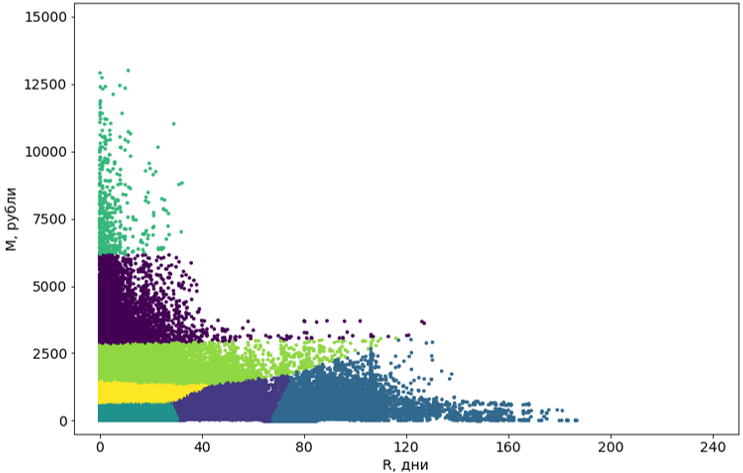
Stage 2. Consumer Clustering
I clarify the terminology: clusters I call groups of objects, which are obtained as a result of using clustering algorithms, and segments — the final result, that is, the result of RFM analysis.
There are several dozen clustering algorithms. Examples of some of them can be found in the documentation package scikit-learn .
We tried eight algorithms with various modifications. Most lacked memory. Or the time of their work sought to infinity. Almost all the algorithms that were technically able to cope with the task produced terrible results: for example, the popular DBSCAN considered 55% of objects to be noise, and divided the rest into 4302 clusters.
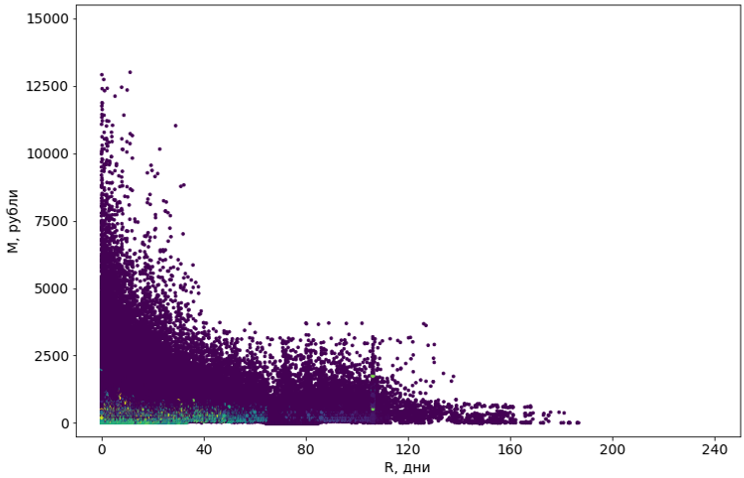
Violet objects are defined as “noise”
As a result, we chose the K-Means (K-Means) algorithm , because it does not look for clusters of points, but simply groups the points around the centers. As it turned out, this was the right decision.
But first we solved several problems:
Instability. This is a known problem of most clustering algorithms and K-Means as well. The instability is that when you restart, the results can be different, because the element of randomness is used.
Therefore, we cluster many times, and then cluster again, but already the centers of the clusters. As the final cluster centers, we take the centers of the obtained clusters (that is, the clusters formed by the centers of the first clusters).The number of clusters. The data may be different, and the number of clusters must also be different.
To find the optimal number of clusters for each customer base, we perform clustering with a different number of clusters, and then choose the best result .Speed. The K-means algorithm does not work very quickly, but is acceptable (a few minutes for an average base of several hundred thousand consumers). However, we run it many times: firstly, to increase stability, secondly, to select the number of clusters. And the work time increases very much.
To speed up, we use a modification of Mini Batch K-Means . It recounts the centers of the clusters at each iteration not for all objects, but only for a small subsample. Quality falls quite a bit, but time is reduced significantly.
As soon as we solved these problems, clustering began to pass successfully.
Stage 3. Post-processing clusters
The clusters obtained with the help of the algorithm should be brought to a convenient form for perception.
First, we turn these clusters from curves into rectangular. Actually, this makes them segments. The rectangularity of the segments is a requirement of our system and, in addition, adds clarity to the segments themselves. For the transformation, we use another machine learning algorithm, the decision tree .
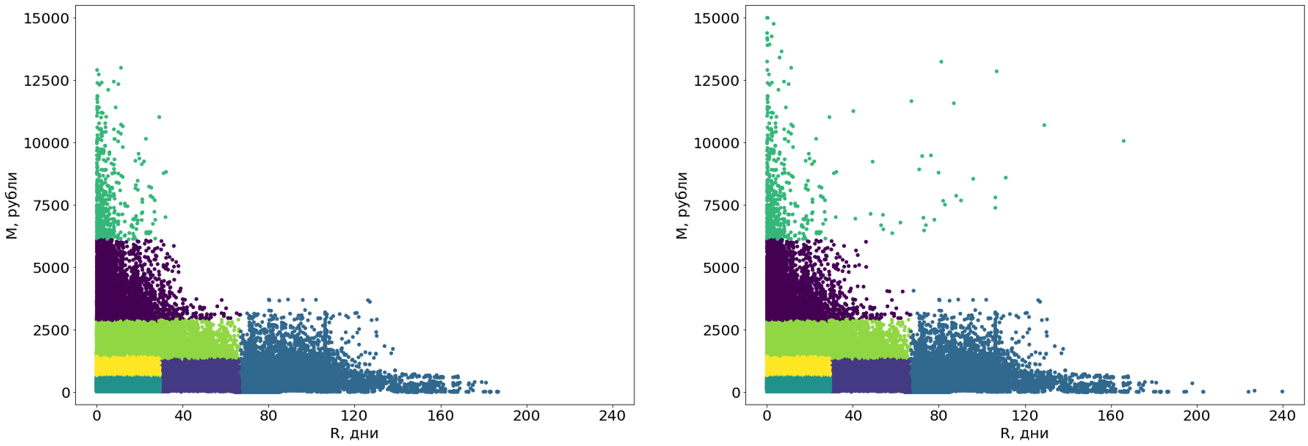
The decisive tree is built on data without emissions, and emissions are then distributed to ready-made segments.
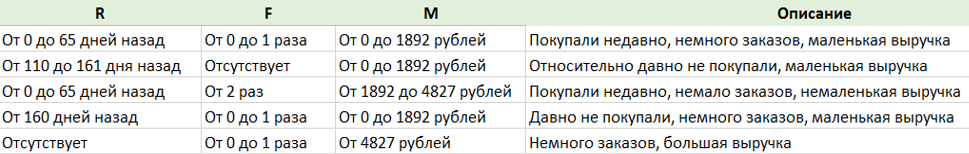
Secondly, we have done another cool thing - the description of the segments. A special algorithm, using a dictionary, describes each segment in live Russian, so that people do not feel depressed looking at soulless numbers.
Testing results
The product is ready. But before you start selling it, you need to test it. That is, check whether the RFM analysis is performed as we intended.
We know that the best way to understand whether we have done something worthwhile is to find out how useful the analysis is to our customers. And we will do that. But this is a long time, and the results will come later, and we want to know how successfully we have accomplished the task right now.
Therefore, we used the “historical control group” method as a simpler and faster metric.
To do this, they took several databases and progegmented them using RFM-analysis for different moments of the past: one database for the state six months ago, another for a year ago, etc.
Based on each segmentation for each base, we built our own forecast of customer actions from the selected moment to the present. Then they compared these predictions with the real behavior of the buyers.
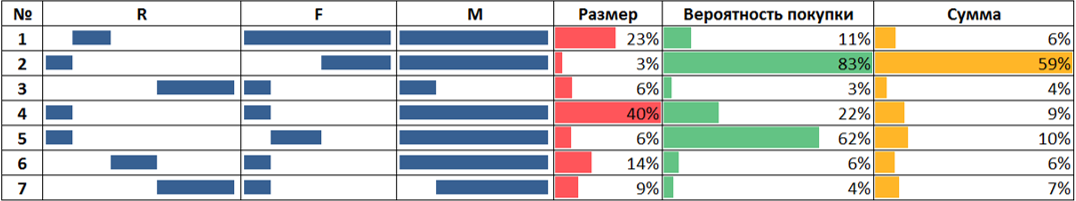
An example of testing on a historical control group with a control period of six months
On the picture:
- The columns R, F and M conditionally denote the boundaries of the segments along each axis. This is the result of a base segmentation as it was six months ago.
- The Size column shows the size of a segment six months ago relative to the total size of the base.
- The “Probability of purchase” and “Amount” columns are data on the real behavior of consumers over the next six months.
- The probability of purchase is defined as the ratio of the number of consumers from the segment who made the purchase to the total number of consumers in the segment.
- Amount - the total amount spent by consumers from the segment relative to the amount spent by consumers from all segments.
The results coincided. For example, customers from segments for which we predicted a high frequency of purchases were actually buying more often.
Although we cannot, on the basis of such testing, guarantee the correct operation of the algorithm by 100 percent, we decided that it was successful.
What we understood
Machine learning is really capable of helping a business solve unsolvable or very poorly solvable problems.
But the real challenge is not a Kaggle competition. Here, in addition to achieving better quality for a given metric, you need to think about how much the algorithm will work, whether it will be convenient for people and, in general, whether you need to solve the problem with ML or you can think of a simpler way.
And finally, the lack of a formal quality metric complicates the task several times because it is difficult to correctly evaluate the result.