Performance and Live - Innovations in Openstat Statistics
We organize an official information leak.
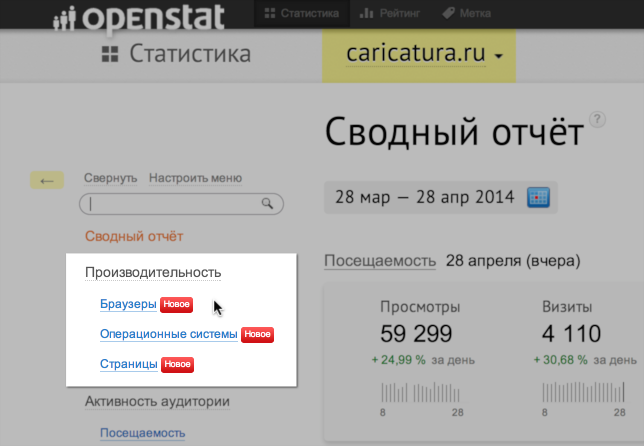
From this day on, Openstat statistics show a new group of reports and the first real-time metric graph. A set of new measurements under the general name "Performance" allows you to evaluate the speed of assembly of pages on your site for various users. The Openstat counter polls the browser for the results of loading and layout of each page; this data goes to the Openstat computing cluster, where reports are generated on their basis.
Important: the reports of the Performance group do not show synthetic data on the technical capabilities of the server for shipping the source of the pages, but real data - how many seconds a real user receives in his browser a page that is ready for viewing. With all its components, including display data, ad units and other components.
Similar measurements can be obtained using individual services available on the Web, but the result will be one-sided - from one or several sources and synthetic, since robots will make measurements.
The information from the Openstat counter shows the real picture, since the measurements obtained from the browsers of each real visitor to your site from each visit are taken into account.
Currently, the report group provides an opportunity to see the speed of receiving and assembling pages for users with mobile and desktop browsers, with their additional separation by families and even by versions.
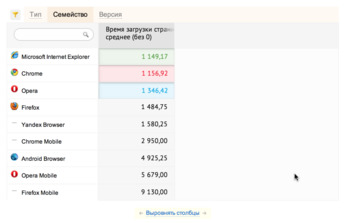
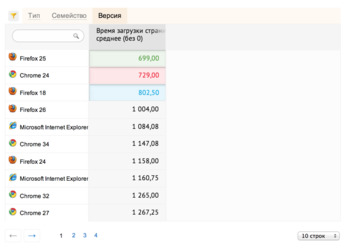
time is indicated in milliseconds.
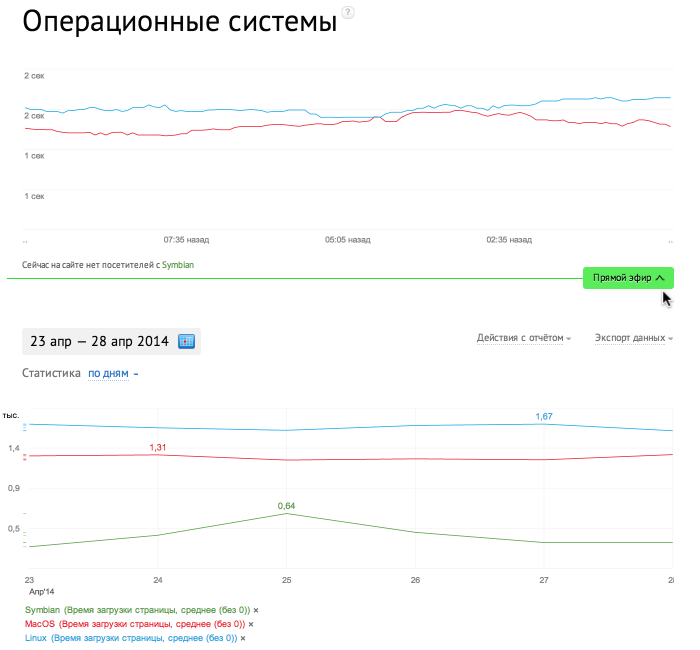
You can also compare the speed of "preparation" of the pages of your site on different operating systems.
For a more detailed performance study, statistics are provided separately for domains and any site pages; now it is possible to “tune” the most important pages with high accuracy, increasing the speed of their generation in the visitor’s browser.


I am convinced that it is very useful for business projects to measure and evaluate both the entire site and its individual pages.
In the same group of reports, the first “live” metric appeared, which we called “Live”.
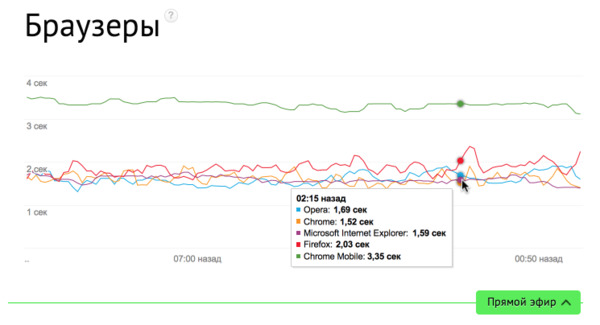
Updating once every few seconds, the graph shows the current data on the speed of delivery and page formation in the browsers of visitors to your sites.
Now, when you add another ad unit or other component to the code of your site, you can immediately evaluate its effect on the speed of page appearance before the eyes of your visitors and customers.
“Live” shows the data without delay - each open page of your site is immediately added to the dynamic picture of “Live”.
In the near future, the group of reports “Performance” will be replenished with new interesting and useful metrics, and other reports can acquire their own “live broadcasts”.
This is a blog post on a company. Therefore, leave comments and suggestions, we promise to consider them in a team in order to realize the most interesting.
Ru Kurepin
PS With this article, Ruslan Kurepin opens a new blog thread in which he will talk about the company Openstat and about the products that it produces.
From this day on, Openstat statistics show a new group of reports and the first real-time metric graph. A set of new measurements under the general name "Performance" allows you to evaluate the speed of assembly of pages on your site for various users. The Openstat counter polls the browser for the results of loading and layout of each page; this data goes to the Openstat computing cluster, where reports are generated on their basis.
Important: the reports of the Performance group do not show synthetic data on the technical capabilities of the server for shipping the source of the pages, but real data - how many seconds a real user receives in his browser a page that is ready for viewing. With all its components, including display data, ad units and other components.
Similar measurements can be obtained using individual services available on the Web, but the result will be one-sided - from one or several sources and synthetic, since robots will make measurements.
The information from the Openstat counter shows the real picture, since the measurements obtained from the browsers of each real visitor to your site from each visit are taken into account.
Currently, the report group provides an opportunity to see the speed of receiving and assembling pages for users with mobile and desktop browsers, with their additional separation by families and even by versions.
time is indicated in milliseconds.
You can also compare the speed of "preparation" of the pages of your site on different operating systems.
For a more detailed performance study, statistics are provided separately for domains and any site pages; now it is possible to “tune” the most important pages with high accuracy, increasing the speed of their generation in the visitor’s browser.
I am convinced that it is very useful for business projects to measure and evaluate both the entire site and its individual pages.
In the same group of reports, the first “live” metric appeared, which we called “Live”.
Updating once every few seconds, the graph shows the current data on the speed of delivery and page formation in the browsers of visitors to your sites.
Now, when you add another ad unit or other component to the code of your site, you can immediately evaluate its effect on the speed of page appearance before the eyes of your visitors and customers.
“Live” shows the data without delay - each open page of your site is immediately added to the dynamic picture of “Live”.
In the near future, the group of reports “Performance” will be replenished with new interesting and useful metrics, and other reports can acquire their own “live broadcasts”.
This is a blog post on a company. Therefore, leave comments and suggestions, we promise to consider them in a team in order to realize the most interesting.
Ru Kurepin
PS With this article, Ruslan Kurepin opens a new blog thread in which he will talk about the company Openstat and about the products that it produces.