Habra Analytics Tools: comparing hubs
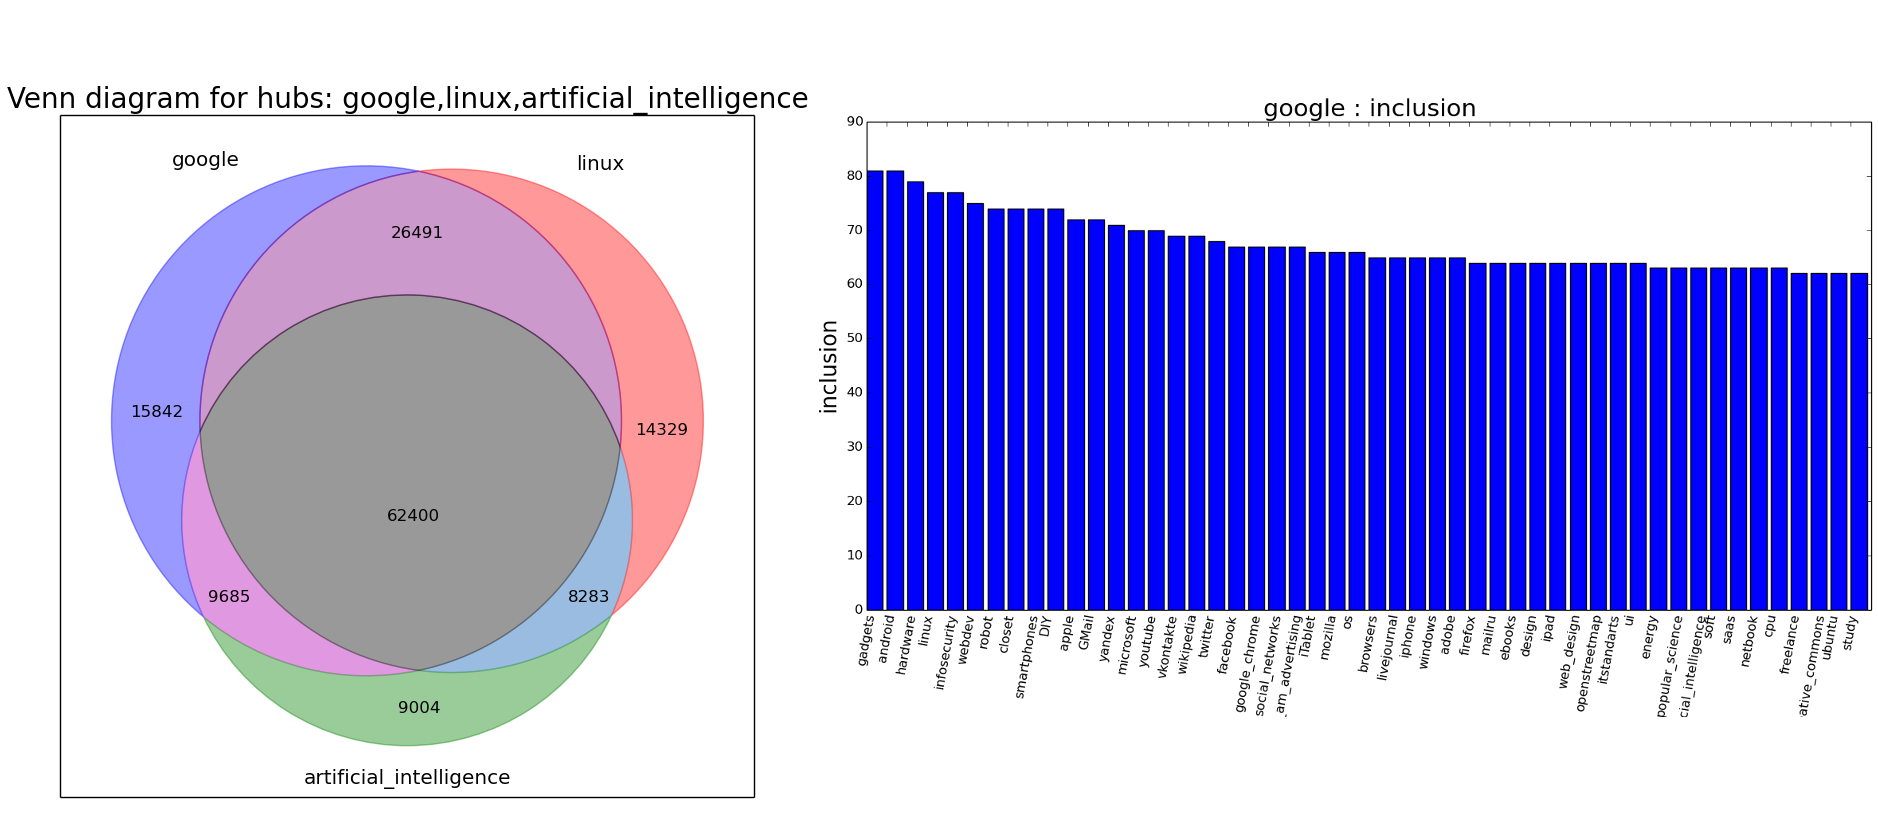
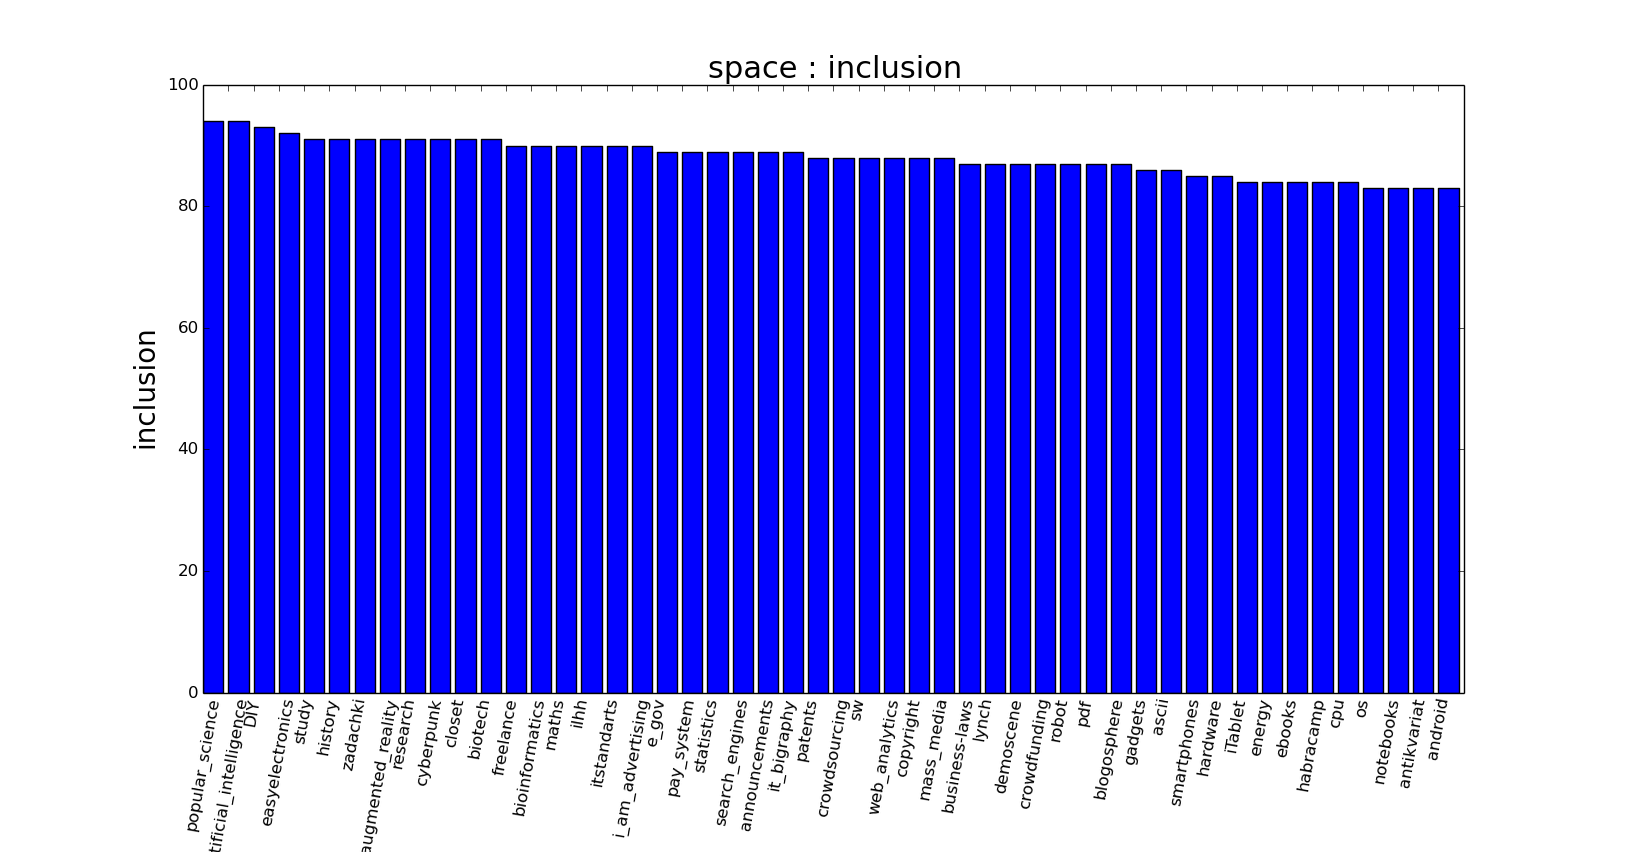
If you don’t read the Habr on weekends, you most likely missed the launch of the Habra Analytics Tools mini-project . The goal is simple - to provide Habrahabr authors with tools for analyzing articles and hubs. The first tools are devoted to the analysis and comparison of hubs, and above all, they are useful for assessing the audience of articles. For example, the graph on the right shows which hubs Google subscribers also read (the height of the column is the percentage of subscribers who also read hubs on the X axis), and the visual disposition on the other two hubs (Artificial Intelligence and Linux) on the left.
We discussed Venn diagrams earlier in this article , the sources are available on github (or ready-made executables for Windows , Linux
and Mac OS ) - you will also need to download and unzip data.7z (also required for this article).
Here we will talk about the preferences of readers of a particular hub in relation to all the other hubs of Habrahabr.
The source data of the tool called hubs is available on github , and executable files for Windows and Linux are also available there .
The most obvious use of the hubs tool is to analyze the preferences of the target audience. Imagine that we are writing for a corporate blog and want to know what else our subscribers are reading. What topics are they interested in? Consider the Yandex corporate blog as an example: For comparison, we ’ll give the Yandex hub (not a corporate blog): From the two graphs, we see that the preferences are significantly different (although they share some love for Google). Such a significant difference arises primarily due to the significant difference in the audience of the blog and the hub:

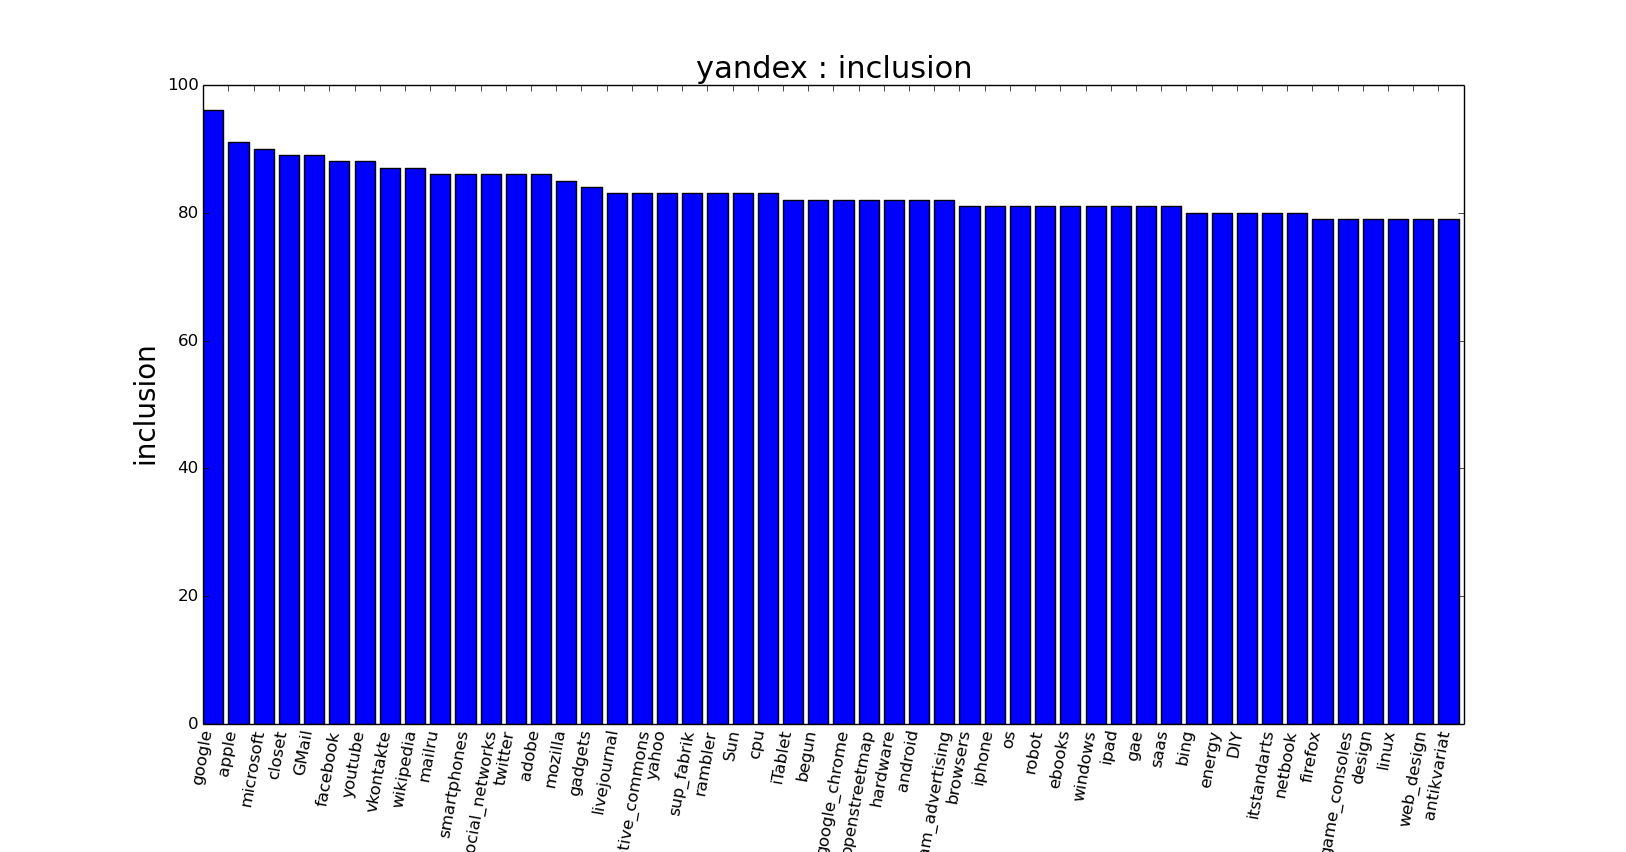
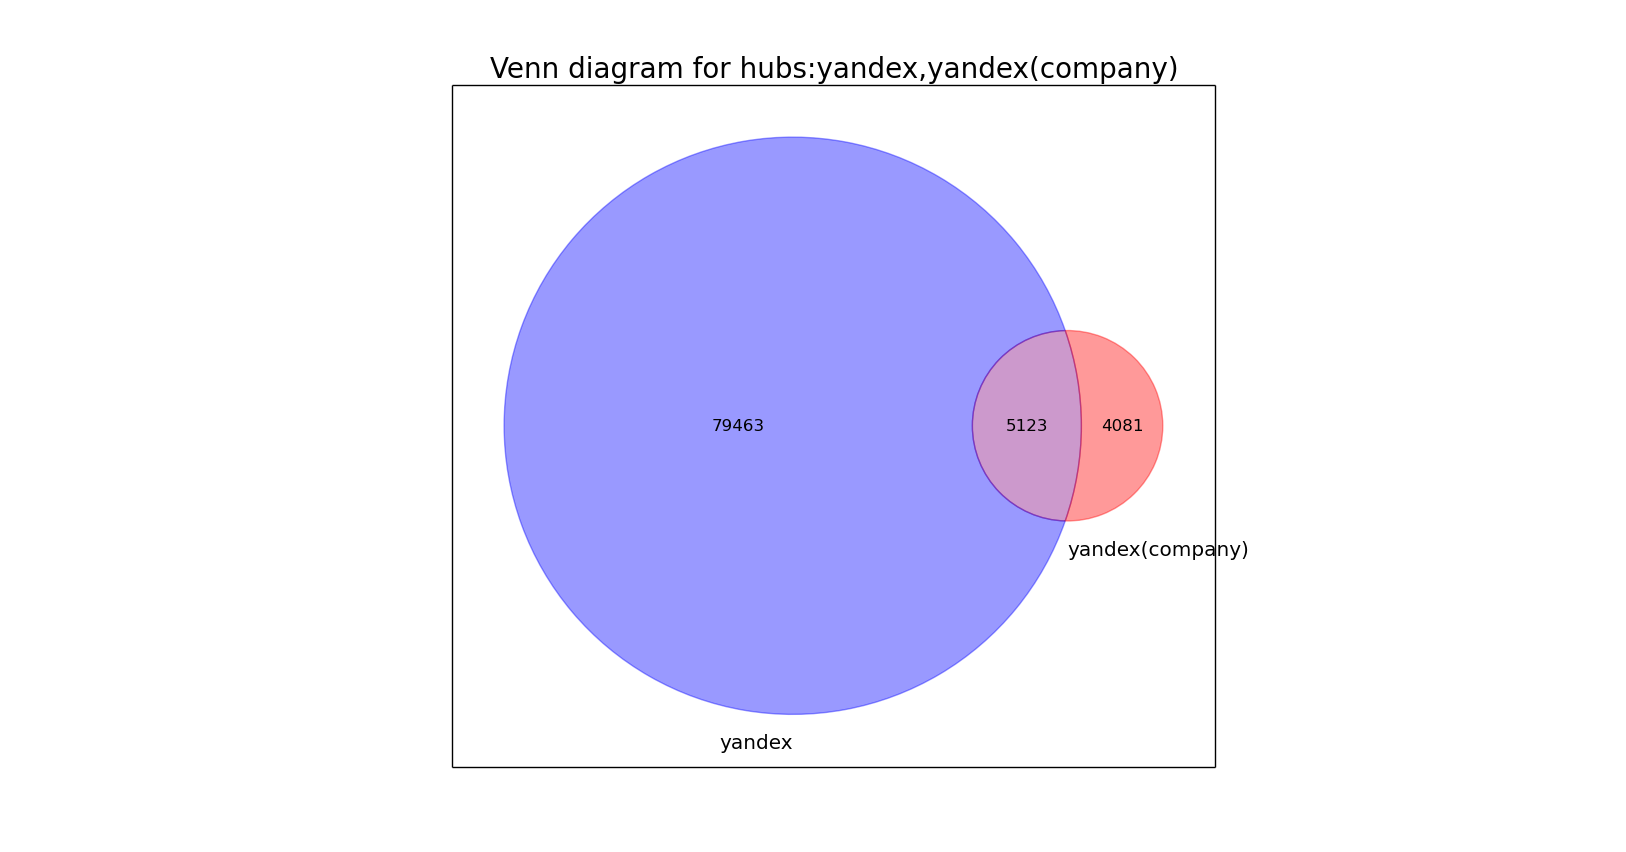
Thus, the Venn diagram tells us that the audience is significantly different, and the two histograms above show how exactly the tastes of the readers differ. So the decision about which hub to write to - in the corporate blog and / or in the regular hub, you can take into account the topic of the article and its compliance with user preferences from the histograms above.
If the Venn diagram tells the mutual arrangement of the audiences of two hubs and answers the question: “How will the audience of hub X grow if we add Y”, then the histogram of the hubs answers the question which hubs Z 1 , Z 2 , ... Z n look like a hub X?
Here we provide two metrics for comparing hubs:
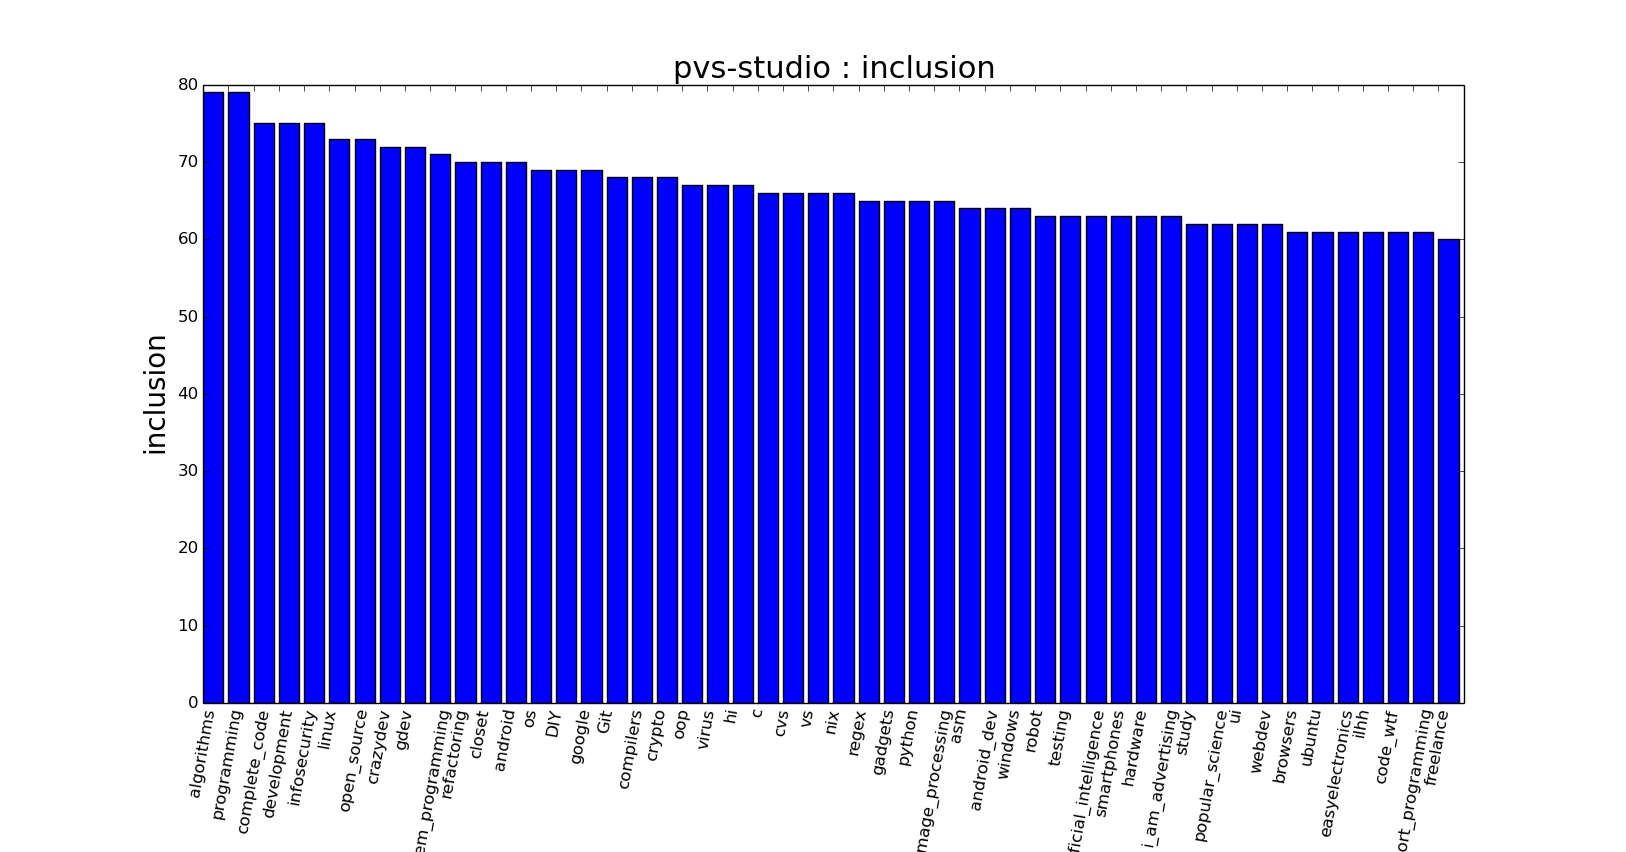
The first metric is best suited for the natural interpretation of the preferences of hub readers, and the second may be useful for automatically clustering hubs into a directory. Let us give an example with evaluating the preferences of readers of the hub: In this histogram, we see that the corporate hub has several major groups of readers, we will conditionally call them “development” - algorithms, programming etc, “security”, “Open source”, “refactoring” and “ Operating Systems". This factor can be taken into account when writing articles, for example, emphasizing certain aspects of interest to one of the reader groups.
To install, you must download either:
It is also necessary to download the data.7z archive (~ 15MB, unzipped ~ 200MB) and unzip it in the same directory as the script. Further, depending on the downloaded version, you must call
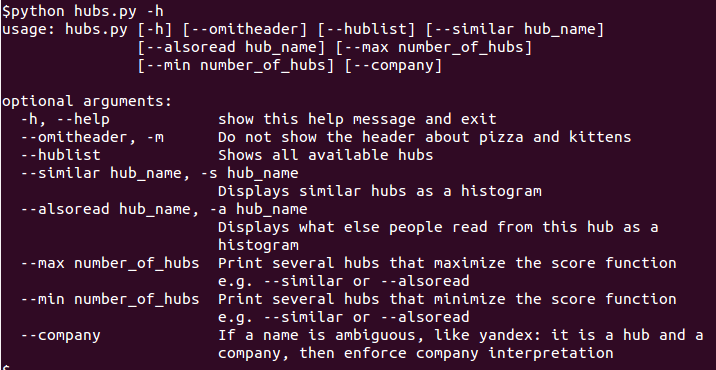
The script is a console one, therefore its most important command is help, accessible via the -h flags, --help:
display example:
The main command for displaying the “what else is read by the hub subscribers” histogram:
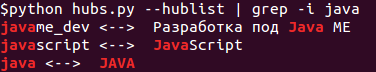
output example: For each hub in the program, the corresponding name is used from the link to this hub habrahabr.ru/hub space - for the Cosmonautics hub, space is the name in the program. The output of available hub names and their full names, all operations are performed using short Latin names from the list (they are also used in the url on the hub) Ideally used with the grep command: As mentioned earlier, yandex is a corporate blog and hub Disambiguate key used:
To create a histogram based on the Jacquard coefficient, use the key
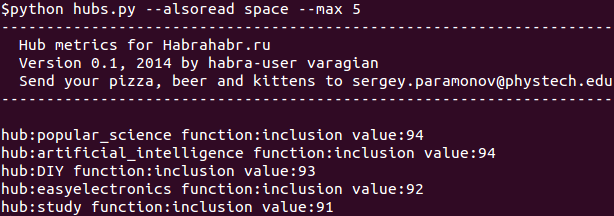
To display the maximum (minimum) values up to N hubs for inclusion or the Jacquard coefficient without the histogram itself, you must call the key
Monitor articles: after writing the article, you will need to call the tool
Web interface: all the same, but accessible via the web.
Ideas, comments, room help and suggestions are especially welcome.
and Mac OS ) - you will also need to download and unzip data.7z (also required for this article).
Here we will talk about the preferences of readers of a particular hub in relation to all the other hubs of Habrahabr.
The source data of the tool called hubs is available on github , and executable files for Windows and Linux are also available there .
Why is this needed?
The most obvious use of the hubs tool is to analyze the preferences of the target audience. Imagine that we are writing for a corporate blog and want to know what else our subscribers are reading. What topics are they interested in? Consider the Yandex corporate blog as an example: For comparison, we ’ll give the Yandex hub (not a corporate blog): From the two graphs, we see that the preferences are significantly different (although they share some love for Google). Such a significant difference arises primarily due to the significant difference in the audience of the blog and the hub:
Thus, the Venn diagram tells us that the audience is significantly different, and the two histograms above show how exactly the tastes of the readers differ. So the decision about which hub to write to - in the corporate blog and / or in the regular hub, you can take into account the topic of the article and its compliance with user preferences from the histograms above.
Similar hubs
If the Venn diagram tells the mutual arrangement of the audiences of two hubs and answers the question: “How will the audience of hub X grow if we add Y”, then the histogram of the hubs answers the question which hubs Z 1 , Z 2 , ... Z n look like a hub X?
Here we provide two metrics for comparing hubs:
- If z% of the readers of the hub X read Y, then X ~ Y = z, for example, if 10% of the readers of the Cosmonautics hub are subscribed to the C ++ hub, then 10 is the degree of similarity of the Cosmonautics hubs to C ++ (this ratio is not symmetrical)
- Jacquard_coefficient :

The first metric is best suited for the natural interpretation of the preferences of hub readers, and the second may be useful for automatically clustering hubs into a directory. Let us give an example with evaluating the preferences of readers of the hub: In this histogram, we see that the corporate hub has several major groups of readers, we will conditionally call them “development” - algorithms, programming etc, “security”, “Open source”, “refactoring” and “ Operating Systems". This factor can be taken into account when writing articles, for example, emphasizing certain aspects of interest to one of the reader groups.
Code, documentation and examples
To install, you must download either:
It is also necessary to download the data.7z archive (~ 15MB, unzipped ~ 200MB) and unzip it in the same directory as the script. Further, depending on the downloaded version, you must call
python hubs.pyeither ./hubs.eflor hubs.exe. We will stick to the first version.Main teams
The script is a console one, therefore its most important command is help, accessible via the -h flags, --help:
python hubs.py -hdisplay example:
The main command for displaying the “what else is read by the hub subscribers” histogram:
python hubs.py --alsoread spaceoutput example: For each hub in the program, the corresponding name is used from the link to this hub habrahabr.ru/hub space - for the Cosmonautics hub, space is the name in the program. The output of available hub names and their full names, all operations are performed using short Latin names from the list (they are also used in the url on the hub) Ideally used with the grep command: As mentioned earlier, yandex is a corporate blog and hub Disambiguate key used:
python hubs.py --hublist --company. Therefore, to create a chart for the corporate blog Yandex is necessary to call: python hubs.py --alsoread yandex --company. To create a histogram based on the Jacquard coefficient, use the key
--similar: python hubs.py --similar spaceTo display the maximum (minimum) values up to N hubs for inclusion or the Jacquard coefficient without the histogram itself, you must call the key
--max ( --min):Ideas for the following tools
Monitor articles: after writing the article, you will need to call the tool
monitor $article_id and it will record and draw the change in views (pluses, etc) in time, as well as shares and likes on social networks and possibly readers' comments. Web interface: all the same, but accessible via the web.
Ideas, comments, room help and suggestions are especially welcome.