We segment 600 million users in real time every day.
Every day, users commit millions of actions on the Internet. FACETz DMP needs to structure this data and carry out segmentation to identify user preferences. In the material, we will talk about how the team segmented an audience of 600 million people, processed 5 billion events daily, and worked with statistics using Kafka and HBase.
The material is based on the transcript of the report by Artem Marinov , a big data specialist at Directual, from the 2017 SmartData conference.
My name is Artem Marinov, I want to tell you about how we reworked the architecture of the FACETz DMP project when I worked at the Data Centric Alliance company. Why we did it, what it led to, what path we took and what problems we faced.
DMP (Data Management Platform) - a platform for collecting, processing and aggregation of user data. Data is a lot of different things. The platform has about 600 million users. These are millions of cookies that go on the Internet and make various events. In general, an average day looks like this: we see about 5.5 billion events per day, they are somehow spread over the day, and at peak they reach about 100 thousand events per second. Events are various user signals. For example, a visit to the site: we see from which browser the user goes, his useragent and everything we can extract. Sometimes we see how and by what search queries he came to the site. It can also be various data from the offline world, for example, that it pays with discount coupons and so on.
We need to save this data and mark the user in the so-called groups of auditorium segments. For example, segments can be a "woman" who "loves cats" and is looking for a "car service", she "has a car older than three years."
Why segment a user? There are many applications for this, for example, advertising. Different ad networks can optimize ad serving algorithms. If you advertise your car service, you can set up a campaign to show information only to people who have an old car, excluding the owners of the new ones. You can dynamically change the content of the site, you can use the data for scoring - many applications.
The data comes from a variety of completely different places. These can be direct pixel installations - this is if the client wants to analyze his audience, he puts a pixel on the site, an invisible picture that is loaded from our server. The point is that we see the user’s visit to this site: you can save it, start analyzing and understand the user's portrait, all this information is available to our client.

Data can be obtained from various partners who see a lot of data and want to monetize them in various ways. Partners can deliver data in real time as well as make periodic uploads as files.
Key requirements:
One of the key requirements of the system is horizontal scalability. There is such a moment that when you develop a portal or an online store, you can estimate the number of your users (how it will grow, how it will change) and roughly understand how many resources are needed, and how the store will live and develop over time.
When you develop a platform like DMP, you need to be prepared for the fact that any large site — a conditional Amazon — can put your pixel in it, and you will have to work with the traffic of this entire site, and you don’t have to fall, and Systems should not change from this.
It is also quite important to be able to understand the volume of a certain audience, so that a potential advertiser or someone else can work out a media plan. For example, a man comes to you and asks you to find out how many pregnant women from Novosibirsk are looking for a mortgage, in order to assess whether it makes sense to target them or not.
From the point of view of development, you need to be able to coolly monitor everything that is happening in your system, debug some part of the real traffic, and so on.
One of the most important requirements for the system is a good reaction rate to events. The faster systems respond to events, the better, obviously. If you are looking for theater tickets, then if you see some kind of discount event a day later, two days or even an hour - this may be irrelevant, since you could already buy tickets or go to a show. When you are looking for a drill - you are looking for it, find, buy, hang a shelf, and after a couple of days the bombing begins: “Buy a drill!”.
Article in general about the processing of architecture. I would like to tell you what was our starting point, how everything worked before the changes.
All the data that we had, be it a direct data stream or logs, was added to HDFS - distributed file storage. Then there was a process that periodically started, took all the raw files from HDFS and converted them to requests for data enrichment in HBase (“PUT requests”).
This is a column time series database. She has the concept of Row Key - this is the key under which you store your data. We use the user ID, the user id, which we generate when we see the user for the first time as a key. Inside each key, the data is divided into Column Family - entities, at the level of which you can manage the meta-information of your data. For example, you can store a thousand record versions for Column Family "data" and store them for two months, and for Column Family "raw", a year, as an option.
Within the Column Family there is a lot of Column Qualifier (the column). We use different user attributes for column. This may be the URL that he went to, the IP address, the search query. And the most important thing is that inside each column is stored a lot of information. Inside the column URL it can be indicated that the user went to smartdataconf.ru, then to some other sites. And the timestamp is used as a version - you see the ordered history of user visits. In our case, we can determine that the user came to the site smartdataconf by the keyword "conference", because they have the same timestamp.
There are several options for working with HBase. These can be PUT requests (data change request), GET request (“give me all the data on Vasya’s user,” and so on). You can run SCAN queries - multi-threaded sequential scanning of all data in HBase. This is what we used earlier for marking in the classroom segments.
There was a task called Analytics Engine, it was run once a day and scanned HBase in several threads. For each user, she picked up the whole story from HBase and drove through a set of analytical scripts.

What is an analytical script? This is some black box (java class), which accepts all user data as input, and returns a set of segments, which it considers appropriate. We give the script everything we see - IP, visits, UserAgent, etc., and at the exit, the scripts issue: “this is a woman, loves cats, does not like dogs”.
These data were given to partners, statistics were considered. It was important for us to understand how many women in general, how many men, how many people love cats, how many have or do not have a car, and so on.
We stored statistics in MongoDB and wrote by incrementing a specific segment counter for each day. We had a schedule of the volume of each segment for each day.
This system was good for its time. It allowed to scale horizontally, grow, allowed to estimate the volume of the audience, but there were a number of drawbacks in it.
It was not always possible to understand what is happening in the system, see the logs. While we were at the previous hoster, the task quite often fell for various reasons. There was a Hadoop-cluster of 20+ servers, once a day one of the servers flew steadily. This led to the fact that the task could partially fall and did not calculate the data. It was necessary to have time to restart it, and, given that she worked for several hours, there were a number of certain nuances.
The most basic thing that the existing architecture did not comply with was the too long reaction time to the event. There is even a story on this topic. There was a company that gave out microloans to the population in the regions, we started a partnership with them. Their client comes to the site, fills out an application for microcredit, the company needs to answer in 15 minutes: are they ready to issue a loan or not. If you are ready - immediately transferred money to the card.
Everything worked kinda good. The client decided to check how it all happens: they took a separate laptop, installed a clean system, visited many pages on the Internet and went to their website. They see that there is a request, and we say in response that there is no data yet. The client asks: “Why is there no data?”
We explain: there is a certain lag before the user performs an action. Data is sent to HBase, processed, and only then the client receives the result. It would seem that if the user did not see the advertisement - everything is in order, nothing terrible will happen. But in this situation, the user could not be given a loan because of the lag.
This is not an isolated case, and it was necessary to switch to a realtime system. What do we want from her?
We want to write data to HBase immediately, as we see it. We saw the visit, enriched everything we know, and sent it to Storage. As soon as the data in Storage has changed - you need to immediately run the entire set of analytical scripts that we have. We want the convenience of monitoring and development, the ability to write new scripts, debug them into parts of the real traffic. We want to understand what the system is doing right now.
The first thing we started with was to solve the second task: to segment the user immediately after changing the data about him in HBase. Initially, our workers-nodes (they were running map-reduce tasks) were located in the same place as HBase. In some cases it was very good - the calculations are performed next to the data, the tasks run fast enough, little traffic goes through the network. It is clear that the task consumes some resources, because it executes complex analytical scripts.
When we go to work in real time, the nature of the load on HBase changes. We proceed to random reads instead of consecutive readings. It is important that the load on HBase is expected - we cannot allow someone to run the task on the Hadoop cluster and spoil the performance of HBase.
The first thing we did was bring HBase to separate servers. Also tweaked BlockCache and BloomFilter. Then did a good job on how to store data in HBase. Pretty much reworked the system, which was told at the beginning, and shook the data itself.

From the obvious: we stored IP as a string, and became a long number. Some data classified, rendered vocabulary things, and so on. The bottom line is that because of this, we were able to shake HBase about twice - from 10 TB to 5 TB. HBase has a mechanism similar to triggers in a regular database. This is the coprocessor mechanism. We wrote such a coprocessor, which, when a user changes to HBase, sends this user ID to Kafka.
User ID falls into Kafka. Further there is a certain service "segmenter". It reads the stream of user identifiers and runs all the same scripts that were before, requesting data from HBase. The process started on 10% of the traffic, looked at how it works. Everything was pretty good.

Then we began to increase the load and saw a number of problems. The first thing we saw was that the service works, segments, and then falls off Kafka, connects and starts working again. Several services - they help each other. Then the next one falls off, one more and so on in a circle. In this case, the user queue for segmentation is almost not cleared.
This was due to the peculiarity of the heartbeat mechanism in Kafka, then it was also version 0.8. Heartbeat is when consumer accountants report to the broker whether they are alive or not, in our case, the segmenter reports. The following happened: we received a fairly large packet of data, sent it for processing. For a while it worked while it worked - the heartbeat was not sent. Brokers believed that the consumer died, and turned it off.
Consumer was working to the end, wasting precious CPUs, trying to say that the data bundle was worked out and you could take the next one, but they refused him, because the other one took what he was working with. We fixed it by making our background heatbeat, then the truth came out a newer version of Kafka where this problem was fixed.
Then the question arose: on which hardware to install our segmenters. Segmentation is a resource-intensive process (CPU bound). It is important that the service not only consumes a lot of CPU, but also loads the network. Now traffic reaches 5 Gbit / sec. There was a question: where to put the services on a lot of small servers or a little large.
At that moment we already moved to servers.com on bare metal. We talked with the guys from the servers, they helped us, gave us the opportunity to test the work of our solution on a small number of expensive servers, and on many inexpensive ones with powerful CPUs. We chose the appropriate option, considering the specific cost of processing one event per second. By the way, the choice fell on quite powerful and at the same time extremely pleasant at the price of Dell R230, launched - everything worked.
It is important that after the segmenter has placed the user into segments, the result of his analysis falls back into Kafka, into a certain topic Segmentation Result.
Then we can independently connect to this data by different consumers who will not interfere with each other. This allows us to give data independently to each partner, be it some kind of external partners, internal DSP, Google, statistics.
The statistics are also an interesting point: earlier we could increase the value of the counters in MongoDB, how many users were in a certain segment for a certain day. Now, this cannot be done because we are now analyzing each user after he has committed an event, i.e. several times a day.
Therefore, we had to solve the problem of counting the unique number of users in the stream. To do this, we used the HyperLogLog data structure and its implementation in Redis. The data structure is probabilistic. This means that you can add user IDs there, identifiers themselves will not be stored, so you can store millions of unique identifiers extremely compact in HyperLogLog, and this will take up to 12 kilobytes of one key.
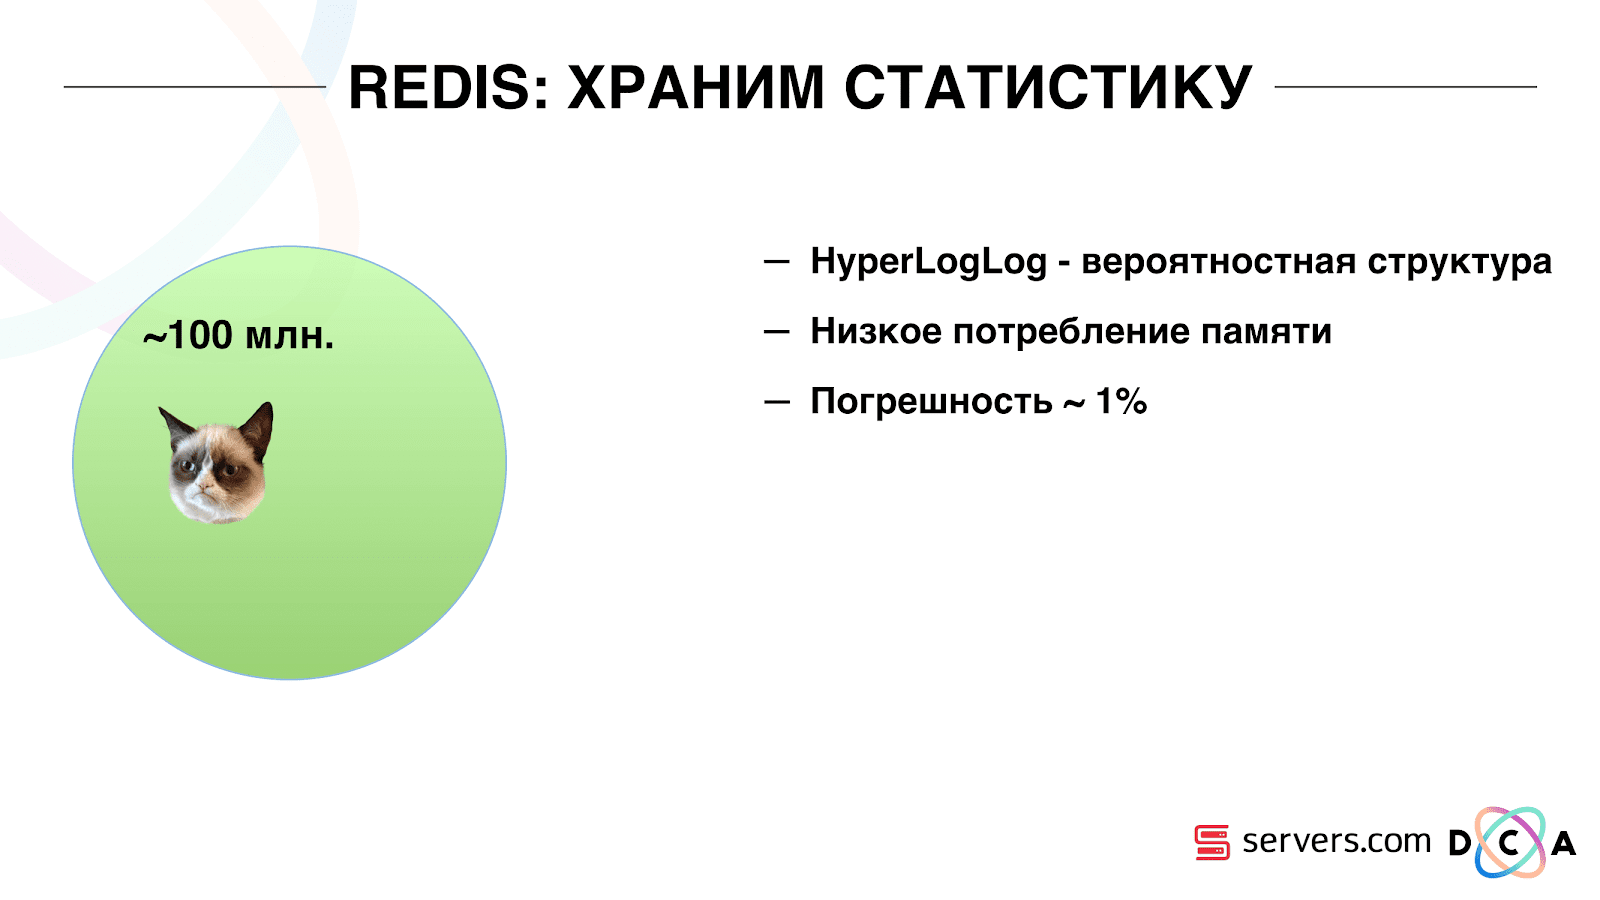
You cannot get the IDs themselves, but you can find out the size of this set. Since the data structure is probabilistic, there is some error. For example, if you have a “loves cats” segment, making a request for the size of this segment for a certain day, you will receive 99.2 million and this will mean something like “from 99 million to 100 million”.
Also in HyperLogLog you can get the size of the union of several sets. Suppose you have two segments "loves cats" and "loves dogs." Suppose the first 100 million, the second 1 million. You can ask: “how many animals in general love?” And get the answer “about 101 million” with an error of 1%. It would be interesting to count how many cats and dogs love at the same time, but this is quite difficult to do.

On the one hand, you can find out the size of each set, find out the size of the union, add, subtract one from the other, and get the intersection. But due to the fact that the size of the error may be greater than the size of the final intersection, the final result may be "from -50 to 50 thousand."

We have worked quite a lot on how to increase performance when writing data to Redis. Initially, we reached 200 thousand operations per second. But when each user has more than 50 segments - recording information about each user - 50 operations. It turns out that we are quite limited in bandwidth and in this example we cannot write information about more than 4 thousand users per second, which is several times less than what we need.
We made a separate “stored procedure” in Redis via Lua, loaded it there and began to send a string with the entire list of segments of one user to it. The procedure inside cuts the transferred string into the necessary updates of HyperLogLogs and saves the data, so we reached approximately 1 million updates per second.
A bit hardcore: Redis is single-threaded, you can pin it to one processor core, and the network card to another and achieve another 15% performance, saving on context switches. In addition, the important point is that you cannot simply cluster the data structure, because the operations of obtaining the power of the union of sets are not clustered.
You can see that Kafka is our main transport tool in the system.
It has the essence of "topic". This is where you write the data, and in fact - the queue. In our case there are several queues. One of them is the identifiers of the users that need to be segmented. The second is the segmentation results.
A topic is a set of partitions. It is divided into some pieces. Each partition is a file on the hard disk. When your producers write the data - they write pieces of text at the end of the partition. When your accountants read the data, they simply read from these partitions.
It is important that you can connect independently several groups of consumer groups, they will consume data without interfering with each other. This is determined by the name of the consumer group and is achieved as follows.
There is such a thing as offset, the position where the consumer group is now on each partition. For example, group A consumes the seventh message from partition1, and the fifth from partition2. Group B, independent of A, has other offset.
You can scale your consumer group horizontally, add another process or server. There will be a partition reassignment (Kafka broker will assign each consumer a partition list for consumption) This means that the first consumer group will start consuming only partition 1, and the second only partition 2. If one of the consumers dies (for example, hearthbeat does not come), a new reassignment occurs , each user receives the current partition list for processing.

It is quite convenient. First, you can manipulate the offset for each consumer group. Imagine that there is a partner to whom you are transmitting data from this topic with the results of segmentation. He writes that by chance, as a result, the bug lost the last day of data. And you for the consumer group of this client simply roll back a day ago and pour over the entire data day for him. We can also have our own consumer group, connect to production traffic, watch what is happening, debug on real data.
So, we have achieved that we began to segment users as we change, we can independently connect new consumers, we write statistics and we can watch it. Now we need to achieve data recording in HBase immediately after they came to us.
How we did it. There used to be batch data loading. There was a Batch Loader, it processed logs of user activity: if a user made 10 visits, batch came for 10 events, it was recorded in HBase in one operation. There was only one event per segmentation. Now we want to write each separate event in the repository. We will greatly increase the flow to write and read flow. The number of events per segmentation will also increase.
The first thing we did was transfer HBase to SSD. This is not really done with standard tools. This was done by means of HDFS. You can say that a specific directory on HDFS should be on such a disk group. There was a cool problem with the fact that when we took HBase on the SSD and stupidly, all the snapshots got there, and our SSDs ended pretty quickly.
This is also solved, we periodically export snapshot-s to a file, write to another HDFS directory and delete all the meta-information about snapshot-e. If you need to restore - take the saved file, import and restore. This operation is very infrequent, fortunately.
Also, on the SSD, they took out Write Ahead Log, twisted MemStore, turned on the cache block on write option. It allows you to immediately put them in the block cache when writing data. This is very convenient because in our case, if we recorded the data, then they are very likely to be read immediately. This also gave some advantages.
Next, we switched all our data sources to Kafka data entry. Already from Kafka, we recorded data in HDFS to maintain backward compatibility, including so that our analysts could work with the data, run MapReduce tasks and analyze their results.
We have connected a separate consumer group that writes data to HBase. This is, in fact, a wrapper that reads from Kafka and forms PUTs in HBase.
We launched in parallel two schemes in order not to break backward compatibility and not degrade system performance. A new scheme was launched only on a certain percentage of traffic. At 10% everything was pretty cool. But at a greater load, the segmenters could not cope with the flow to segmentation.

We collect the metric "how many messages lay in Kafka before it was read from there." This is a good metric. Initially, we collected the metric “how many messages there are now raw,” but it doesn’t say anything about it. You are watching: “I have a million raw messages,” so what? To interpret this million, you need to know how fast the segmenter (consumer) works, which is not always obvious.
With this metric, you immediately see that the data is written to the queue, taken from it and see how much they are waiting for their processing. We saw that we did not have time to segment, and the message was in the queue for several hours before it was read.
You could just add capacity, but that would be tooexpensive . Therefore, we tried to optimize.
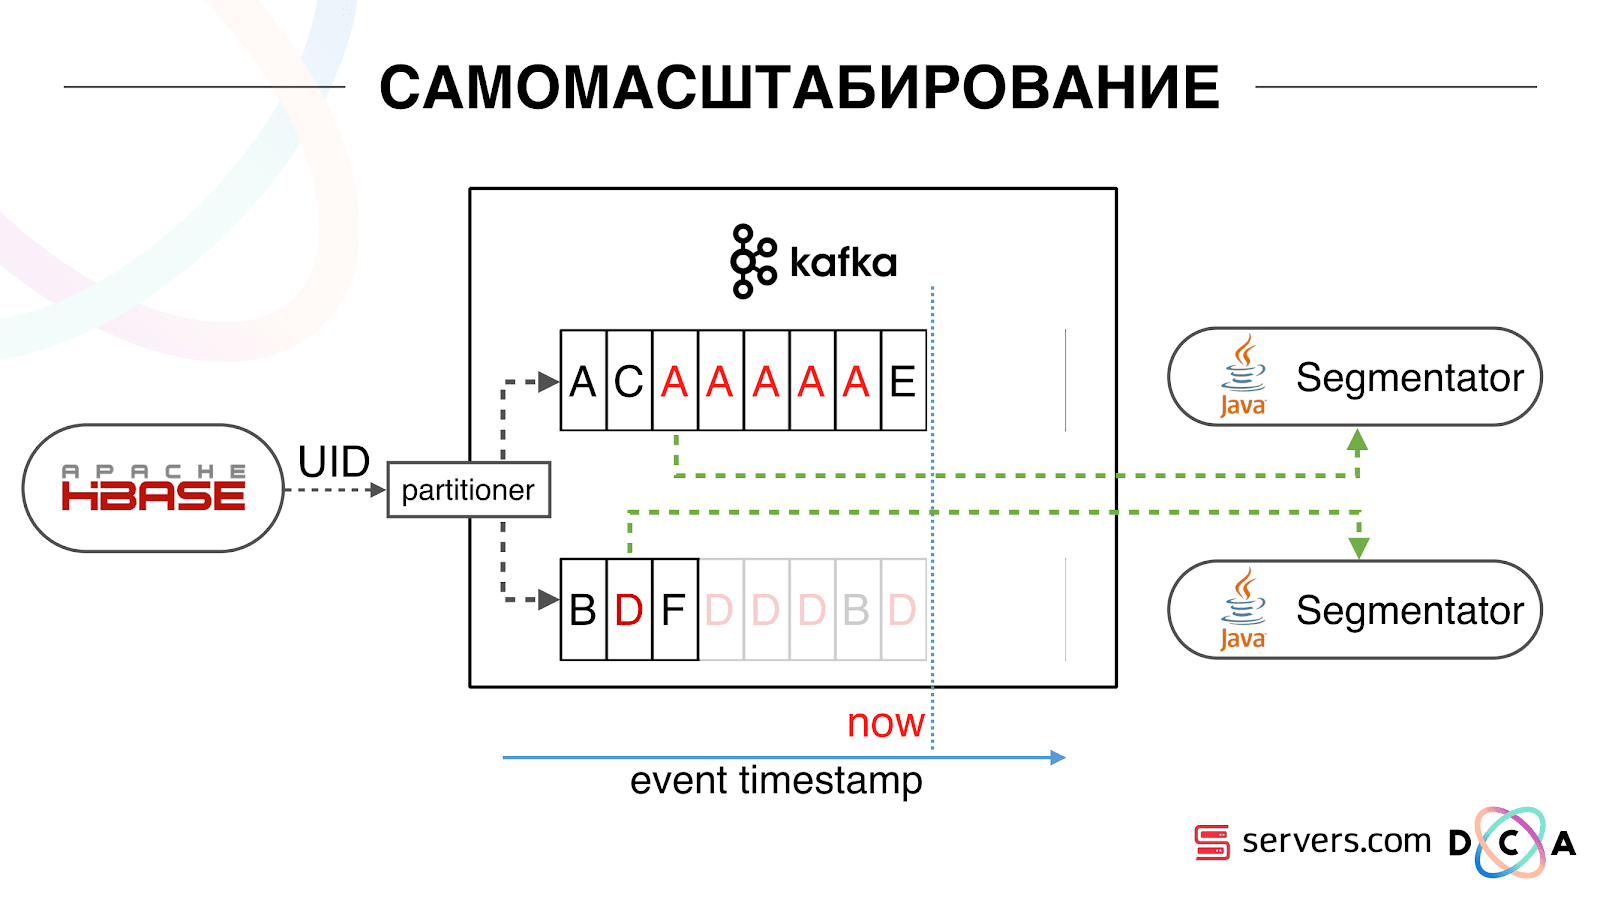
We have HBase. The user is changing, his ID is flying to Kafka. The topic is divided into partitions, the target partition is selected by user ID. This means that when you see the user “Vasya” - he is sent to partition 1. When you see “Petya” - to partition 2. This is convenient - you can achieve that you will see one consumer on one instance of your service, and the second - on another.
We began to watch what was happening. One typical user behavior on the Internet is to go to a website and open several background tabs. Second - go to the site and make a few clicks to get to the landing page.
We look in the queue at the segmentation and see the following: User A visited the page. 5 more events from this user come - each means opening the page. We handle every event from the user. But in fact, the data in HBase contain all 5 visits. We process all 5 visits for the first time, the second time and so on - we waste CPU resources.
Therefore, we began to store a local cache on each of the segmenters with the date when we last analyzed this user. That is, we processed it, recorded its userid and timestamp in the cache. Each kafka message also has a timestamp - we simply compare it: if the timestamp in the queue is less than the last segmentation date, we have already analyzed the user using this data, and you can simply skip this event.
User events (Red A) may be different, and they go out of order. The user can open several background tabs, open several links in a row, maybe there are several of our partners on the site, each of which sends this data.
Our pixel can see the user's visit, and then some other action - we helmet it ourselves. Five events arrive, we process the first red A. If the event has arrived, then it is already in HBase. We see events, run through a set of scripts. We see the following events, and there all the same events, because they are already recorded. We run again and save the cache with the date, compare it with the timestamp event.

Due to this, the system gained the property of self-scalability. On the Y axis, the percentage of what we do with user IDs when they come to us. Green - the work we have done, run the segmentation script. Yellow - we did not do this, because already segmented exactly this data.
It can be seen that at night there are resources, there is less data flow, and every second event can be segmented. In the daytime, resources are smaller, and we segment only 20% of the events. The jump at the end of the day - the partner added data files that we had not seen before, and they had to be “honestly” segmented.
The system itself adapts to the increase in load. If we have a very large partner - we process the same data but a little less. In this case, the system performance will deteriorate a little in the evening, the segmentation will be delayed not by 2-3 seconds, but by a minute. In the morning we will add servers and we will return to the necessary results.
So we saved about 5 times on the servers. Now we are working on 10 servers, and it would take 50-60.
Blue stuff on top - bots. This is the hardest part of segmentation. They have a huge number of visits, they create a very large load on iron. Each bot we see on a separate server. We can collect local cache with a black list of bots on it. Introduced a simple antifraud: if the user makes too many visits for a certain time, then something is wrong with him, add to the blacklist for a while. This is a blue strip, about 5%. They gave us another 30% savings on the CPU.
Thus, we have achieved that we see the entire data processing pipeline at each stage. We see the metrics for how long the message has lain in Kafka. In the evening, somewhere something blunted, the processing time increased to a minute, then released and returned to normal.

We can monitor how our actions with the system affect its throughput, we can see how much the script is running, where it is necessary to optimize, what can be saved on. We can see the size of the segments, the dynamics of the size of the segments, evaluate their union and intersection. This can be done for more or less the same size of the segments.
We have a Hadoop cluster with some computational resources. He is busy - analysts work on it during the day, but at night he is practically free. In general, we can containerize the segmenter and run it as a separate process within our cluster. We want to store statistics more accurately in order to more accurately calculate the volume of the intersection. Still need optimization on the CPU. This directly affects the cost of the solution.
Summing up: Kafka is good, but, like with any other technology, you need to understand how it works inside and what happens to it. For example, a message priority guarantee works only inside a partition. If you send a message that goes into different partitions, then it is unclear in what sequence they will be processed.
Real data is very important. If we were not tested on real traffic, then, most likely, we would not see problems with bots, with user sessions. Would develop something in a vacuum, run and lay down. It is important to monitor what you consider necessary to monitor, and not to monitor what you do not.
The material is based on the transcript of the report by Artem Marinov , a big data specialist at Directual, from the 2017 SmartData conference.
My name is Artem Marinov, I want to tell you about how we reworked the architecture of the FACETz DMP project when I worked at the Data Centric Alliance company. Why we did it, what it led to, what path we took and what problems we faced.
DMP (Data Management Platform) - a platform for collecting, processing and aggregation of user data. Data is a lot of different things. The platform has about 600 million users. These are millions of cookies that go on the Internet and make various events. In general, an average day looks like this: we see about 5.5 billion events per day, they are somehow spread over the day, and at peak they reach about 100 thousand events per second.
Events are various user signals. For example, a visit to the site: we see from which browser the user goes, his useragent and everything we can extract. Sometimes we see how and by what search queries he came to the site. It can also be various data from the offline world, for example, that it pays with discount coupons and so on. We need to save this data and mark the user in the so-called groups of auditorium segments. For example, segments can be a "woman" who "loves cats" and is looking for a "car service", she "has a car older than three years."
Why segment a user? There are many applications for this, for example, advertising. Different ad networks can optimize ad serving algorithms. If you advertise your car service, you can set up a campaign to show information only to people who have an old car, excluding the owners of the new ones. You can dynamically change the content of the site, you can use the data for scoring - many applications.
The data comes from a variety of completely different places. These can be direct pixel installations - this is if the client wants to analyze his audience, he puts a pixel on the site, an invisible picture that is loaded from our server. The point is that we see the user’s visit to this site: you can save it, start analyzing and understand the user's portrait, all this information is available to our client.
Data can be obtained from various partners who see a lot of data and want to monetize them in various ways. Partners can deliver data in real time as well as make periodic uploads as files.
Key requirements:
- Horizontal scalability;
- Estimate audience size;
- Convenience monitoring and development;
- Good reaction speed to events.
One of the key requirements of the system is horizontal scalability. There is such a moment that when you develop a portal or an online store, you can estimate the number of your users (how it will grow, how it will change) and roughly understand how many resources are needed, and how the store will live and develop over time.
When you develop a platform like DMP, you need to be prepared for the fact that any large site — a conditional Amazon — can put your pixel in it, and you will have to work with the traffic of this entire site, and you don’t have to fall, and Systems should not change from this.
It is also quite important to be able to understand the volume of a certain audience, so that a potential advertiser or someone else can work out a media plan. For example, a man comes to you and asks you to find out how many pregnant women from Novosibirsk are looking for a mortgage, in order to assess whether it makes sense to target them or not.
From the point of view of development, you need to be able to coolly monitor everything that is happening in your system, debug some part of the real traffic, and so on.
One of the most important requirements for the system is a good reaction rate to events. The faster systems respond to events, the better, obviously. If you are looking for theater tickets, then if you see some kind of discount event a day later, two days or even an hour - this may be irrelevant, since you could already buy tickets or go to a show. When you are looking for a drill - you are looking for it, find, buy, hang a shelf, and after a couple of days the bombing begins: “Buy a drill!”.
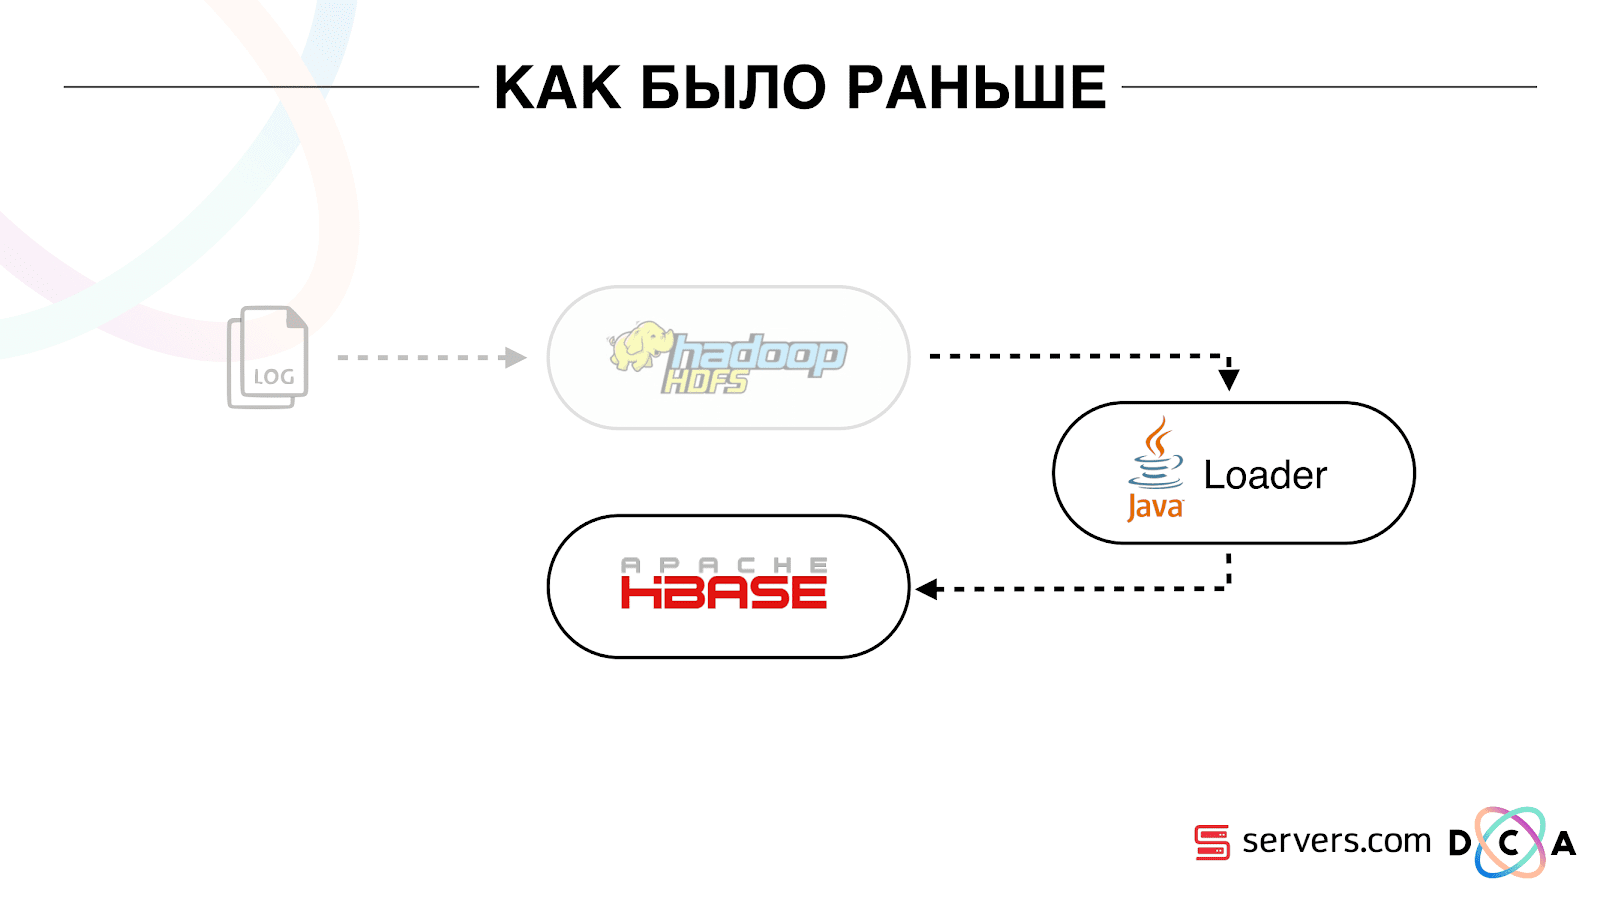
As it was before
Article in general about the processing of architecture. I would like to tell you what was our starting point, how everything worked before the changes.
All the data that we had, be it a direct data stream or logs, was added to HDFS - distributed file storage. Then there was a process that periodically started, took all the raw files from HDFS and converted them to requests for data enrichment in HBase (“PUT requests”).
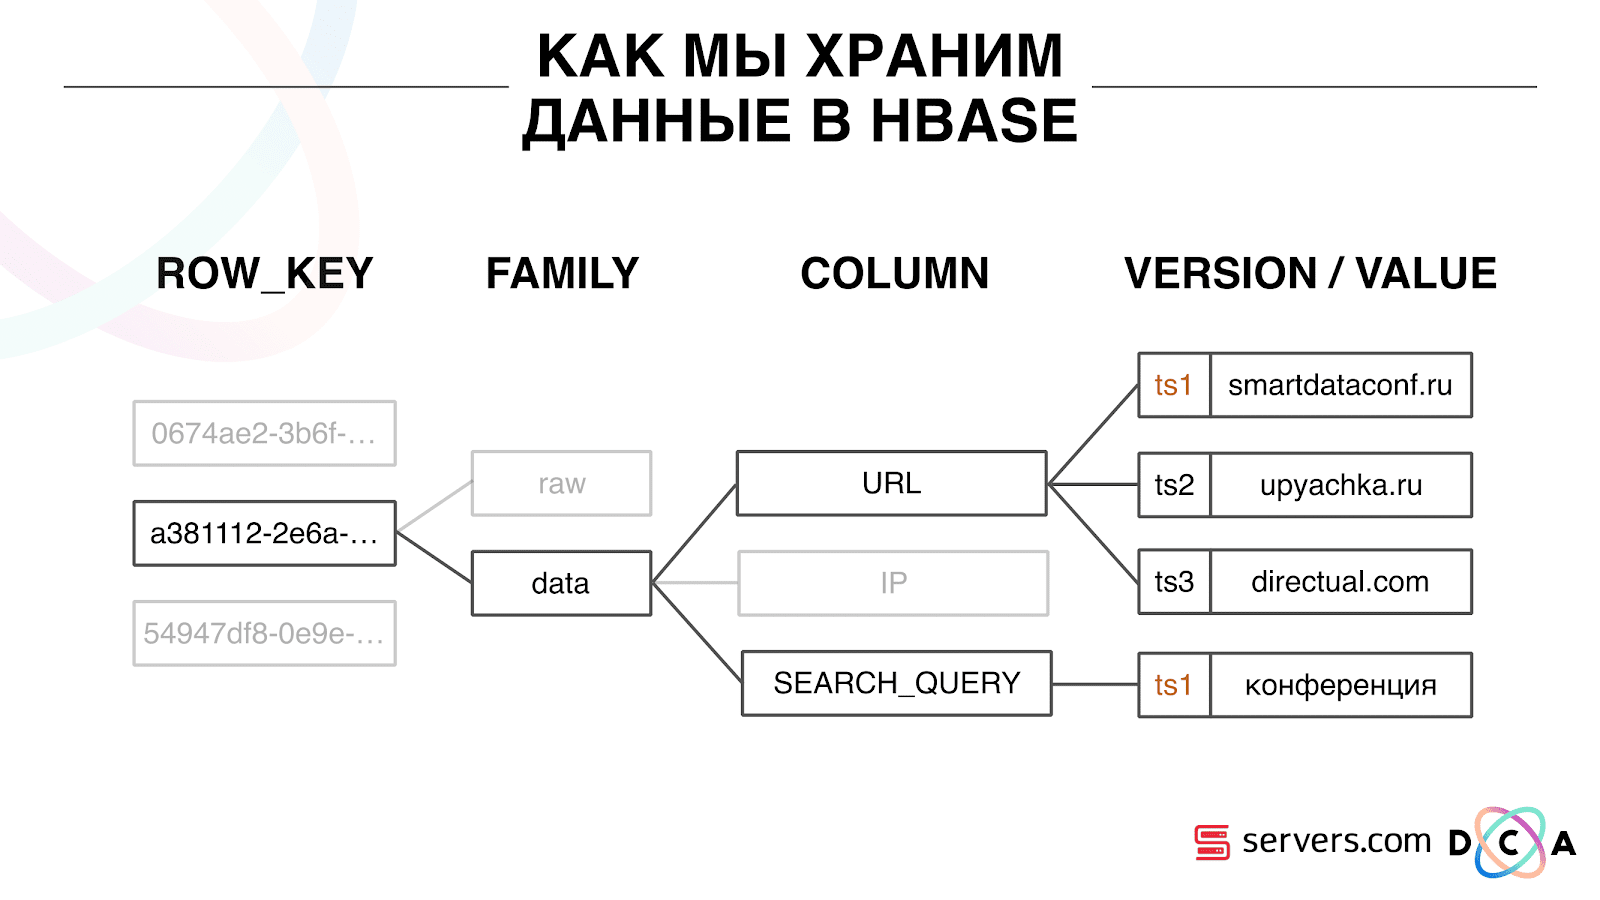
How we store data in HBase
This is a column time series database. She has the concept of Row Key - this is the key under which you store your data. We use the user ID, the user id, which we generate when we see the user for the first time as a key. Inside each key, the data is divided into Column Family - entities, at the level of which you can manage the meta-information of your data. For example, you can store a thousand record versions for Column Family "data" and store them for two months, and for Column Family "raw", a year, as an option.
Within the Column Family there is a lot of Column Qualifier (the column). We use different user attributes for column. This may be the URL that he went to, the IP address, the search query. And the most important thing is that inside each column is stored a lot of information. Inside the column URL it can be indicated that the user went to smartdataconf.ru, then to some other sites. And the timestamp is used as a version - you see the ordered history of user visits. In our case, we can determine that the user came to the site smartdataconf by the keyword "conference", because they have the same timestamp.
Work with HBase
There are several options for working with HBase. These can be PUT requests (data change request), GET request (“give me all the data on Vasya’s user,” and so on). You can run SCAN queries - multi-threaded sequential scanning of all data in HBase. This is what we used earlier for marking in the classroom segments.
There was a task called Analytics Engine, it was run once a day and scanned HBase in several threads. For each user, she picked up the whole story from HBase and drove through a set of analytical scripts.
What is an analytical script? This is some black box (java class), which accepts all user data as input, and returns a set of segments, which it considers appropriate. We give the script everything we see - IP, visits, UserAgent, etc., and at the exit, the scripts issue: “this is a woman, loves cats, does not like dogs”.
These data were given to partners, statistics were considered. It was important for us to understand how many women in general, how many men, how many people love cats, how many have or do not have a car, and so on.
We stored statistics in MongoDB and wrote by incrementing a specific segment counter for each day. We had a schedule of the volume of each segment for each day.
This system was good for its time. It allowed to scale horizontally, grow, allowed to estimate the volume of the audience, but there were a number of drawbacks in it.
It was not always possible to understand what is happening in the system, see the logs. While we were at the previous hoster, the task quite often fell for various reasons. There was a Hadoop-cluster of 20+ servers, once a day one of the servers flew steadily. This led to the fact that the task could partially fall and did not calculate the data. It was necessary to have time to restart it, and, given that she worked for several hours, there were a number of certain nuances.
The most basic thing that the existing architecture did not comply with was the too long reaction time to the event. There is even a story on this topic. There was a company that gave out microloans to the population in the regions, we started a partnership with them. Their client comes to the site, fills out an application for microcredit, the company needs to answer in 15 minutes: are they ready to issue a loan or not. If you are ready - immediately transferred money to the card.
Everything worked kinda good. The client decided to check how it all happens: they took a separate laptop, installed a clean system, visited many pages on the Internet and went to their website. They see that there is a request, and we say in response that there is no data yet. The client asks: “Why is there no data?”
We explain: there is a certain lag before the user performs an action. Data is sent to HBase, processed, and only then the client receives the result. It would seem that if the user did not see the advertisement - everything is in order, nothing terrible will happen. But in this situation, the user could not be given a loan because of the lag.
This is not an isolated case, and it was necessary to switch to a realtime system. What do we want from her?
We want to write data to HBase immediately, as we see it. We saw the visit, enriched everything we know, and sent it to Storage. As soon as the data in Storage has changed - you need to immediately run the entire set of analytical scripts that we have. We want the convenience of monitoring and development, the ability to write new scripts, debug them into parts of the real traffic. We want to understand what the system is doing right now.
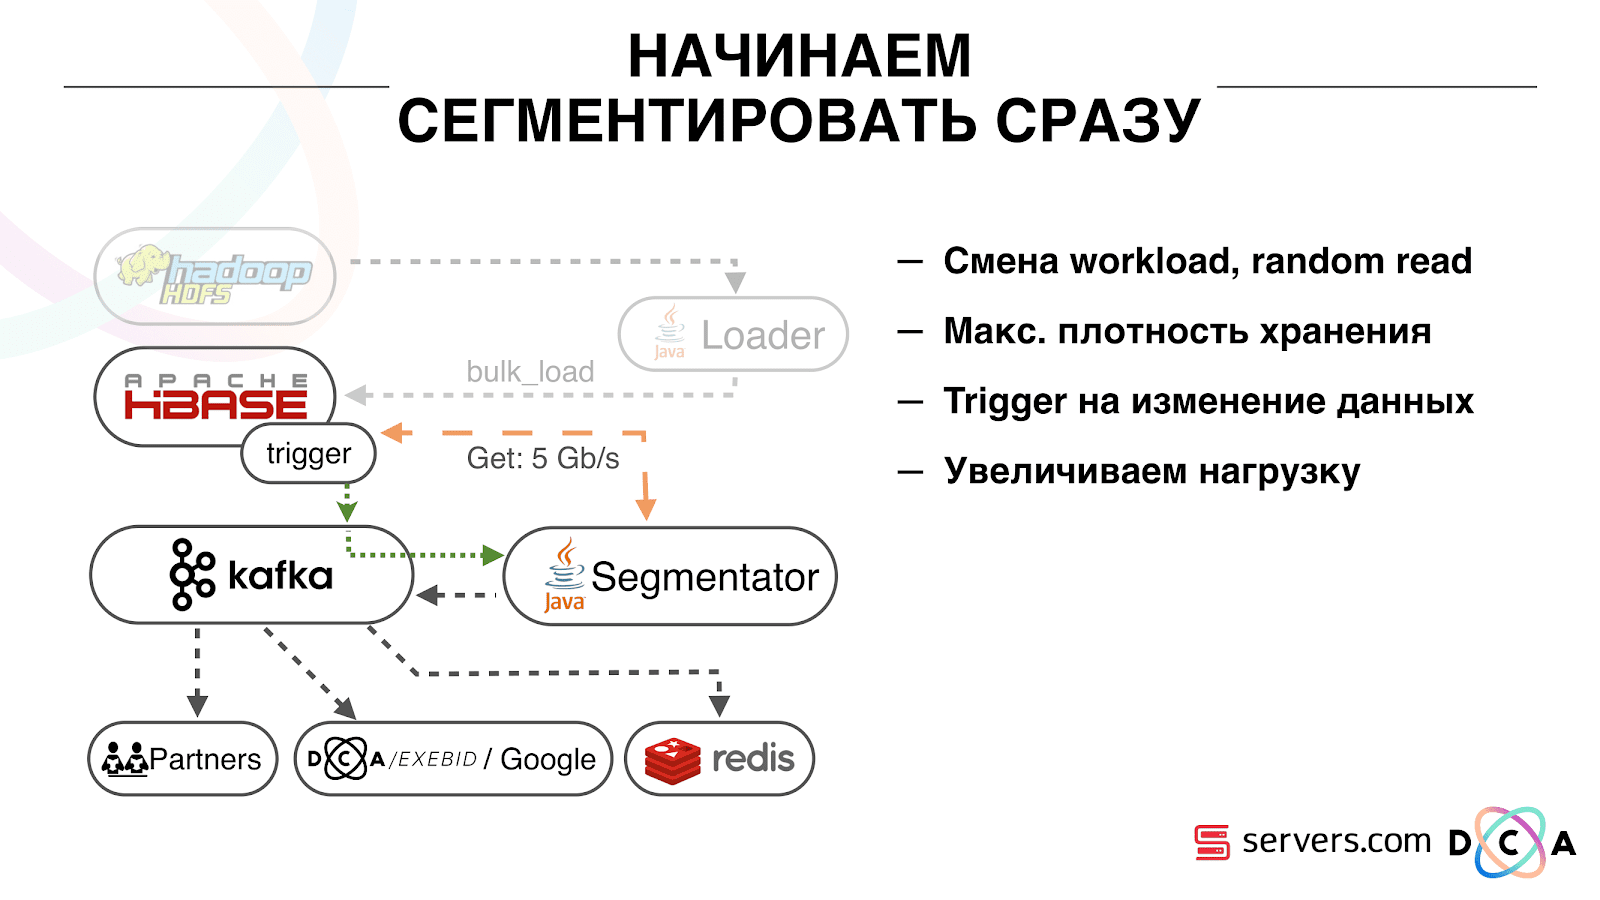
The first thing we started with was to solve the second task: to segment the user immediately after changing the data about him in HBase. Initially, our workers-nodes (they were running map-reduce tasks) were located in the same place as HBase. In some cases it was very good - the calculations are performed next to the data, the tasks run fast enough, little traffic goes through the network. It is clear that the task consumes some resources, because it executes complex analytical scripts.
When we go to work in real time, the nature of the load on HBase changes. We proceed to random reads instead of consecutive readings. It is important that the load on HBase is expected - we cannot allow someone to run the task on the Hadoop cluster and spoil the performance of HBase.
The first thing we did was bring HBase to separate servers. Also tweaked BlockCache and BloomFilter. Then did a good job on how to store data in HBase. Pretty much reworked the system, which was told at the beginning, and shook the data itself.
From the obvious: we stored IP as a string, and became a long number. Some data classified, rendered vocabulary things, and so on. The bottom line is that because of this, we were able to shake HBase about twice - from 10 TB to 5 TB. HBase has a mechanism similar to triggers in a regular database. This is the coprocessor mechanism. We wrote such a coprocessor, which, when a user changes to HBase, sends this user ID to Kafka.
User ID falls into Kafka. Further there is a certain service "segmenter". It reads the stream of user identifiers and runs all the same scripts that were before, requesting data from HBase. The process started on 10% of the traffic, looked at how it works. Everything was pretty good.
Then we began to increase the load and saw a number of problems. The first thing we saw was that the service works, segments, and then falls off Kafka, connects and starts working again. Several services - they help each other. Then the next one falls off, one more and so on in a circle. In this case, the user queue for segmentation is almost not cleared.
This was due to the peculiarity of the heartbeat mechanism in Kafka, then it was also version 0.8. Heartbeat is when consumer accountants report to the broker whether they are alive or not, in our case, the segmenter reports. The following happened: we received a fairly large packet of data, sent it for processing. For a while it worked while it worked - the heartbeat was not sent. Brokers believed that the consumer died, and turned it off.
Consumer was working to the end, wasting precious CPUs, trying to say that the data bundle was worked out and you could take the next one, but they refused him, because the other one took what he was working with. We fixed it by making our background heatbeat, then the truth came out a newer version of Kafka where this problem was fixed.
Then the question arose: on which hardware to install our segmenters. Segmentation is a resource-intensive process (CPU bound). It is important that the service not only consumes a lot of CPU, but also loads the network. Now traffic reaches 5 Gbit / sec. There was a question: where to put the services on a lot of small servers or a little large.
At that moment we already moved to servers.com on bare metal. We talked with the guys from the servers, they helped us, gave us the opportunity to test the work of our solution on a small number of expensive servers, and on many inexpensive ones with powerful CPUs. We chose the appropriate option, considering the specific cost of processing one event per second. By the way, the choice fell on quite powerful and at the same time extremely pleasant at the price of Dell R230, launched - everything worked.
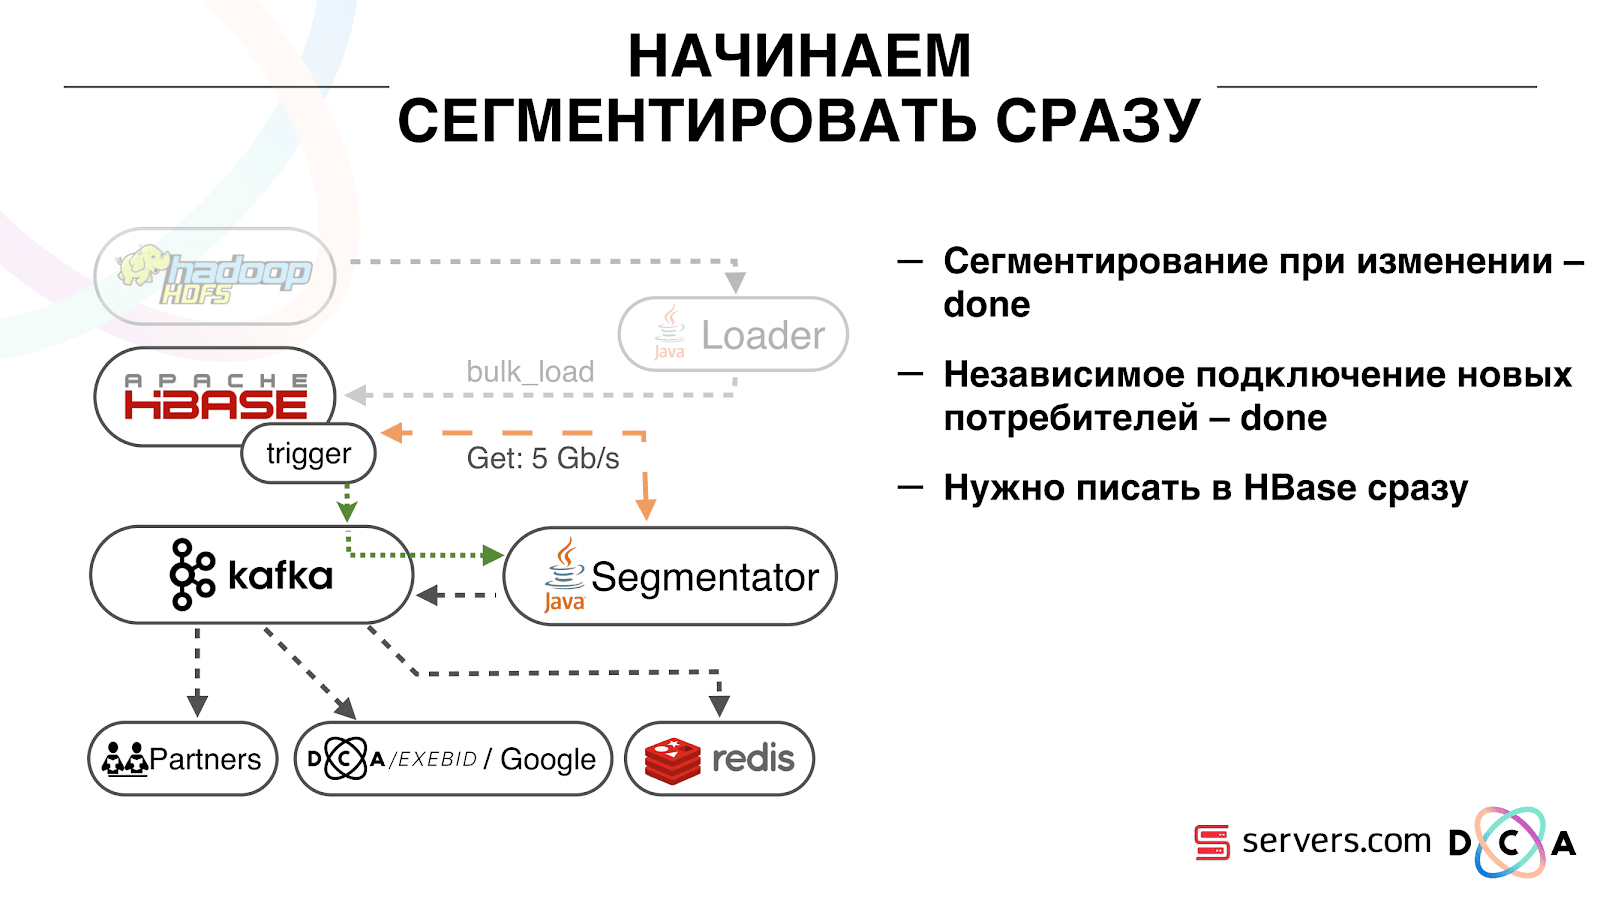
It is important that after the segmenter has placed the user into segments, the result of his analysis falls back into Kafka, into a certain topic Segmentation Result.
Then we can independently connect to this data by different consumers who will not interfere with each other. This allows us to give data independently to each partner, be it some kind of external partners, internal DSP, Google, statistics.
The statistics are also an interesting point: earlier we could increase the value of the counters in MongoDB, how many users were in a certain segment for a certain day. Now, this cannot be done because we are now analyzing each user after he has committed an event, i.e. several times a day.
Therefore, we had to solve the problem of counting the unique number of users in the stream. To do this, we used the HyperLogLog data structure and its implementation in Redis. The data structure is probabilistic. This means that you can add user IDs there, identifiers themselves will not be stored, so you can store millions of unique identifiers extremely compact in HyperLogLog, and this will take up to 12 kilobytes of one key.
You cannot get the IDs themselves, but you can find out the size of this set. Since the data structure is probabilistic, there is some error. For example, if you have a “loves cats” segment, making a request for the size of this segment for a certain day, you will receive 99.2 million and this will mean something like “from 99 million to 100 million”.
Also in HyperLogLog you can get the size of the union of several sets. Suppose you have two segments "loves cats" and "loves dogs." Suppose the first 100 million, the second 1 million. You can ask: “how many animals in general love?” And get the answer “about 101 million” with an error of 1%. It would be interesting to count how many cats and dogs love at the same time, but this is quite difficult to do.
On the one hand, you can find out the size of each set, find out the size of the union, add, subtract one from the other, and get the intersection. But due to the fact that the size of the error may be greater than the size of the final intersection, the final result may be "from -50 to 50 thousand."
We have worked quite a lot on how to increase performance when writing data to Redis. Initially, we reached 200 thousand operations per second. But when each user has more than 50 segments - recording information about each user - 50 operations. It turns out that we are quite limited in bandwidth and in this example we cannot write information about more than 4 thousand users per second, which is several times less than what we need.
We made a separate “stored procedure” in Redis via Lua, loaded it there and began to send a string with the entire list of segments of one user to it. The procedure inside cuts the transferred string into the necessary updates of HyperLogLogs and saves the data, so we reached approximately 1 million updates per second.
A bit hardcore: Redis is single-threaded, you can pin it to one processor core, and the network card to another and achieve another 15% performance, saving on context switches. In addition, the important point is that you cannot simply cluster the data structure, because the operations of obtaining the power of the union of sets are not clustered.
Kafka is a great tool.
You can see that Kafka is our main transport tool in the system.
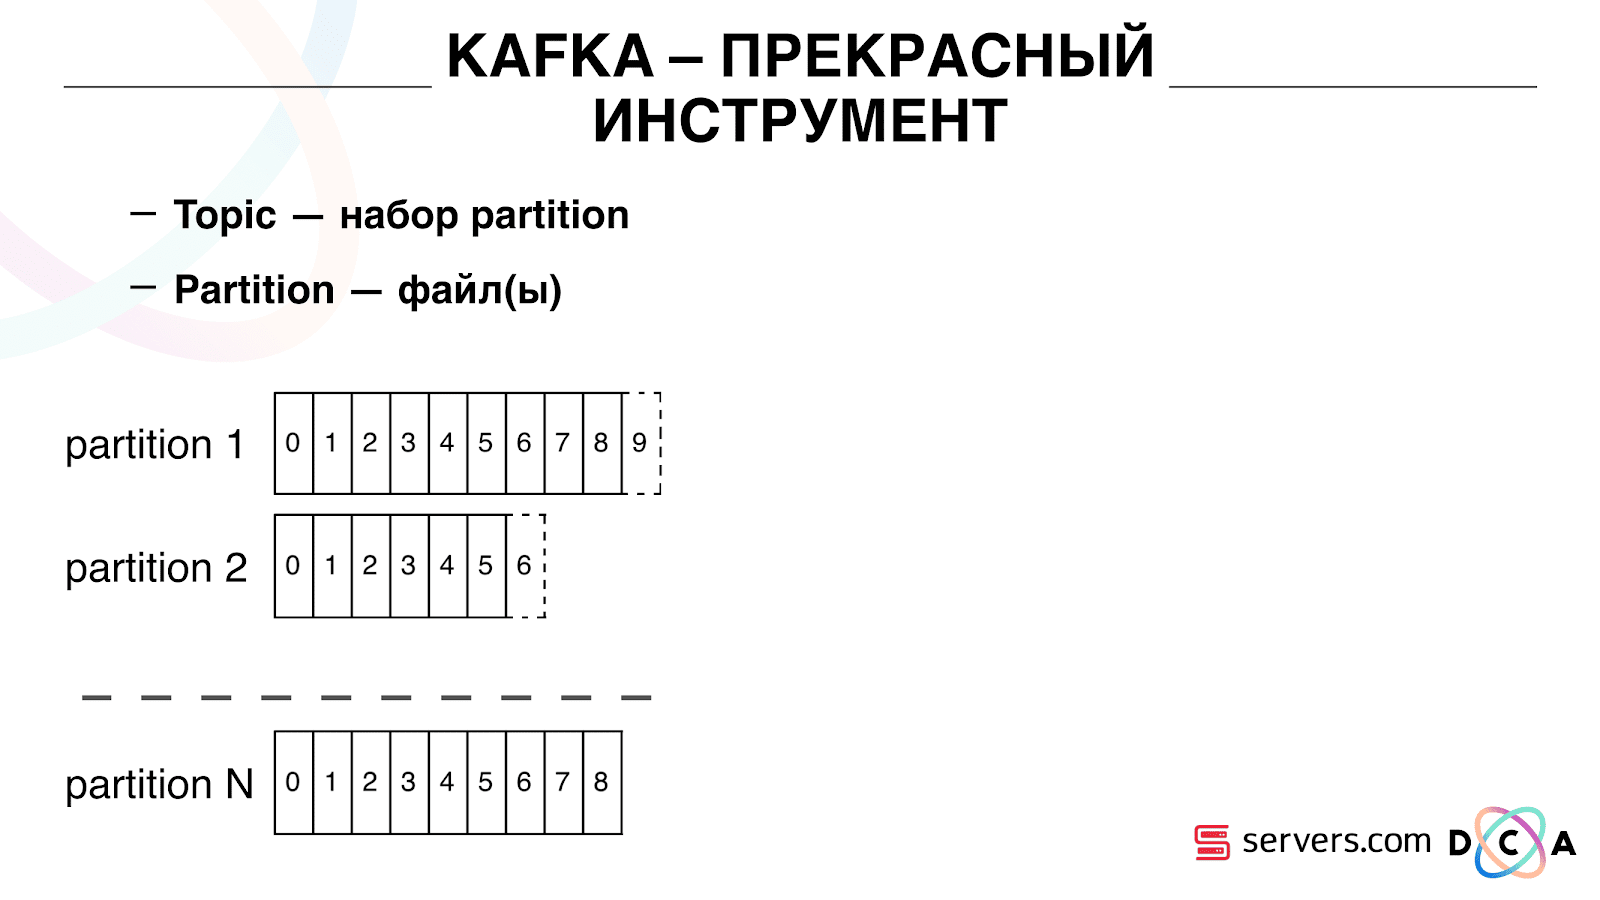
It has the essence of "topic". This is where you write the data, and in fact - the queue. In our case there are several queues. One of them is the identifiers of the users that need to be segmented. The second is the segmentation results.
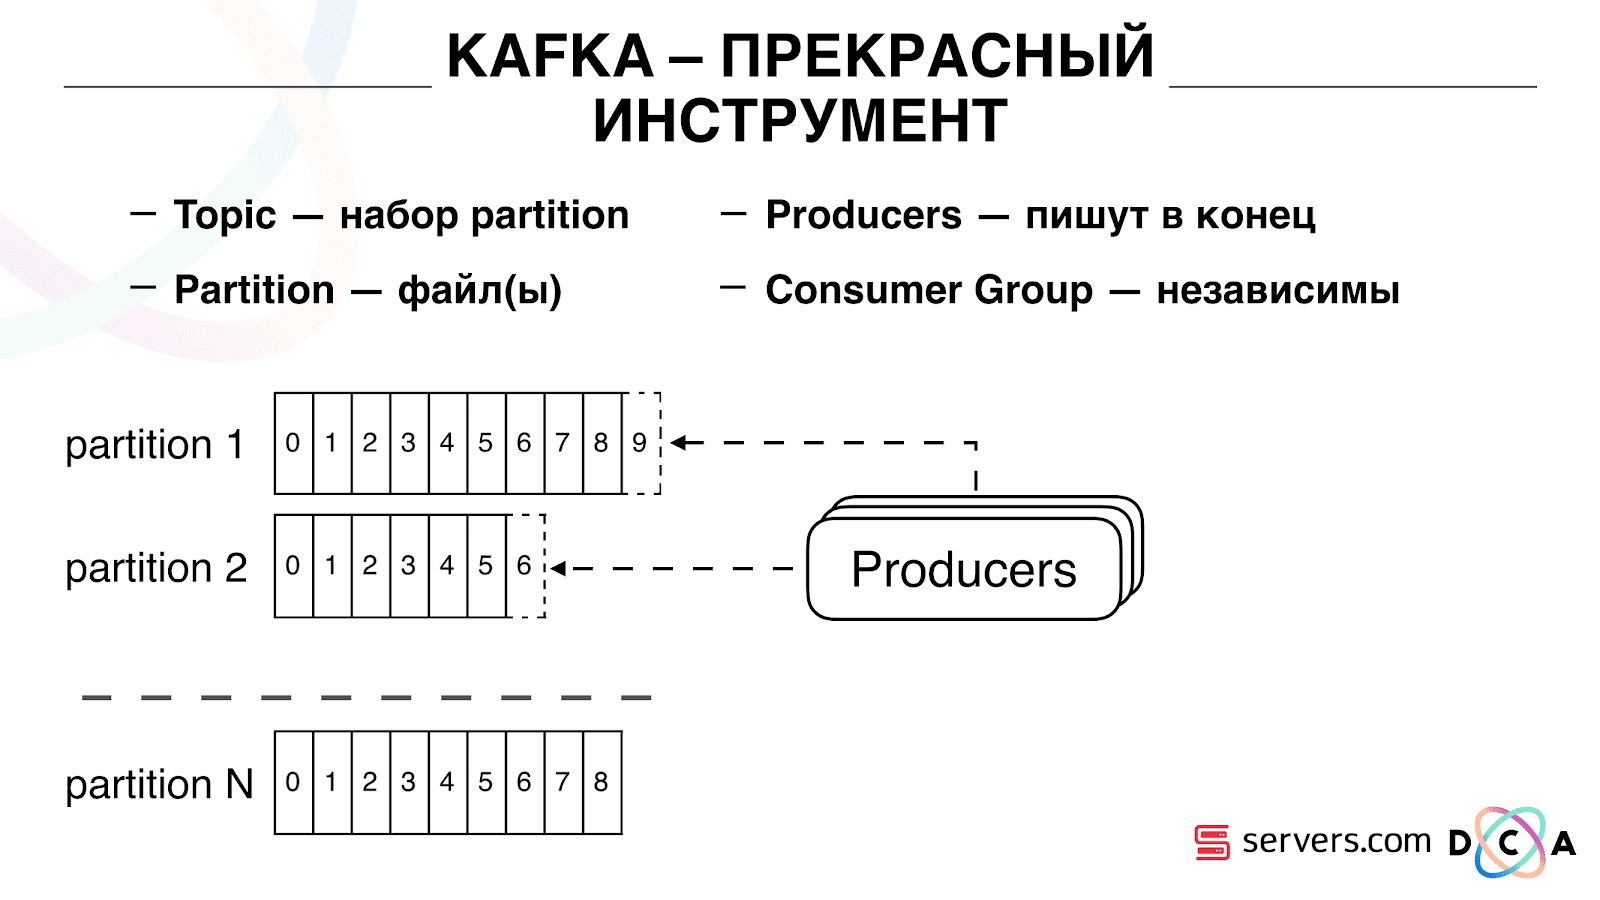
A topic is a set of partitions. It is divided into some pieces. Each partition is a file on the hard disk. When your producers write the data - they write pieces of text at the end of the partition. When your accountants read the data, they simply read from these partitions.
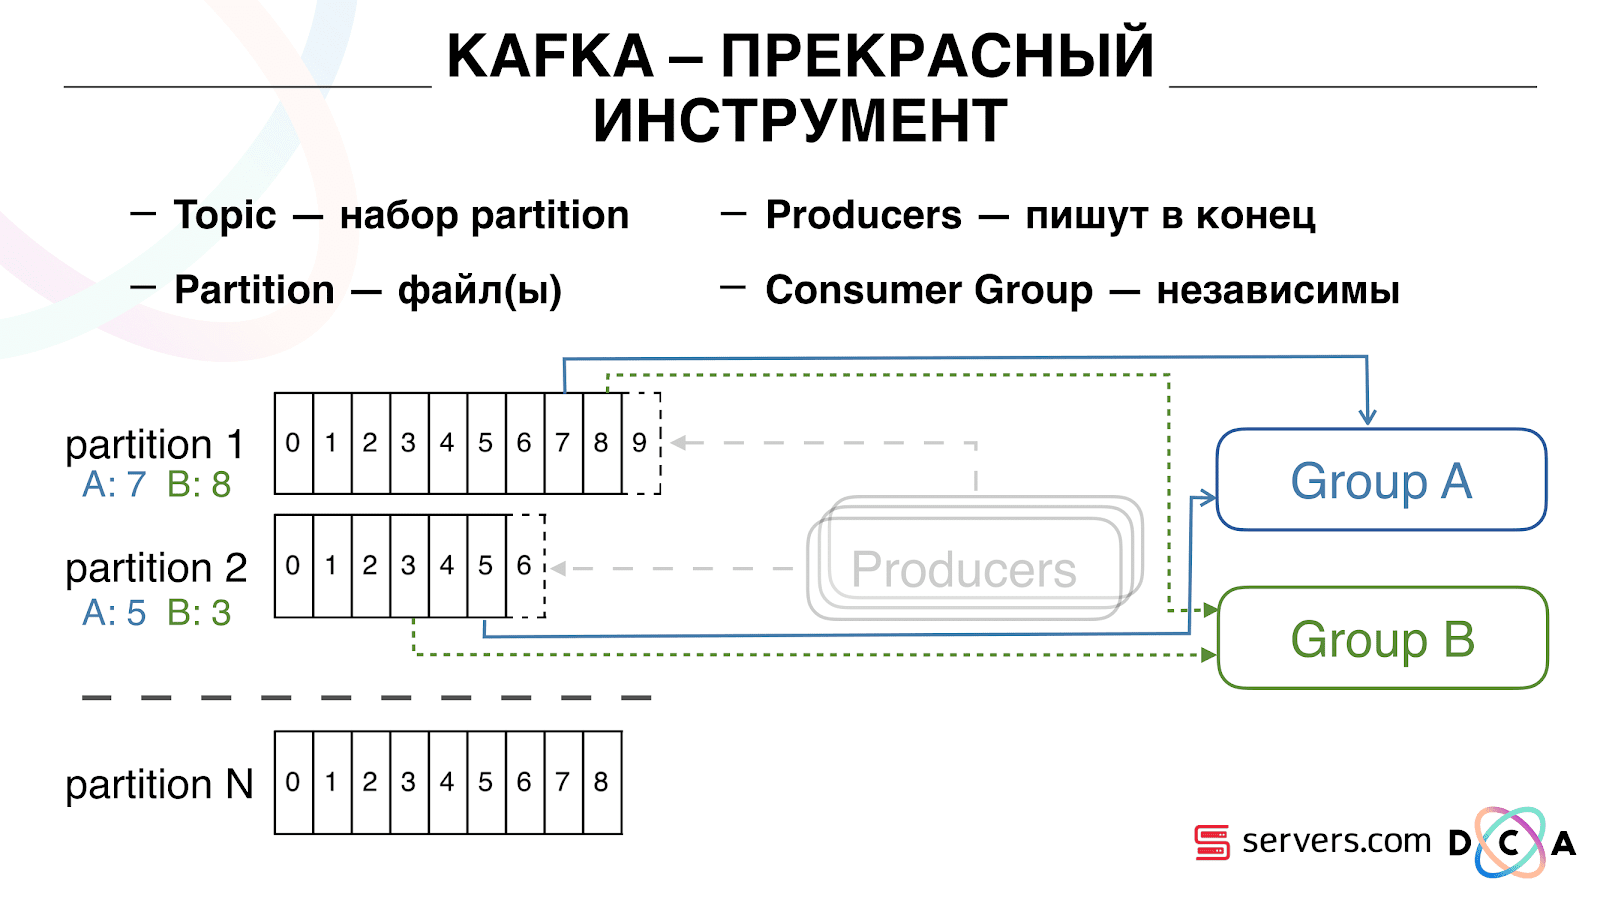
It is important that you can connect independently several groups of consumer groups, they will consume data without interfering with each other. This is determined by the name of the consumer group and is achieved as follows.
There is such a thing as offset, the position where the consumer group is now on each partition. For example, group A consumes the seventh message from partition1, and the fifth from partition2. Group B, independent of A, has other offset.
You can scale your consumer group horizontally, add another process or server. There will be a partition reassignment (Kafka broker will assign each consumer a partition list for consumption) This means that the first consumer group will start consuming only partition 1, and the second only partition 2. If one of the consumers dies (for example, hearthbeat does not come), a new reassignment occurs , each user receives the current partition list for processing.
It is quite convenient. First, you can manipulate the offset for each consumer group. Imagine that there is a partner to whom you are transmitting data from this topic with the results of segmentation. He writes that by chance, as a result, the bug lost the last day of data. And you for the consumer group of this client simply roll back a day ago and pour over the entire data day for him. We can also have our own consumer group, connect to production traffic, watch what is happening, debug on real data.
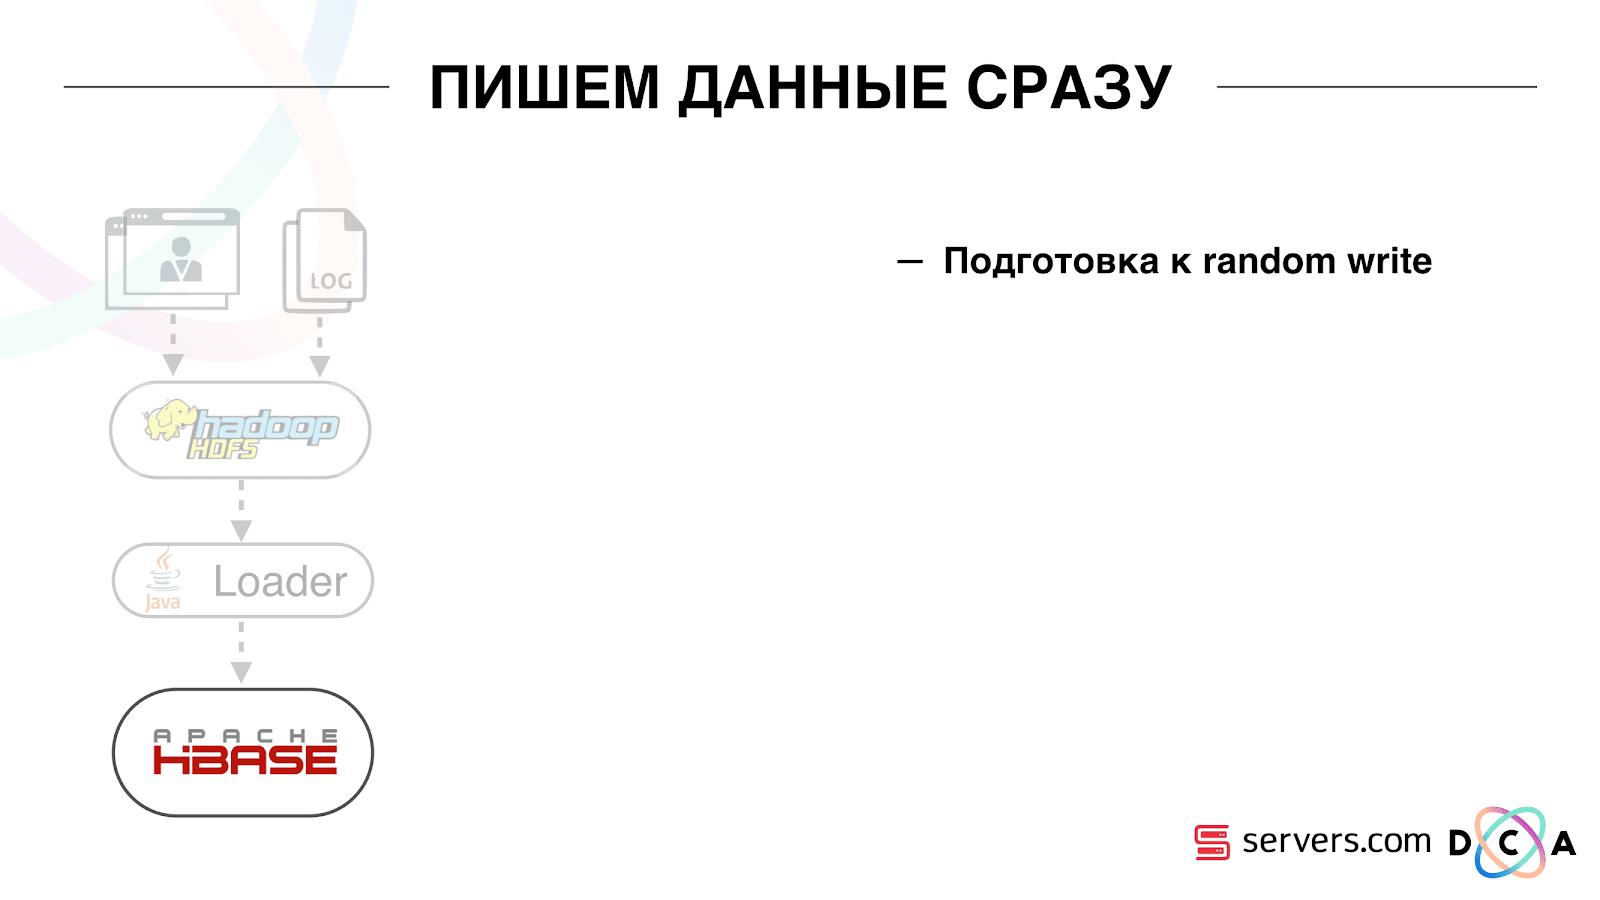
So, we have achieved that we began to segment users as we change, we can independently connect new consumers, we write statistics and we can watch it. Now we need to achieve data recording in HBase immediately after they came to us.
How we did it. There used to be batch data loading. There was a Batch Loader, it processed logs of user activity: if a user made 10 visits, batch came for 10 events, it was recorded in HBase in one operation. There was only one event per segmentation. Now we want to write each separate event in the repository. We will greatly increase the flow to write and read flow. The number of events per segmentation will also increase.
The first thing we did was transfer HBase to SSD. This is not really done with standard tools. This was done by means of HDFS. You can say that a specific directory on HDFS should be on such a disk group. There was a cool problem with the fact that when we took HBase on the SSD and stupidly, all the snapshots got there, and our SSDs ended pretty quickly.
This is also solved, we periodically export snapshot-s to a file, write to another HDFS directory and delete all the meta-information about snapshot-e. If you need to restore - take the saved file, import and restore. This operation is very infrequent, fortunately.
Also, on the SSD, they took out Write Ahead Log, twisted MemStore, turned on the cache block on write option. It allows you to immediately put them in the block cache when writing data. This is very convenient because in our case, if we recorded the data, then they are very likely to be read immediately. This also gave some advantages.
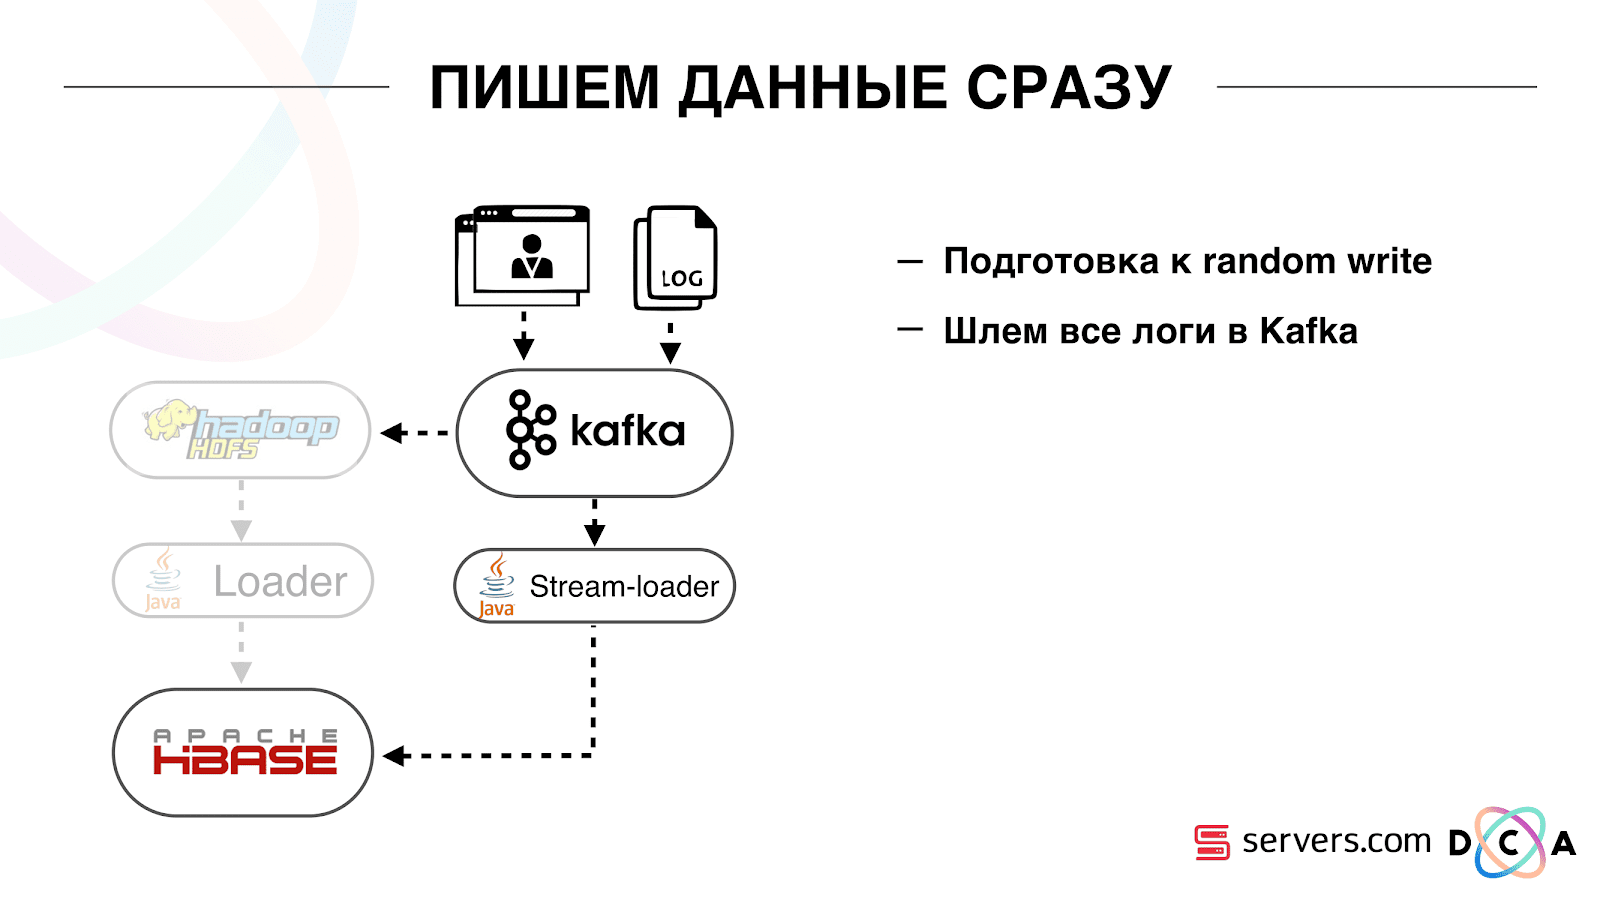
Next, we switched all our data sources to Kafka data entry. Already from Kafka, we recorded data in HDFS to maintain backward compatibility, including so that our analysts could work with the data, run MapReduce tasks and analyze their results.
We have connected a separate consumer group that writes data to HBase. This is, in fact, a wrapper that reads from Kafka and forms PUTs in HBase.
We launched in parallel two schemes in order not to break backward compatibility and not degrade system performance. A new scheme was launched only on a certain percentage of traffic. At 10% everything was pretty cool. But at a greater load, the segmenters could not cope with the flow to segmentation.
We collect the metric "how many messages lay in Kafka before it was read from there." This is a good metric. Initially, we collected the metric “how many messages there are now raw,” but it doesn’t say anything about it. You are watching: “I have a million raw messages,” so what? To interpret this million, you need to know how fast the segmenter (consumer) works, which is not always obvious.
With this metric, you immediately see that the data is written to the queue, taken from it and see how much they are waiting for their processing. We saw that we did not have time to segment, and the message was in the queue for several hours before it was read.
You could just add capacity, but that would be too
Scaling
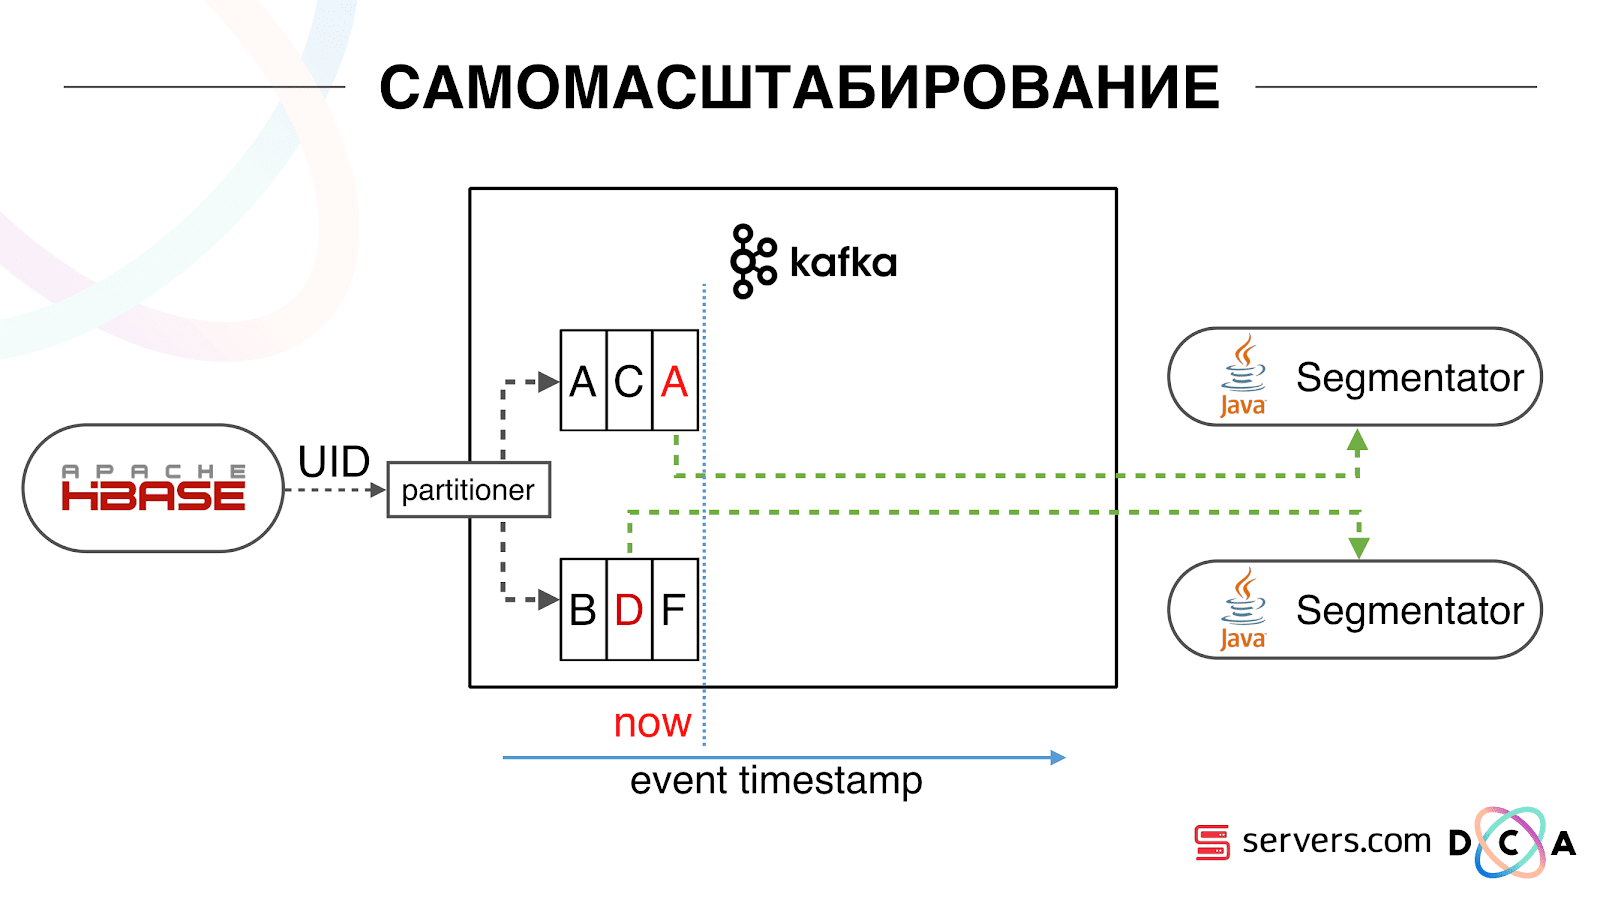
We have HBase. The user is changing, his ID is flying to Kafka. The topic is divided into partitions, the target partition is selected by user ID. This means that when you see the user “Vasya” - he is sent to partition 1. When you see “Petya” - to partition 2. This is convenient - you can achieve that you will see one consumer on one instance of your service, and the second - on another.
We began to watch what was happening. One typical user behavior on the Internet is to go to a website and open several background tabs. Second - go to the site and make a few clicks to get to the landing page.
We look in the queue at the segmentation and see the following: User A visited the page. 5 more events from this user come - each means opening the page. We handle every event from the user. But in fact, the data in HBase contain all 5 visits. We process all 5 visits for the first time, the second time and so on - we waste CPU resources.
Therefore, we began to store a local cache on each of the segmenters with the date when we last analyzed this user. That is, we processed it, recorded its userid and timestamp in the cache. Each kafka message also has a timestamp - we simply compare it: if the timestamp in the queue is less than the last segmentation date, we have already analyzed the user using this data, and you can simply skip this event.
User events (Red A) may be different, and they go out of order. The user can open several background tabs, open several links in a row, maybe there are several of our partners on the site, each of which sends this data.
Our pixel can see the user's visit, and then some other action - we helmet it ourselves. Five events arrive, we process the first red A. If the event has arrived, then it is already in HBase. We see events, run through a set of scripts. We see the following events, and there all the same events, because they are already recorded. We run again and save the cache with the date, compare it with the timestamp event.
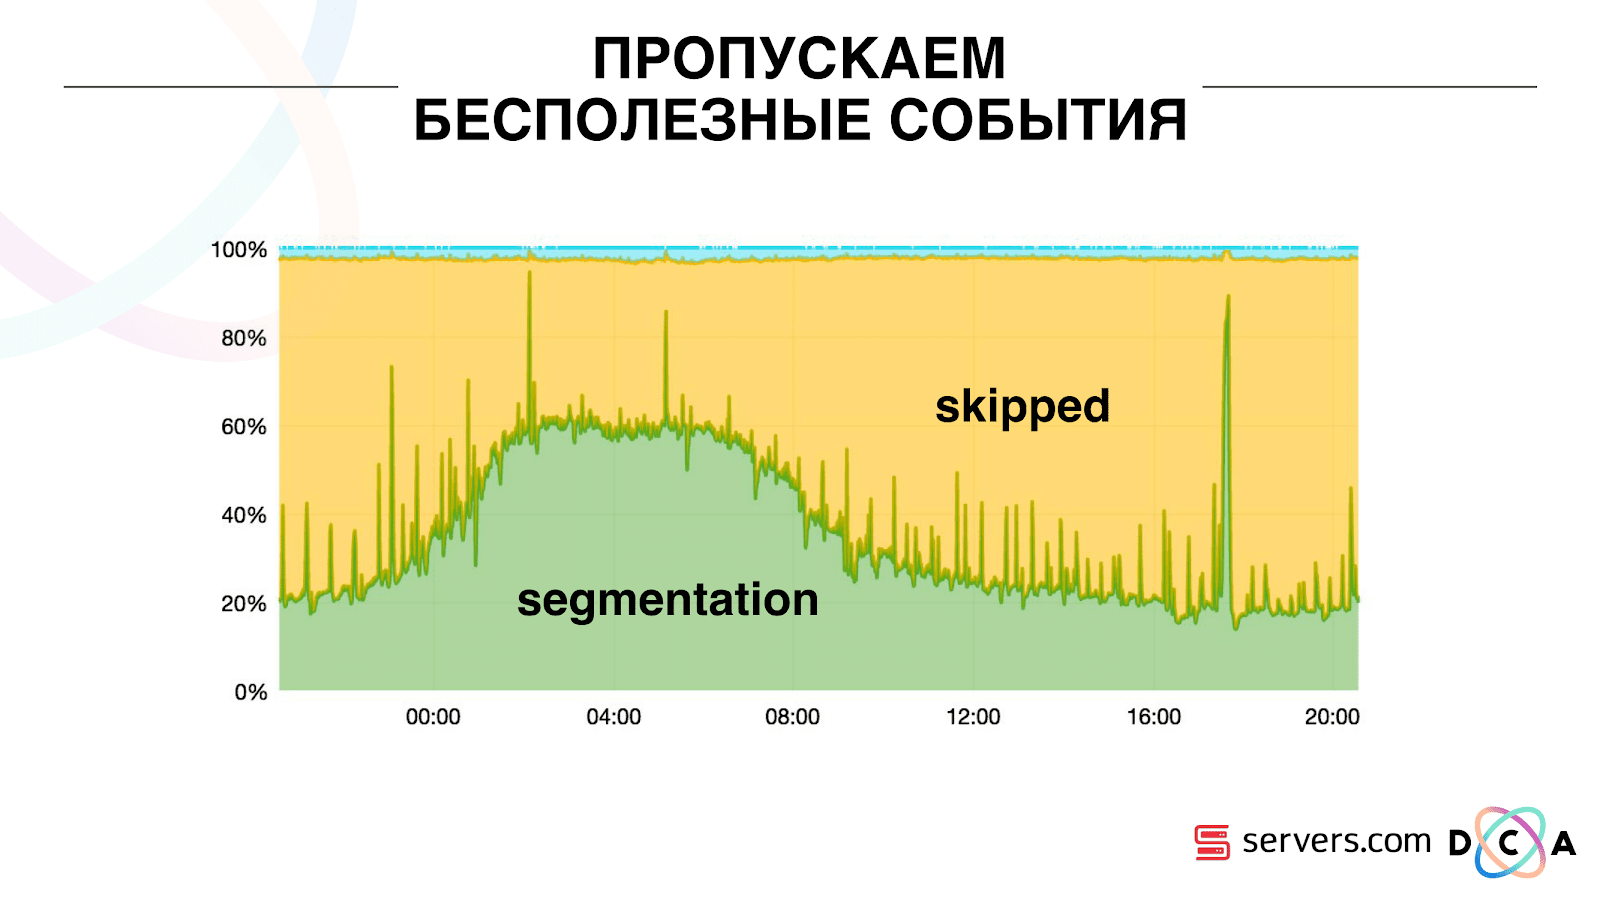
Due to this, the system gained the property of self-scalability. On the Y axis, the percentage of what we do with user IDs when they come to us. Green - the work we have done, run the segmentation script. Yellow - we did not do this, because already segmented exactly this data.
It can be seen that at night there are resources, there is less data flow, and every second event can be segmented. In the daytime, resources are smaller, and we segment only 20% of the events. The jump at the end of the day - the partner added data files that we had not seen before, and they had to be “honestly” segmented.
The system itself adapts to the increase in load. If we have a very large partner - we process the same data but a little less. In this case, the system performance will deteriorate a little in the evening, the segmentation will be delayed not by 2-3 seconds, but by a minute. In the morning we will add servers and we will return to the necessary results.
So we saved about 5 times on the servers. Now we are working on 10 servers, and it would take 50-60.
Blue stuff on top - bots. This is the hardest part of segmentation. They have a huge number of visits, they create a very large load on iron. Each bot we see on a separate server. We can collect local cache with a black list of bots on it. Introduced a simple antifraud: if the user makes too many visits for a certain time, then something is wrong with him, add to the blacklist for a while. This is a blue strip, about 5%. They gave us another 30% savings on the CPU.
Thus, we have achieved that we see the entire data processing pipeline at each stage. We see the metrics for how long the message has lain in Kafka. In the evening, somewhere something blunted, the processing time increased to a minute, then released and returned to normal.
We can monitor how our actions with the system affect its throughput, we can see how much the script is running, where it is necessary to optimize, what can be saved on. We can see the size of the segments, the dynamics of the size of the segments, evaluate their union and intersection. This can be done for more or less the same size of the segments.
What would you like to modify?
We have a Hadoop cluster with some computational resources. He is busy - analysts work on it during the day, but at night he is practically free. In general, we can containerize the segmenter and run it as a separate process within our cluster. We want to store statistics more accurately in order to more accurately calculate the volume of the intersection. Still need optimization on the CPU. This directly affects the cost of the solution.
Summing up: Kafka is good, but, like with any other technology, you need to understand how it works inside and what happens to it. For example, a message priority guarantee works only inside a partition. If you send a message that goes into different partitions, then it is unclear in what sequence they will be processed.
Real data is very important. If we were not tested on real traffic, then, most likely, we would not see problems with bots, with user sessions. Would develop something in a vacuum, run and lay down. It is important to monitor what you consider necessary to monitor, and not to monitor what you do not.
Minute advertising. If you liked this report from the SmartData conference - note that SmartData 2018 will be held in St. Petersburg on October 15th - a conference for those who are immersed in the world of machine learning, analysis and data processing. The program will have a lot of interesting things, the site already has the first speakers and reports.