Testing software RAIDs for NVMe devices using the SNIA technique

A few months ago, in the course of working on the next project, the guys from our research lab conducted research on NVMe disks and software solutions in order to find the best option for building a software array.
The test results were surprisingly discouraging - the huge potential of the speed of NVMe-disks did not correspond at all to the demonstrated performance of the available software products.
Our developers did not like it. And they decided to write their product ... The product, which marketers later happily came up with the name RAIDIX ERA.
Today, more than a dozen companies produce servers adapted for using NVMe drives. The market for products that support and develop this technology has great potential. The G2M analyst report presents fairly convincing figures that convince us that this data transfer protocol will dominate in the near foreseeable future.

Chart from the G2M report
At the moment, one of the leaders in the production of NVMe components is Intel. It was on their equipment that we carried out tests in order to evaluate the capabilities of existing software products for managing this “innovative” hardware.
Together with our partner, Promobit (manufacturer of servers and data storage systems under the brand name BITBLAZE), we organized testing of Intel NVMe-drives and common software for managing such devices. Testing was performed by the method of SNIA.
In this article, we will share figures obtained during testing of Intel's NVMe hardware system, software arrays from MDRAID, Zvol over ZFS RAIDZ2 and, in fact, our new development.
Hardware configuration
The test platform is based on the Intel Server System R2224WFTZS server system. It has 2 sockets for installing Intel Xeon Scalable processors and 12 memory channels (24 DIMMs in total) DDR 4 with frequencies up to 2666 MHz.
More information about the server platform can be found on the manufacturer's website .
All NVMe-drives connected via 3 backplane F2U8X25S3PHS .
In total, we had 12 NVMe-disks INTEL SSDPD2MD800G4 with firmware CVEK6256004E1P0BGN.
The server platform was equipped with two Intel® Xeon® Gold 6130 CPU @ 2.10GHz processors with Hyper-Threading enabled, allowing two threads to run from each core. Thus, at the output we received 64 computational streams.
Preparation for testing
All tests in this article were performed in accordance with the specification of the SNIA SSS PTSe v 1.1 method. In particular, preliminary preparation of the repository was carried out in order to get a stable and honest result.
SNIA allows the user to set the parameters for the number of threads and the queue depth, so we set 64/32, possessing 64 computing threads on 32 cores.
Each test was performed in 16 rounds in order to bring the system to a stable level of indicators and exclude random values.
Before running the tests, we made a preliminary preparation of the system:
- Installing kernel version 4.11 on CentOS 7.4.
- Shut down C-STATES and P-STATES.
- Run the tuned-adm utility and set the latency-performance profile.
We tested each product and element in the following steps:
Preparing devices according to the SNIA specification (dependent and independent of the type of load).
- IOps test in 4k, 8k, 16k, 32k, 64k, 128k, 1m blocks with variations of 0/100, 5/95, 35/65, 50/50, 65/35, 95/5, 100/0 read / write combinations .
- Tests of latency with 4k, 8k, 16k blocks with variations of 0/100, 65/35 and 100/0 read / write combinations. The number of threads and the queue depth is 1-1. Results are recorded in the form of the average and maximum value of delays.
- Bandwidth test (throughtput) with blocks of 128k and 1M, in 64 queues of 8 teams.
We started by testing performance, delays and throughput of the hardware platform. This allowed us to assess the potential of the proposed equipment and compare it with the capabilities of the applied software solutions.
Test 1. Hardware Testing
To begin with, we decided to see what a single Intel DCM D3700 NVMe drive is capable of.
In the specification, the manufacturer states the following performance parameters:
Random Read (100% Span) 450000 IOPS
Random Write (100% Span) 88000 IOPS
Test 1.1 One NVMe drive. IOPS Test
Performance result (IOps) in tabular form. Read / Write Mix%.
| Block size | R0% / W100% | R5% / W95% | R35% / W65% | R50% / W50% | R65% / W35% | R95% / W5% | R100% / W0% |
|---|---|---|---|---|---|---|---|
| 4k | 84017.8 | 91393.8 | 117271.6 | 133059.4 | 175086.8 | 281131.2 | 390969.2 |
| 8k | 42602.6 | 45735.8 | 58980.2 | 67321.4 | 101357.2 | 171316.8 | 216551.4 |
| 16k | 21618.8 | 22834.8 | 29703.6 | 33821.2 | 52552.6 | 89731.2 | 108347 |
| 32k | 10929.4 | 11322 | 14787 | 16811 | 26577.6 | 47185.2 | 50670.8 |
| 64k | 5494.4 | 5671.6 | 7342.6 | 8285.8 | 13130.2 | 23884 | 27249.2 |
| 128k | 2748.4 | 2805.2 | 3617.8 | 4295.2 | 6506.6 | 11997.6 | 13631 |
| 1m | 351.6 | 354.8 | 451.2 | 684.8 | 830.2 | 1574.4 | 1702.8 |
Performance result (IOps) graphically. Read / Write Mix%.

At this stage, we obtained results that very little fall short of the factory ones. Most likely, NUMA played its role (the computer memory implementation scheme used in multiprocessor systems, when the access time to memory is determined by its location relative to the processor), but for now we will not pay attention to it.
Test 1.2 One NVMe-drive. Delay tests
Average response time (ms) in tabular form. Read / Write Mix%.
| Block size | R0% / W100% | R65% / W35% | R100% / W0% |
|---|---|---|---|
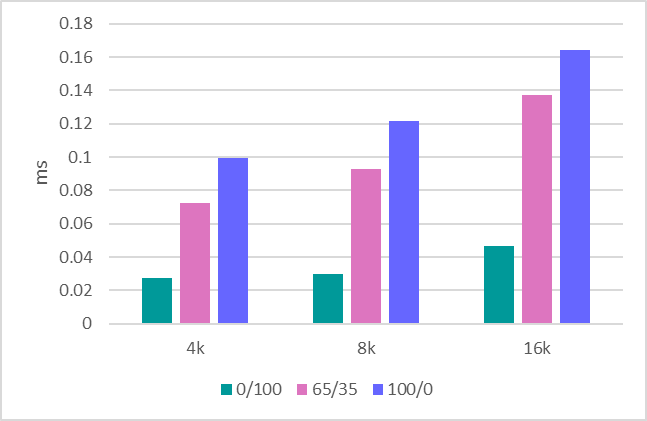
| 4k | 0.02719 | 0.072134 | 0.099402 |
| 8k | 0.029864 | 0.093092 | 0.121582 |
| 16k | 0.046726 | 0.137016 | 0.16405 |
Average response time (ms) graphically. Read / Write Mix%.
Maximum response time (ms) in tabular form. Read / Write Mix%.
| Block size | R0% / W100% | R65% / W35% | R100% / W0% |
|---|---|---|---|
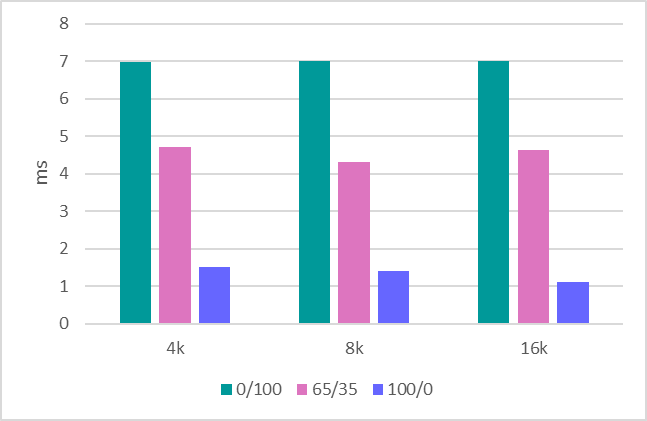
| 4k | 6.9856 | 4.7147 | 1.5098 |
| 8k | 7.0004 | 4.3118 | 1.4086 |
| 16k | 7.0068 | 4.6445 | 1.1064 |
Maximum response time (ms) graphically. Read / Write Mix%.
Test 1.3 Throughput
The final step is throughput assessment. Here we have such indicators:
1MB sequential write - 634 MBps.
1MB sequential read - 1707 MBps.
128KB sequential write - 620 MBps.
128KB sequential read - 1704 MBps.
Having dealt with a single disk, we proceed to the evaluation of the entire platform, which consists of 12 drives.
Test 1.4 System in 12 drives. IOPS Test
It was a volitional decision to save time and show results only for working with block 4k, which is by far the most common and significant performance evaluation scenario.
Performance result (IOps) in tabular form. Read / Write Mix%.
| Block size | R0% / W100% | R5% / W95% | R35% / W65% | R50% / W50% | R65% / W35% | R95% / W5% | R100% / W0% |
|---|---|---|---|---|---|---|---|
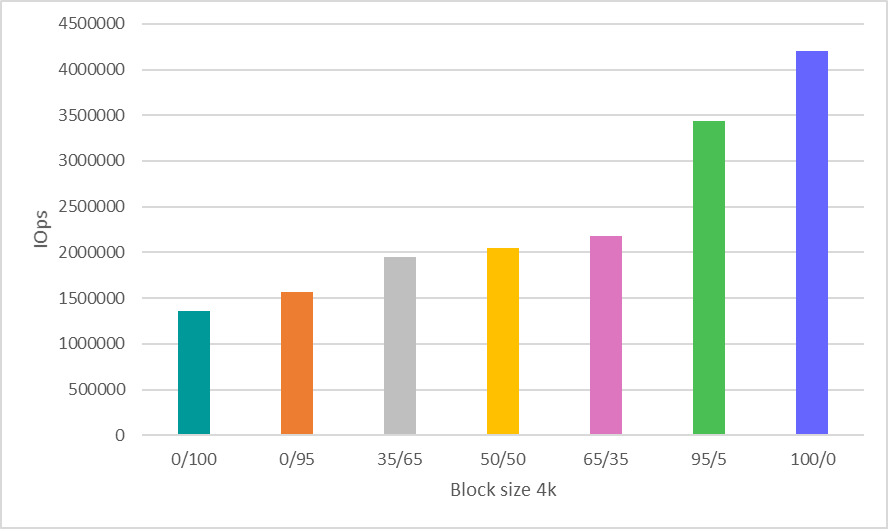
| 4k | 1363078.6 | 1562345 | 1944105 | 2047612 | 2176476 | 3441311 | 4202364 |
Performance result (IOps) graphically. Read / Write Mix%.
Test 1.5 System in 12 drives. Bandwidth tests
1MB sequential write - 8612 MBps.
1MB sequential read - 20481 MBps.
128KB sequential write - 7500 MBps.
128KB sequential read - 20400 MBps.
We will look at the obtained performance indicators of hardware at the end of the article, comparing them with the numbers of the software tested on it.
Test 2. MDRAID testing
When we talk about a software array, MDRAID comes to mind first. Recall that this is a basic software RAID for Linux, which is distributed completely free of charge.
Let's see how MDRAID will cope with the 12-disk system offered to it at the level of RAID 0. We all understand that building RAID 0 on 12 disks requires special courage, but now we need this level of array to demonstrate the maximum capabilities of this solution.
Test 2.1 MDRAID. RAID 0. IOPS Test
Performance result (IOps) in tabular form. Read / Write Mix%.
| Block size | R0% / W100% | R5% / W95% | R35% / W65% | R50% / W50% | R65% / W35% | R95% / W5% | R100% / W0% |
|---|---|---|---|---|---|---|---|
| 4k | 1010396 | 1049306.6 | 1312401.4 | 1459698.6 | 1932776.8 | 2692752.8 | 2963943.6 |
| 8k | 513627.8 | 527230.4 | 678140 | 771887.8 | 1146340.6 | 1894547.8 | 2526853.2 |
| 16k | 261087.4 | 263638.8 | 343679.2 | 392655.2 | 613912.8 | 1034843.2 | 1288299.6 |
| 32k | 131198.6 | 130947.4 | 170846.6 | 216039.4 | 309028.2 | 527920.6 | 644774.6 |
| 64k | 65083.4 | 65099.2 | 85257.2 | 131005.6 | 154839.8 | 268425 | 322739 |
| 128k | 32550.2 | 32718.2 | 43378.6 | 66999.8 | 78935.8 | 136869.8 | 161015.4 |
| 1m | 3802 | 3718.4 | 3233.4 | 3467.2 | 3546 | 6150.8 | 8193.2 |
Performance result (IOps) graphically. Read / Write Mix%.

Test 2.2 MDRAID. RAID 0. Delay Tests
Average response time (ms) in tabular form. Read / Write Mix%.
| Block size | R0% / W100% | R65% / W35% | R100% / W0% |
|---|---|---|---|
| 4k | 0.03015 | 0.067541 | 0.102942 |
| 8k | 0.03281 | 0.082132 | 0.126008 |
| 16k | 0.050058 | 0.114278 | 0.170798 |
Average response time (ms) graphically. Read / Write Mix%.

Maximum response time (ms) in tabular form. Read / Write Mix%.
| Block size | R0% / W100% | R65% / W35% | R100% / W0% |
|---|---|---|---|
| 4k | 6.7042 | 3.7257 | 0.8568 |
| 8k | 6.5918 | 2.2601 | 0.9004 |
| 16k | 6.3466 | 2.7741 | 2.5678 |
Maximum response time (ms) graphically. Read / Write Mix%.

Test 2.3 MDRAID. RAID 0. Bandwidth tests
1MB sequential write - 7820 MBPS.
1MB sequential read - 20418 MBPS.
128KB sequential write - 7622 MBPS.
128KB sequential read - 20380 MBPS.
Test 2.4 MDRAID. RAID 6. IOPS Test
Let's now see what happens with this system at RAID 6.
Array creation options
mdadm --create --verbose --chunk 16K / dev / md0 --level = 6 --raid-devices = 12 / dev / nvme0n1 / dev / nvme1n1 / dev / nvme2n1 / dev / nvme3n1 / dev / nvme4n1 / dev / nvme5n1 / dev / nvme8n1 / dev / nvme9n1 / dev / nvme10n1 / dev / nvme11n1 / dev / nvme6n1 / dev / nvme7n1
The total volume of the array was 7450.87 GiB.
Run the test after pre-initializing the RAID.
Performance result (IOps) in tabular form. Read / Write Mix%.
| Block size | R0% / W100% | R5% / W95% | R35% / W65% | R50% / W50% | R65% / W35% | R95% / W5% | R100% / W0% |
|---|---|---|---|---|---|---|---|
| 4k | 39907.6 | 42849 | 61609.8 | 78167.6 | 108594.6 | 641950.4 | 1902561.6 |
| 8k | 19474.4 | 20701.6 | 30316.4 | 39737.8 | 57051.6 | 394072.2 | 1875791.4 |
| 16k | 10371.4 | 10979.2 | 16022 | 20992.8 | 29955.6 | 225157.4 | 1267495.6 |
| 32k | 8505.6 | 8824.8 | 12896 | 16657.8 | 23823 | 173261.8 | 596857.8 |
| 64k | 5679.4 | 5931 | 8576.2 | 11137.2 | 15906.4 | 109469.6 | 320874.6 |
| 128k | 3976.8 | 4170.2 | 5974.2 | 7716.6 | 10996 | 68124.4 | 160453.2 |
| 1m | 768.8 | 811.2 | 1177.8 | 1515 | 2149.6 | 4880.4 | 5499 |
Performance result (IOps) graphically. Read / Write Mix%.

Test 2.5 MDRAID. RAID 6. Delay Tests
Average response time (ms) in tabular form. Read / Write Mix%.
| Block size | R0% / W100% | R65% / W35% | R100% / W0% |
|---|---|---|---|
| 4k | 0.193702 | 0.145565 | 0.10558 |
| 8k | 0.266582 | 0.186618 | 0.127142 |
| 16k | 0.426294 | 0.281667 | 0.169504 |
Average response time (ms) graphically. Read / Write Mix%.

Maximum response time (ms) in tabular form. Read / Write Mix%.
| Block size | R0% / W100% | R65% / W35% | R100% / W0% |
|---|---|---|---|
| 4k | 6.1306 | 4.5416 | 4.2322 |
| 8k | 6.2474 | 4.5197 | 3.5898 |
| 16k | 5.4074 | 5.5861 | 4.1404 |
Maximum response time (ms) graphically. Read / Write Mix%.

It is worth noting that here MDRAID showed a very good level of delays.
Test 2.6 MDRAID. RAID 6. Bandwidth Tests
1MB sequential write - 890 MBPS.
1MB sequential read - 18,800 MBPS.
128KB sequential write - 870 MBPS.
128KB sequential read - 10400 MBPS.
Test 3. Zvol over ZFS RAIDZ2
ZFS has a built-in RAID creation function and a built-in volume manager that creates virtual block devices, which many storage vendors use. We will also use these features, creating a RAIDZ2-protected pool (analogous to RAID 6) and a virtual block volume on top of it.
Version 0.79 (ZFS) has been compiled. Parameters for creating an array and volume:
ashift = 12 / compression - off / dedup - off / recordsize = 1M / atime = off / cachefile = none / Type RAID = RAIDZ2
ZFS shows very good results with the newly created pool. However, with multiple re-recordings, performance is significantly reduced.
The SNIA approach is good enough, which allows you to see real results from testing similar file systems (the one that is at the heart of ZFS) after repeated rewrites on them.
Test 3.1 ZVOL (ZFS). RAIDZ2. IOps test
Performance result (IOps) in tabular form. Read / Write Mix%.
| Block size | R0% / W100% | R5% / W95% | R35% / W65% | R50% / W50% | R65% / W35% | R95% / W5% | R100% / W0% |
|---|---|---|---|---|---|---|---|
| 4k | 15719.6 | 15147.2 | 14190.2 | 15592.4 | 17965.6 | 44832.2 | 76314.8 |
| 8k | 15536.2 | 14929.4 | 15140.8 | 16551 | 17898.8 | 44553.4 | 76187.4 |
| 16k | 16696.6 | 15937.2 | 15982.6 | 17350 | 18546.2 | 44895.4 | 75549.4 |
| 32k | 11859.6 | 10915 | 9698.2 | 10235.4 | 11265 | 26741.8 | 38167.2 |
| 64k | 7444 | 6440.2 | 6313.2 | 6578.2 | 7465.6 | 14145.8 | 19099 |
| 128k | 4425.4 | 3785.6 | 4059.8 | 3859.4 | 4246.4 | 7143.4 | 10052.6 |
| 1m | 772 | 730.2 | 779.6 | 784 | 824.4 | 995.8 | 1514.2 |
Performance result (IOps) graphically. Read / Write Mix%.

Performance figures are quite unimpressive. At the same time, pure zvol (before rewrites) gives significantly better results (5-6 times higher). Here, the test showed that after the first rewrite, performance drops.
Test 3.2 ZVOL (ZFS). RAIDZ2. Delay tests
Average response time (ms) in tabular form. Read / Write Mix%.
| Block size | R0% / W100% | R65% / W35% | R100% / W0% |
|---|---|---|---|
| 4k | 0.332824 | 0.255225 | 0.218354 |
| 8k | 0.3299 | 0.259013 | 0.225514 |
| 16k | 0.139738 | 0.180467 | 0.233332 |
Average response time (ms) graphically. Read / Write Mix%.

Maximum response time (ms) in tabular form. Read / Write Mix%.
| Block size | R0% / W100% | R65% / W35% | R100% / W0% |
|---|---|---|---|
| 4k | 90.55 | 69.9718 | 84.4018 |
| 8k | 91.6214 | 86.6109 | 104.7368 |
| 16k | 108.2192 | 86.2194 | 105.658 |
Maximum response time (ms) graphically. Read / Write Mix%.

Test 3.3 ZVOL (ZFS). RAIDZ2. Bandwidth tests
1MB sequential write - 1150 MBPS.
1MB sequential read - 5500 MBPS.
128KB sequential write - 1100 MBPS.
128KB sequential read - 5300 MBPS.
Test 4. RAIDIX ERA
Let's now look at the tests of our new product - RAIDIX ERA.
We created RAID6. Stripe size: 16kb. After the initialization is complete, run the test.
Performance result (IOps) in tabular form. Read / Write Mix%.
| Block size | R0% / W100% | R5% / W95% | R35% / W65% | R50% / W50% | R65% / W35% | R95% / W5% | R100% / W0% |
|---|---|---|---|---|---|---|---|
| 4k | 354887 | 363830 | 486865.6 | 619349.4 | 921403.6 | 2202384.8 | 4073187.8 |
| 8k | 180914.8 | 185371 | 249927.2 | 320438.8 | 520188.4 | 1413096.4 | 2510729 |
| 16k | 92115.8 | 96327.2 | 130661.2 | 169247.4 | 275446.6 | 763307.4 | 1278465 |
| 32k | 59994.2 | 61765.2 | 83512.8 | 116562.2 | 167028.8 | 420216.4 | 640418.8 |
| 64k | 27660.4 | 28229.8 | 38687.6 | 56603.8 | 76976 | 214958.8 | 299137.8 |
| 128k | 14475.8 | 14730 | 20674.2 | 30358.8 | 40259 | 109258.2 | 160141.8 |
| 1m | 2892.8 | 3031.8 | 4032.8 | 6331.6 | 7514.8 | 15871 | 19078 |
Performance result (IOps) graphically. Read / Write Mix%.

Test 4.2 RAIDIX ERA. RAID 6. Delay Tests
Average response time (ms) in tabular form. Read / Write Mix%.
| Block size | R0% / W100% | R65% / W35% | R100% / W0% |
|---|---|---|---|
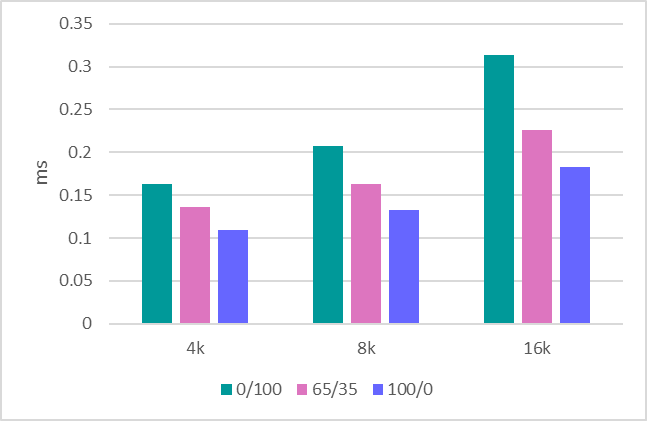
| 4k | 0.16334 | 0.136397 | 0.10958 |
| 8k | 0.207056 | 0.163325 | 0.132586 |
| 16k | 0.313774 | 0.225767 | 0.182928 |
Average response time (ms) graphically. Read / Write Mix%.
Maximum response time (ms) in tabular form. Read / Write Mix%.
| Block size | R0% / W100% | R65% / W35% | R100% / W0% |
|---|---|---|---|
| 4k | 5.371 | 3.4244 | 3.5438 |
| 8k | 5.243 | 3.7415 | 3.5414 |
| 16k | 7.628 | 4.2891 | 4.0562 |
Maximum response time (ms) graphically. Read / Write Mix%.

Delays are similar to what MDRAID issues. But for more accurate conclusions, you should evaluate the delays under a more serious load.
Test 4.3 RAIDIX ERA. RAID 6. Bandwidth Tests
1MB sequential write - 8160 MBPS.
1MB sequential read - 19700 MBPS.
128KB sequential write - 6200 MBPS.
128KB sequential read - 19700 MBPS.
Conclusion
As a result of the tests performed, it is worth comparing the figures obtained from software solutions with what the hardware platform provides us.
To analyze the performance of a random load, we will compare the speed of RAID 6 (RAIDZ2) when working with a 4k block.
| MD RAID 6 | RAIDZ2 | RAIDIX ERA RAID 6 | Hardware | |
|---|---|---|---|---|
| 4k R100% / W0% | 1902561 | 76314 | 4073187 | 4494142 |
| 4k R65% / W35% | 108594 | 17965 | 921403 | 1823432 |
| 4k R0% / W100% | 39907 | 15719 | 354887 | 958054 |
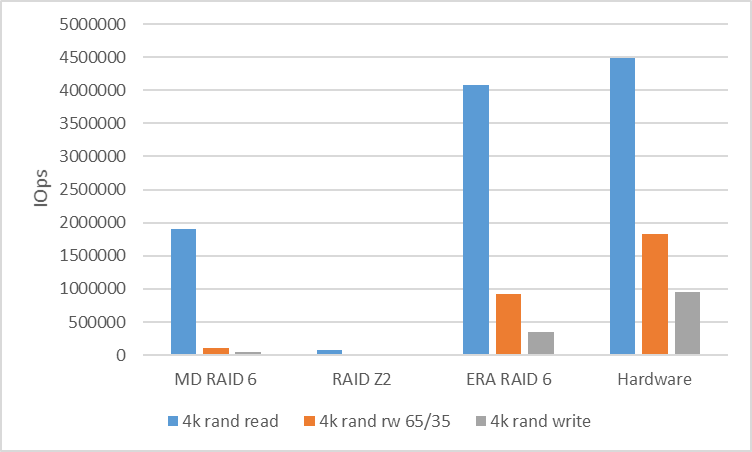
To analyze the performance of the serial load, we look at RAID 6 (RAIDZ2) with a 128k block. Between the streams we used a shift of 10GB to eliminate the cache hit and show the real performance.
| MD RAID 6 | RAIDZ2 | RAIDIX ERA RAID 6 | Hardware | |
|---|---|---|---|---|
| 128k seq read | 10400 | 5300 | 19700 | 20400 |
| 128k seq write | 870 | 1100 | 6200 | 7500 |

What is the result?
Popular and available software RAID-arrays for working with NVMe-devices can not show the performance that lies in the hardware potential.
Here there is an obvious need for control software that can stir up the situation and show that the software-managing symbiosis with NVMe-drives can be very productive and flexible.
Understanding this query, we created a RAIDIX ERA product in our company, the development of which focused on the following tasks:
- High read and write performance (several million IOps) on arrays with Parity in mix mode.
- Stream performance from 30GBps including during failures and recoveries.
- RAID support levels 5, 6, 7.3.
- Background initialization and reconstruction.
- Flexible settings for different types of load (from the user).
At the moment, we can say that these tasks have been completed and the product is ready for use.
At the same time, understanding the interest of many interested parties in such technologies, we prepared for release not only a paid, but also a free license , which can be fully used for solving tasks on both NVMe and SSD drives.
Read more about the RAIDIX ERA product on our website .
UPD. ZFS reduced testing with recordsize and volblocksize 8k
ZFS Parameters Table
| NAME | PROPERTY | Value | SOURCE |
|---|---|---|---|
| tank | recordsize | 8K | local |
| tank | compression | off | default |
| tank | dedup | off | default |
| tank | checksum | off | local |
| tank | volblocksize | - | - |
| tank / raid | recordsize | - | - |
| tank / raid | compression | off | local |
| tank / raid | dedup | off | default |
| tank / raid | checksum | off | local |
| tank / raid | volblocksize | 8k | default |
The recording has become worse, the reading is better.
But all the same, all the results are much worse than other solutions.
| Block size | R0% / W100% | R5% / W95% | R35% / W65% | R50% / W50% | R65% / W35% | R95% / W5% | R100% / W0% |
|---|---|---|---|---|---|---|---|
| 4k | 13703.8 | 14399.8 | 20903.8 | 25669 | 31610 | 66955.2 | 140849.8 |
| 8k | 15126 | 16227.2 | 22393.6 | 27720.2 | 34274.8 | 67008 | 139480.8 |
| 16k | 11111.2 | 11412.4 | 16980.8 | 20812.8 | 24680.2 | 48803.6 | 83710.4 |
