Debug as a process
It is believed that the development takes about 10% of the time, and debugging - 90%. Perhaps this statement is exaggerated, but any developer would agree that debugging is an extremely resource-intensive process, especially in large multi-threaded systems.
Thus, the optimization and systematization of the debugging process can bring significant benefits in the form of man-hours saved, increasing the speed of solving problems and, ultimately, increasing the loyalty of your users.
Sergey Schegrikovich (dotmailer) at the DotNext 2018 conference Piter suggested looking at debugging as a process that can be described and optimized. If you still do not have a clear search plan for bugs - under the cut video and text interpretation of the report of Sergey.
(And at the end of the post, we added the appeal of John Skit to all the workers, be sure to take a look)
My goal is to answer the question: how to fix bugs effectively and what should be the focus. I think the answer to this question is a process. The process of debugging, which consists of very simple rules, and you know them well, but probably use them unconsciously. Therefore, my task is to systematize them and by example show how to become more effective.
We will develop a common language of communication during debugging, as well as see a direct path to finding the main problems. In my examples, I will show what happened because of a violation of these rules.
Of course, any debugging is impossible without debugging utilities. My favorites are:
Let's start with an example from my life in which I will show how the haphazardness of the debugging process leads to inefficiency.
Probably everybody has such a thing when you come to a new company in a new team for a new project, from the very first day you want to inflict irreparable benefits. So it was with me. At that time, we had a service that took html to the input, and issued pictures to the output.
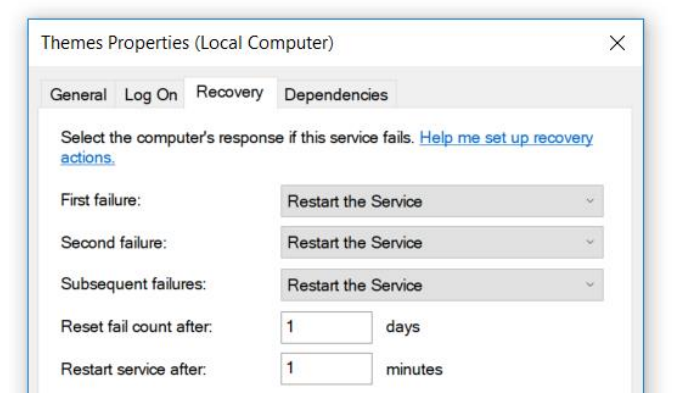
The service was written under .Net 3.0 and it was a long time ago. This service had a small feature - it fell. Fell often, about once every two to three hours. We fixed it elegantly - put it in the properties of the restart service after the fall.
The service was not critical for us and we could survive it. But I joined the project and the first thing I decided to do was fix it.
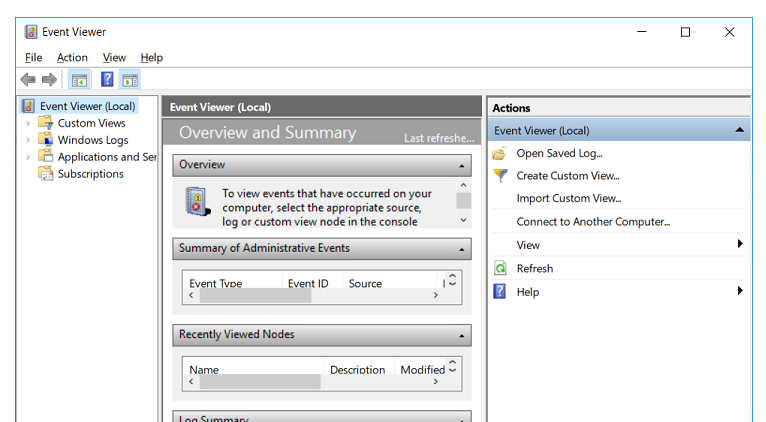
Where do .NET developers go if something doesn't work? They go to the EventViewer. But there I did not find anything, except the record that the service fell. There were no native bug reports, no call stack.
There is a proven tool to do next - we wrap the whole
The idea is simple: it
We repeat the process: the service crashes, there are no errors in the logs. The last thing that can help is
We compile, deploy, the service crashes, there are no errors. Three days pass behind this process, now the thought is coming that we should finally start thinking and doing something else. You can do a lot of things: try to reproduce the error on the local machine, watch memory dumps and so on. It seemed another two days and I would fix this bug ...
Two weeks passed.
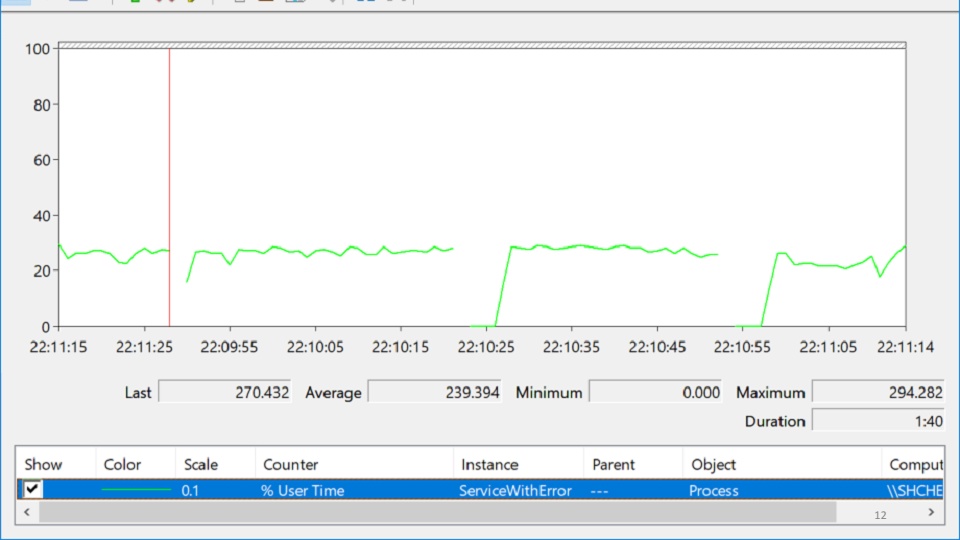
I looked in PerformanceMonitor, where I saw a service that crashes, then rises, then crashes again. This state is called despair and looks like this:
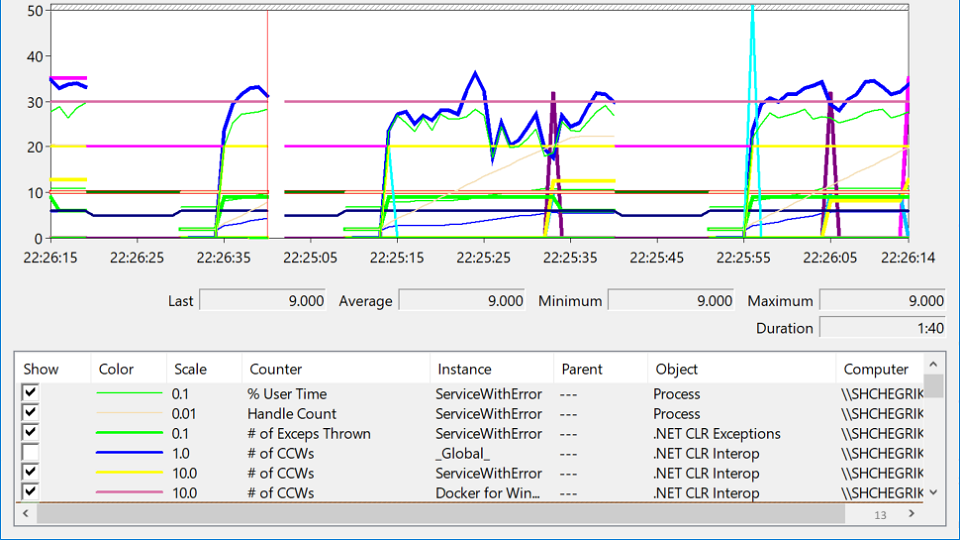
In this variety of tags you are trying to understand, where is the problem really? After several hours of meditation, the problem suddenly shows up:
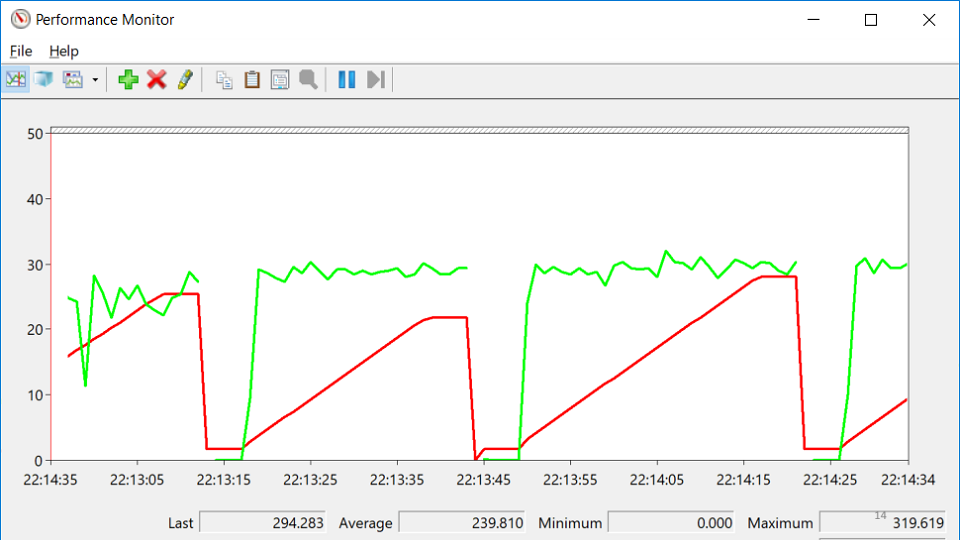
The red line is the number of native handles owned by the process. A native handle is a link to an operating system resource: file, registry, registry key, mutex, and so on. For some strange coincidence, the fall in the growth of the number of handles coincides with the moments of the drop in service. This suggests that there is a handle leak somewhere.
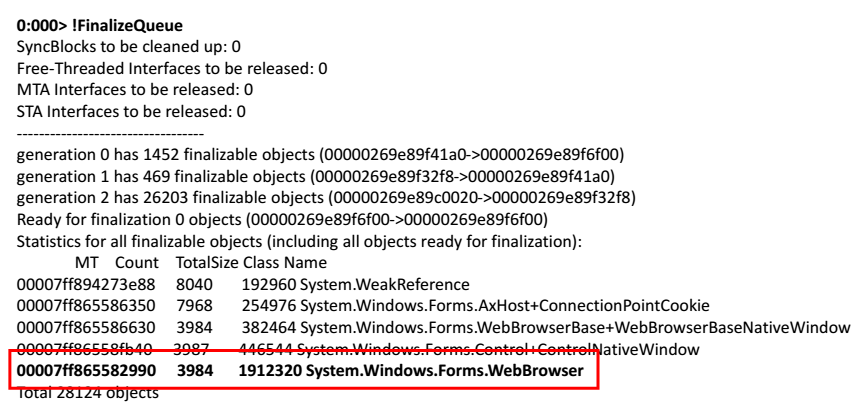
We take a memory dump, open it in WinDbg. We start to execute commands. Let's try to look at the queue of finalizing those objects that should be released by the application.
At the very end of the list, I found a web browser.
The solution is simple - take WebBrowser and call for it
The conclusions from this story can be drawn as follows: two weeks is a long and too long time to find an uncalled
After that, I had a question: how to debug effectively and what to do?
To do this, you need to know all three things:
These are fairly clear rules that describe themselves.
Repeat the error. Very simple rule, because if you can not repeat the error, then perhaps there is nothing to fix. But there are different cases, especially for bugs in a multi-threaded environment. We somehow had a mistake that appeared only on Itanium processors and only on production servers. Therefore, the first task in the debugging process is to find a test bench configuration on which the error would be reproduced.
If you have not corrected the error, then it is not corrected. Sometimes it happens like this: there is a bug in the bug tracker that appeared half a year ago, no one has seen it for a long time, and there is a desire to just close it. But at this moment we miss the chance for knowledge, the chance to understand how our system works and what really happens to it. Therefore, any bug is a new opportunity to learn something, to learn more about your system.
Understand the system. Brian Kernigan said once that if we were so smart to write this system, then we need to be doubly smart to debug it.
A small example to the rule. Our monitoring draws graphics:
This is a graph of the number of requests processed by our service. Once looking at it, we came up with the idea that it would be possible to increase the speed of the service. In this case, the graph will rise, it may be possible to reduce the number of servers.
Optimization of web-performance is done simply: we take PerfView, we start it on the production machine, it removes the trace within 3-4 minutes, we take this trace to the local machine and begin to study it.
One of the statistics PerfView shows is the garbage collector.
Looking at these statistics, we saw that the service spends 85% of its time on garbage collection. You can see in PerfView exactly where this time is spent.
In our case, this is the creation of strings. The correction suggests itself: we replace all strings with StringBuilders. Locally we get a performance boost of 20-30%. Deploy to production, we look at the results in comparison with the old schedule:
The rule “Understand the system” is not only about understanding how interactions occur in your system, how messages go, but about trying to model your system.
In the example, the graph shows the bandwidth. But if you look at the whole system from the point of view of queuing theory, it turns out that the throughput of our system depends on only one parameter - on the rate at which new messages arrive. In fact, the system simply did not have more than 80 messages at a time, so optimizing this schedule will not work.
Check the plug. If you open the documentation of any home appliance, then it will surely be written there: if the appliance does not work, check that the plug is plugged in. After several hours in the debugger, I often find myself thinking that I just had to recompile it, or simply pick up the latest version.
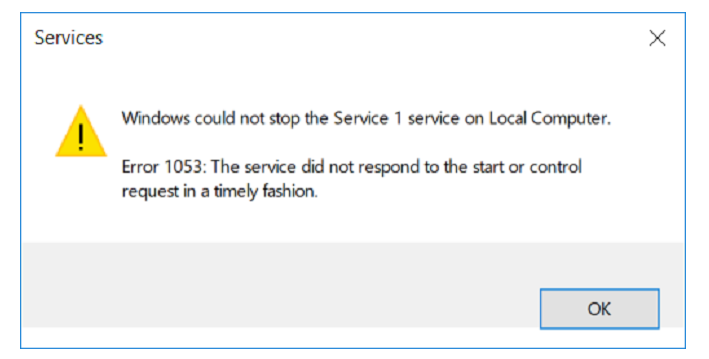
The rule “check plug” is about facts and data. Debugging does not start with running WinDbg or PerfView on production machines; it starts with checking facts and data. If the service does not respond, maybe it just is not running.
Divide and rule. This is the first and probably the only rule that includes debugging as a process. It is about hypotheses, their nomination and verification.
One of our services did not want to stop.
We make a hypothesis: perhaps in the project there is a cycle that processes something endlessly.
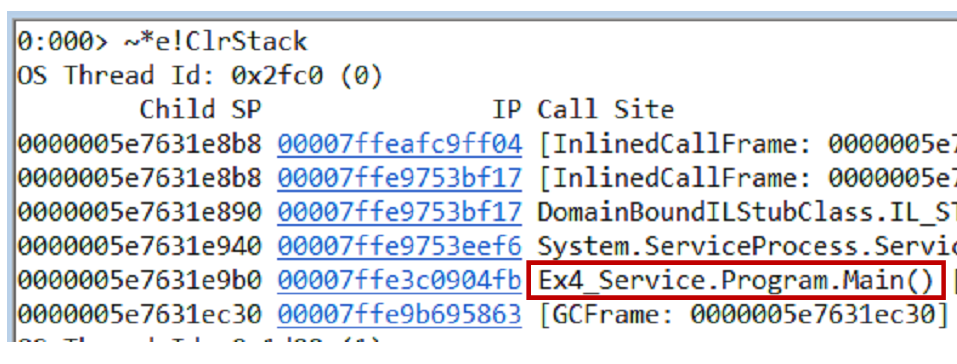
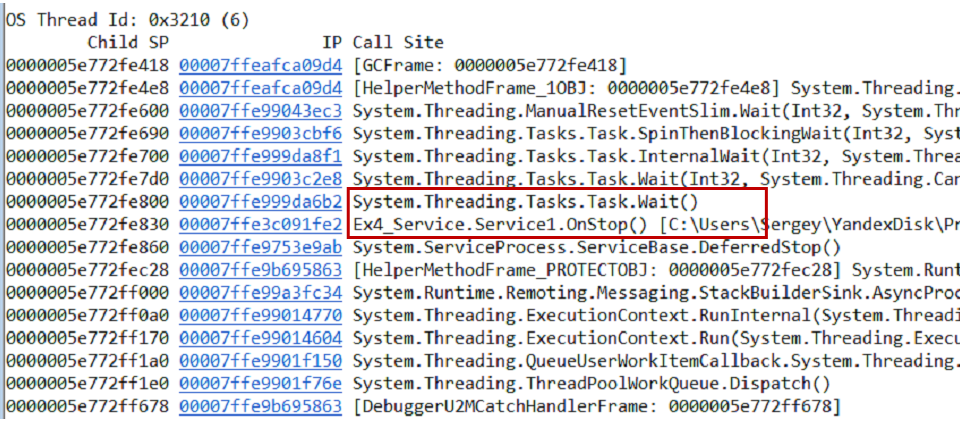
You can test the hypothesis in different ways, one of the options is to take a memory dump. From the dump, we pull out the call-stack and all threads using the command
The first thread is in the Main, the second is in the handler
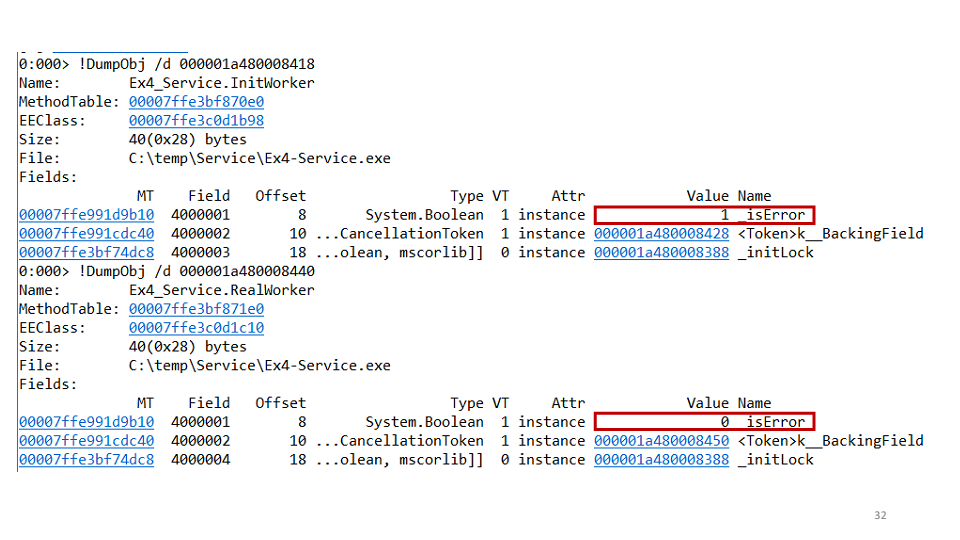
Our service works as follows. There are two tasks - initialization and working. The initialization opens the connection to the database, the worker starts processing the data. The connection between them occurs through a common flag, which is implemented using
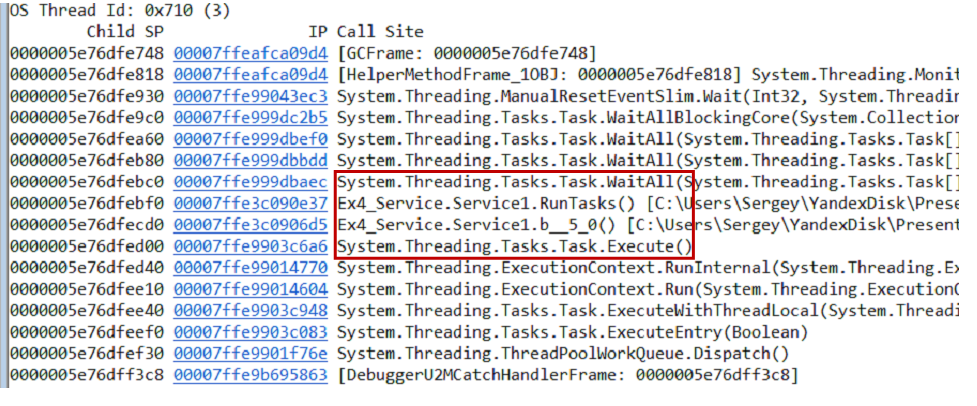
We make the second hypothesis: perhaps we have a deadlock of one task to the second. To check this, you can view each task separately through WinDbg.
It turns out that one of the tasks fell, and the second did not. In the project we saw the following code:
It means that the initialization task opens a connection and then sets it
In this example, we put forward two hypotheses: about an infinite loop and about deadlock. The rule "divide and conquer" helps to localize the error. By successive approximations, such problems are solved.
The most important thing about this rule is hypotheses, because over time they turn into patterns. And depending on the hypothesis, we apply different actions.
Freshen up This rule is that you just need to get up from the table and walk, drink water, juice or coffee, do anything, but most importantly - to distract from their problems.
There is a very good method called "duck". According to the method, we must tell our duckwork about the problem . As a duckYou can use a colleague. Moreover, he does not have to answer, it is enough to listen and agree. And often, after the first problems are discussed, you yourself find a solution.
This is your bug. I will tell about this rule on an example.
There was a problem in one
For this bug it was clear that the integrity of the memory was violated somewhere. Fortunately, at that time we already used the change management system. In the end, after a couple of hours, it became clear what happened: we put .Net 4.5.2 on our production machines.
Accordingly, we send a bug to Microsoft, they review it, we communicate with them, they fix the bug in .Net 4.6.1.
For me, this resulted in 11 months of work with Microsoft support, of course, not daily, but just 11 months passed from start to fix. In addition, we sent them dozens of gigabytes of memory dumps, we put hundreds of private builds to catch this error. And all this time, we could not tell our customers that Microsoft was to blame, not us. Therefore, the bug is always yours.
Five why. We use Elastic in our company. Elastic is good for log aggregation.
You come to work in the morning, and Elastic lies.
The first question is why does Elastic lie? Almost immediately it became clear - Master Nodes fell. They coordinate the work of the entire cluster and, when they fall, the entire cluster stops responding. Why didn't they get up? Probably should be autostart? Looking for an answer, found - does not match the version of the plugin. Why did Master Nodes fall at all? OOM Killer killed them. This is such a thing on linux-machines that, in the event of a shortage of memory, closes unnecessary processes. Why is there not enough memory? Because the update process started, which follows from the system logs. Why did it work before, but not now? But because we added new nodes a week earlier, accordingly, Master Nodes took more memory to store indexes and cluster configurations.
Questions "why?" Help find the root of the problem. In the example, we could turn away from the correct path many times, but the full fix looks like this: updating the plugin, starting services, increasing memory and making a note for the future, that next time, when adding new nodes to the cluster, you need to make sure that the Master has enough memory Nodes.
Applying these rules reveals real problems, shifts your focus to solving these problems, and helps you communicate. But it would be even better if these rules formed the system. And there is such a system, it is called a debugging algorithm.
I first read about the debugging algorithm in John Robbins’s book Debugging Applications. It describes the debugging process as follows:
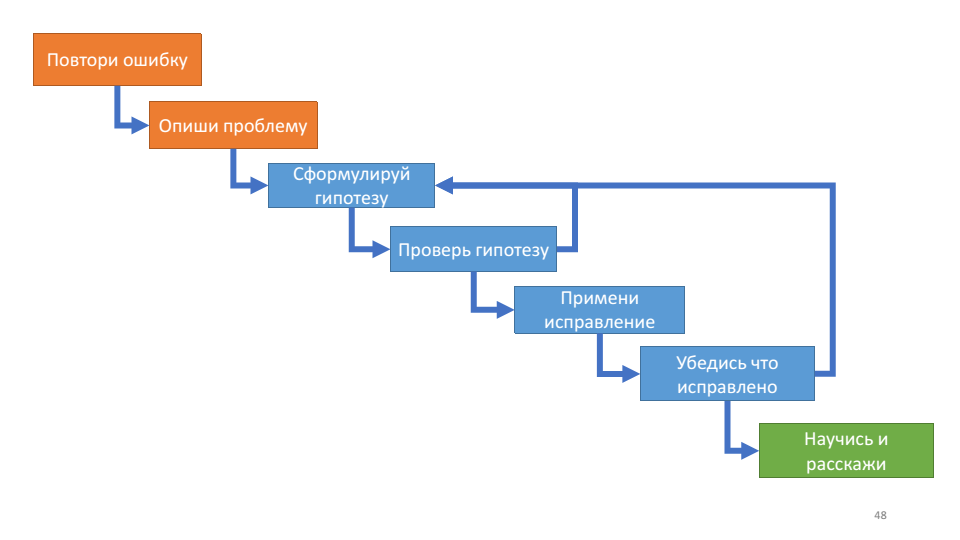
This algorithm is useful for its internal cycle - working with a hypothesis.
With each turn of the cycle, we can check ourselves: do we know more about the system or not? If we put forward hypotheses, check them, they don’t work, we don’t learn anything new about the system’s work, then it’s probably time to freshen up. Two actual questions for this moment: what hypotheses have you already tested and what hypothesis are you testing now.
This algorithm agrees very well with the debugging rules that we talked about above: repeat the error - this is your bug, describe the problem - understand the system, formulate a hypothesis - divide and conquer, test the hypothesis - check the plug, make sure that it is fixed - five why.
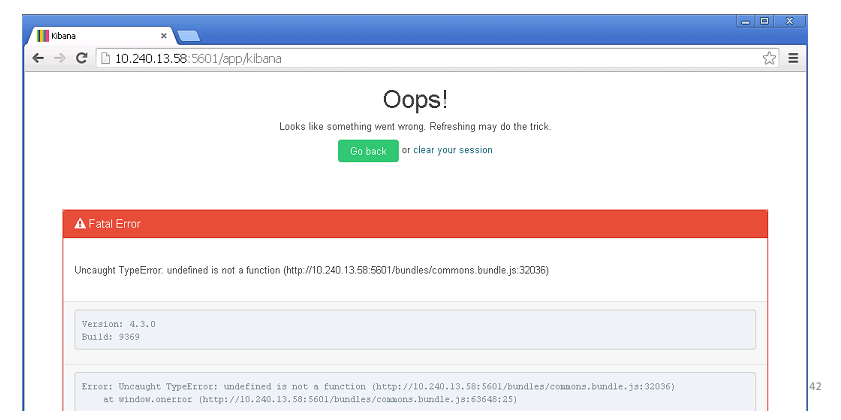
For this algorithm, I have a good example. On one of our web services, there was an exception.
Our first thought is not our problem. But according to the rules, this is still our problem.
First, we repeat the mistake. For every thousand requests about one
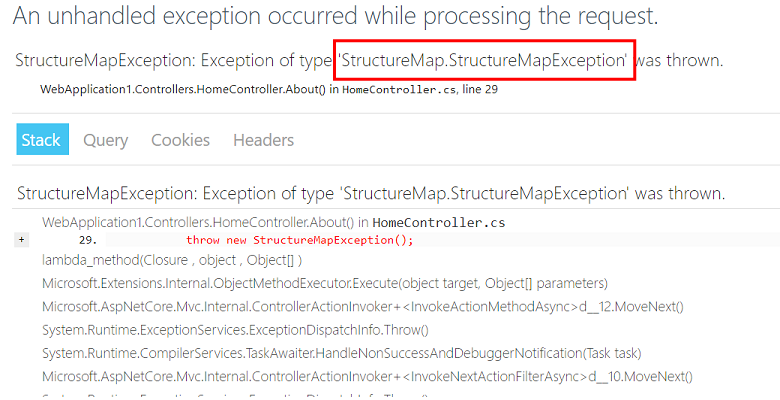
Secondly, we try to describe the problem: if the user makes an http request to our service at the moment when StructureMap tries to make a new dependency, then an exception occurs.
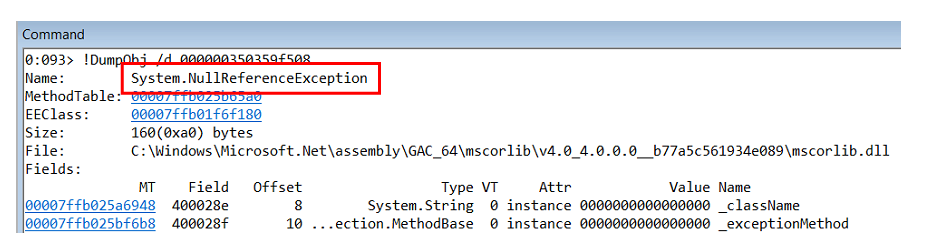
Thirdly, we hypothesize that StructureMap is a wrapper and there is something inside that throws an internal exception. We test the hypothesis using procdump.exe.
It turns out that inside lies
Exploring the call-stack of this exception, we understand that it occurs inside the object-builder in StructureMap itself.
But
We put forward the following hypothesis: for some reason, our code returns the null dependency. Considering that in .Net all objects in memory are located one by one, if we look at the objects in the heap that lie before
In WinDbg a team - a List the Objects in Near:
In this code, we first check whether there is a value in
In theory, this code can never return null. But the problem here is in
The root of the problem is found, we have updated to the latest version of StructureMap, we are sure, we are convinced that everything has been fixed. The last step of our algorithm is “learn and tell”. In our case, it was a search in the code of all
So, the debugging algorithm is an intuitive algorithm that significantly saves time. He focuses on the hypothesis - and this is the most important thing in debugging.
At its core, proactive debugging answers the question “what happens when a bug appears”.
The importance of proactive debugging techniques can be seen in the bug life cycle diagram.
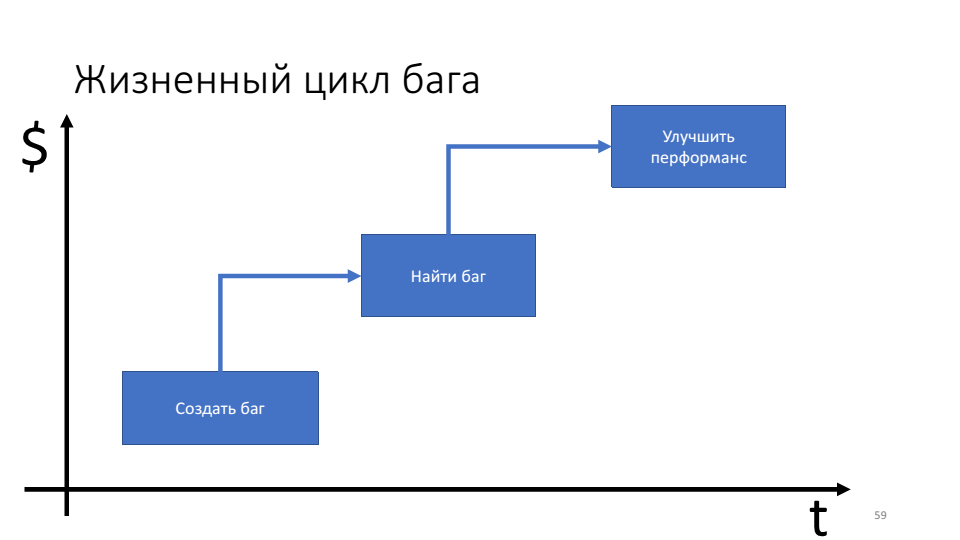
The problem is that the longer the bug lives, the more resources (time) we spend on it.
The debugging rules and the debugging algorithm focus us on the moment when the bug is found and we can think of what to do next. In fact, we want to shift our focus at the time of the creation of the bug. I believe that we should do the Minimum Debuggable Product (MDP), that is, such a product that has the minimum necessary set of infrastructure for efficient debugging in production.
MDP consists of two things: a fitness function and a USE method.
Fitness features. They were popularized by Neil Ford and co-authors in the book “Building Evolutionary Architectures”. At its core, fitness functions, according to the authors of the book, look like this: there is an application architecture that we can cut at different angles, obtaining such architectural properties as maintainability , performance , etc., and for each such cut we must write a test - fitness -function. Thus, the fitness function is a test for architecture.
In the case of MDP, the fitness function is a debuggability check. To write such tests, you can use anything: NUnit, MSTest, and so on. But, since debugging is often work with external tools, I’ll show using Powershell unit testing framework using an example. Its plus here is that it works well with the command line.
For example, inside the company we agree that we will use specific libraries for logging; when logging we will use specific patterns; pdb symbols should always be given to the symbol server. This will be the conventions that we will test in our tests.
This test verifies that all pdb symbols were given to the symbol server and were given correctly, that is, those that contain line numbers inside. To do this, we take the compiled version of the production, find all the exe-and dll-files, skip all these binaries through the utility syschk.exe, which is included in the package "Debugging tools for windows". The syschk.exe utility checks the binary with the symbol server and, if it finds a pdb file, prints a report about it. In the report we are looking for the string "Line numbers: TRUE". And in the final check that the result was not "null or empty".
Such tests must be built into the continuous deployment pipeline. After having passed the integration tests and unit tests, the fitness functions are launched.
I will show another example of checking the necessary libraries in the code.
In the test, we take all the packages.config files and try to find the nlog libraries in them. Similarly, we can verify that the correlation id field is used inside the nlog field.
USE methods. The last thing MDP consists of is the metrics that need to be collected.
I will demonstrate with the example of the USE method, which was popularized by Brendan Gregg. The idea is simple: if there is any problem in the code, it is enough to take three metrics: utilization (use), saturation (saturation), errors (errors), which will help you understand where the problem is.
Some companies, such as Circonus (they make monitoring soft), build their dashboards in the form of designated metrics.
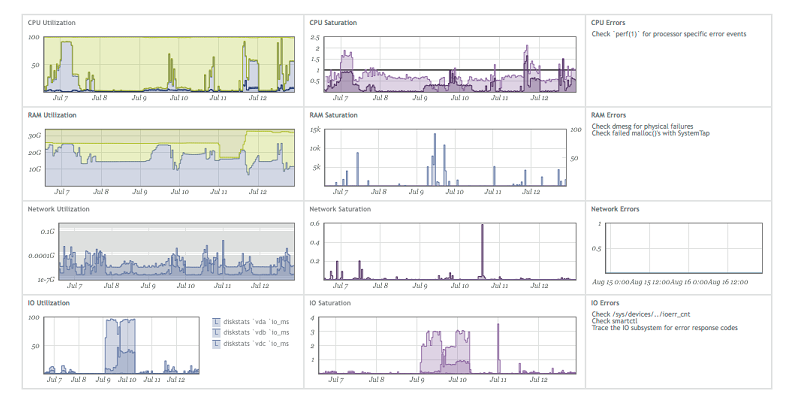
If you look in detail, for example, in memory, then use is the amount of free memory, saturation is the number of disk accesses, errors are any errors that have appeared. Therefore, to make products that are convenient for debugging, you need to collect USE metrics for all features and all parts of the subsystem.
If you take any business feature, then, most likely, it can be divided into three metrics:
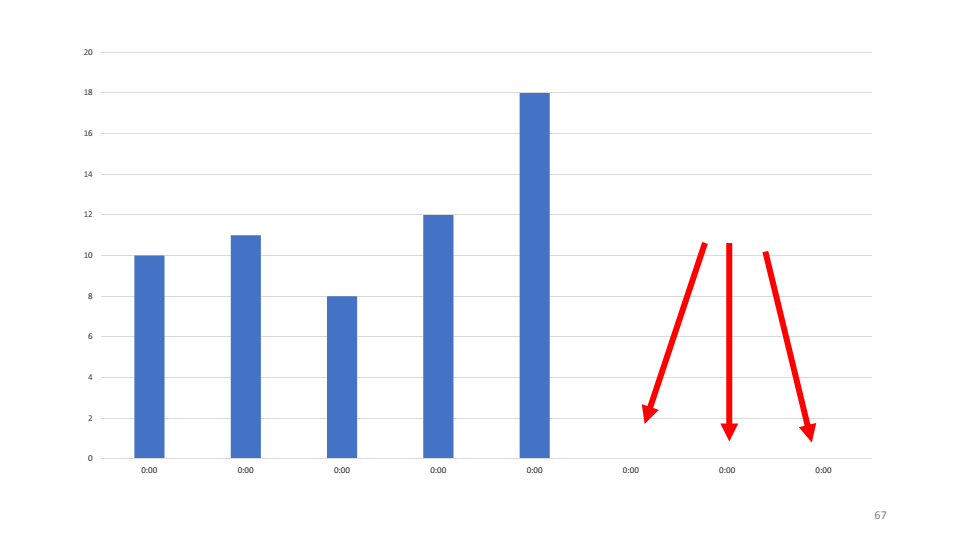
As an example, let's look at the graph of the number of processed requests that one of our systems makes. As you can see, the last three hours the service did not process requests.
The first hypothesis that we have done is that the service has dropped and we need to restart it. When checking it turns out that the service is working, it uses 4-5% CPU.
The second hypothesis is that an error falls inside the service that we do not see. Let's use the etrace utility.
The utility allows you to subscribe to real-time ETW-events and display them on the screen.
See that falls
The following hypothesis - someone eats all the memory. According to the memory dump, the most objects are in the cache.
From the code it is clear that every hour the cache should be cleared. But the memory was not enough, they did not even reach the cleaning. Let's look at an example of the USE cache metric.
The graph immediately shows that the memory has increased, errors immediately began.
So, the conclusions about what proactive debugging is.
This time our sponsor is Jon Skeet. Even if you are not going to Moscow for a new DotNext , the video is worth watching (John tried very hard).
Thus, the optimization and systematization of the debugging process can bring significant benefits in the form of man-hours saved, increasing the speed of solving problems and, ultimately, increasing the loyalty of your users.
Sergey Schegrikovich (dotmailer) at the DotNext 2018 conference Piter suggested looking at debugging as a process that can be described and optimized. If you still do not have a clear search plan for bugs - under the cut video and text interpretation of the report of Sergey.
(And at the end of the post, we added the appeal of John Skit to all the workers, be sure to take a look)
My goal is to answer the question: how to fix bugs effectively and what should be the focus. I think the answer to this question is a process. The process of debugging, which consists of very simple rules, and you know them well, but probably use them unconsciously. Therefore, my task is to systematize them and by example show how to become more effective.
We will develop a common language of communication during debugging, as well as see a direct path to finding the main problems. In my examples, I will show what happened because of a violation of these rules.
Debugging Utilities
Of course, any debugging is impossible without debugging utilities. My favorites are:
- Windbg , which in addition to the debugger itself, has a rich functionality for studying memory dumps. A memory dump is a slice of the process state. In it you can find the value of the fields of objects, call-stack, but, unfortunately, the memory dump is static.
- PerfView is a profiler written on top of ETW technology .
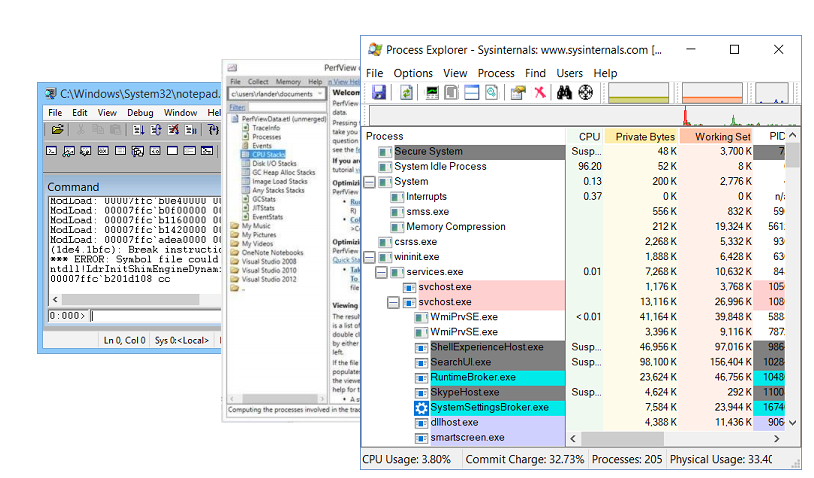
- Sysinternals is a utility written by Mark Russinovich , which allows you to dig a little further into the device of the operating system.
Falling service
Let's start with an example from my life in which I will show how the haphazardness of the debugging process leads to inefficiency.
Probably everybody has such a thing when you come to a new company in a new team for a new project, from the very first day you want to inflict irreparable benefits. So it was with me. At that time, we had a service that took html to the input, and issued pictures to the output.
The service was written under .Net 3.0 and it was a long time ago. This service had a small feature - it fell. Fell often, about once every two to three hours. We fixed it elegantly - put it in the properties of the restart service after the fall.
The service was not critical for us and we could survive it. But I joined the project and the first thing I decided to do was fix it.
Where do .NET developers go if something doesn't work? They go to the EventViewer. But there I did not find anything, except the record that the service fell. There were no native bug reports, no call stack.
There is a proven tool to do next - we wrap the whole
mainin try-catch.try {
ProcessRequest();
} catch (Exception ex) {
LogError(ex);
}
The idea is simple: it
try-catchwill work, it will log us a mistake, we will read it and fix the service. We compile, deploy to production, service drops, there is no error. Add one more catch.try {
ProcessRequest();
} catch (Exception ex) {
LogError(ex);
} catch {
LogError();
}
We repeat the process: the service crashes, there are no errors in the logs. The last thing that can help is
finallyalways being called.try {
ProcessRequest();
} catch (Exception ex) {
LogError(ex);
} catch {
LogError();
} finally {
LogEndOfExecution();
}
We compile, deploy, the service crashes, there are no errors. Three days pass behind this process, now the thought is coming that we should finally start thinking and doing something else. You can do a lot of things: try to reproduce the error on the local machine, watch memory dumps and so on. It seemed another two days and I would fix this bug ...
Two weeks passed.
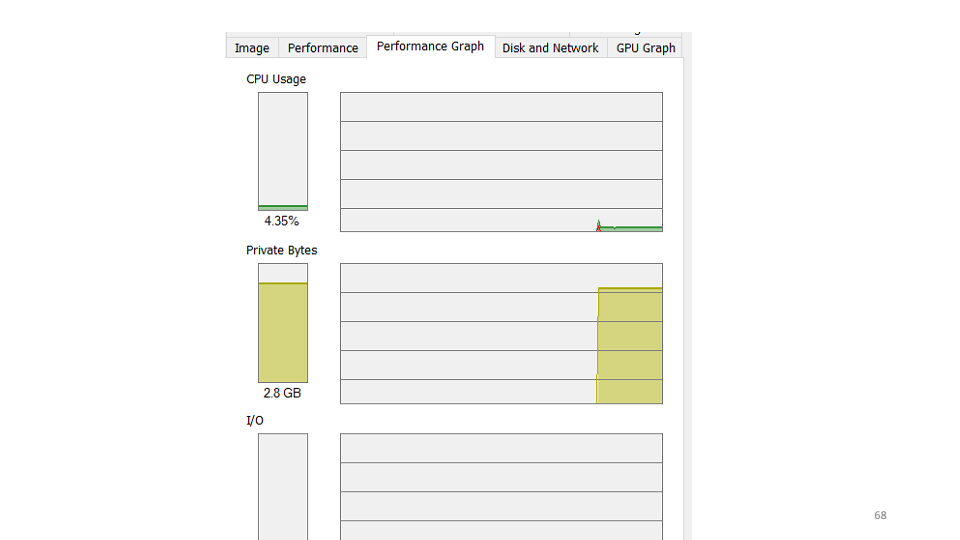
I looked in PerformanceMonitor, where I saw a service that crashes, then rises, then crashes again. This state is called despair and looks like this:
In this variety of tags you are trying to understand, where is the problem really? After several hours of meditation, the problem suddenly shows up:
The red line is the number of native handles owned by the process. A native handle is a link to an operating system resource: file, registry, registry key, mutex, and so on. For some strange coincidence, the fall in the growth of the number of handles coincides with the moments of the drop in service. This suggests that there is a handle leak somewhere.
We take a memory dump, open it in WinDbg. We start to execute commands. Let's try to look at the queue of finalizing those objects that should be released by the application.
0:000> !FinalizeQueue
At the very end of the list, I found a web browser.
The solution is simple - take WebBrowser and call for it
dispose:privatevoidProcess() {
using (var webBrowser = new WebBrowser()) {
// Processing
...
}
}
The conclusions from this story can be drawn as follows: two weeks is a long and too long time to find an uncalled
dispose; The fact that we have found a solution to the problem is luck, since there was not any particular approach, there was no systematic approach. After that, I had a question: how to debug effectively and what to do?
To do this, you need to know all three things:
- Debugging rules
- Algorithm for finding errors.
- Proactive debugging techniques.
Debugging rules
- Repeat the error.
- If you have not corrected the error, then it is not corrected.
- Understand the system.
- Check the plug.
- Divide and rule.
- Freshen up
- This is your bug.
- Five why.
These are fairly clear rules that describe themselves.
Repeat the error. Very simple rule, because if you can not repeat the error, then perhaps there is nothing to fix. But there are different cases, especially for bugs in a multi-threaded environment. We somehow had a mistake that appeared only on Itanium processors and only on production servers. Therefore, the first task in the debugging process is to find a test bench configuration on which the error would be reproduced.
If you have not corrected the error, then it is not corrected. Sometimes it happens like this: there is a bug in the bug tracker that appeared half a year ago, no one has seen it for a long time, and there is a desire to just close it. But at this moment we miss the chance for knowledge, the chance to understand how our system works and what really happens to it. Therefore, any bug is a new opportunity to learn something, to learn more about your system.
Understand the system. Brian Kernigan said once that if we were so smart to write this system, then we need to be doubly smart to debug it.
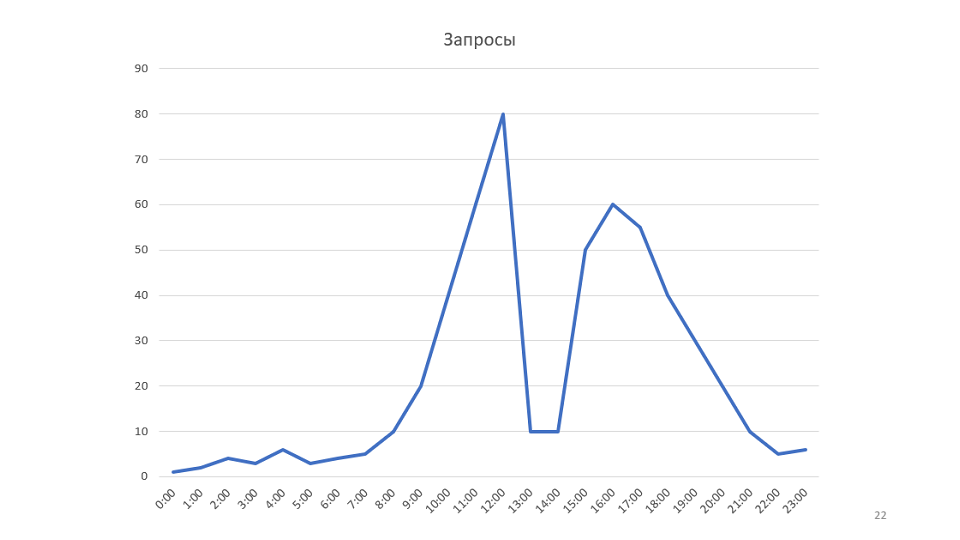
A small example to the rule. Our monitoring draws graphics:
This is a graph of the number of requests processed by our service. Once looking at it, we came up with the idea that it would be possible to increase the speed of the service. In this case, the graph will rise, it may be possible to reduce the number of servers.
Optimization of web-performance is done simply: we take PerfView, we start it on the production machine, it removes the trace within 3-4 minutes, we take this trace to the local machine and begin to study it.
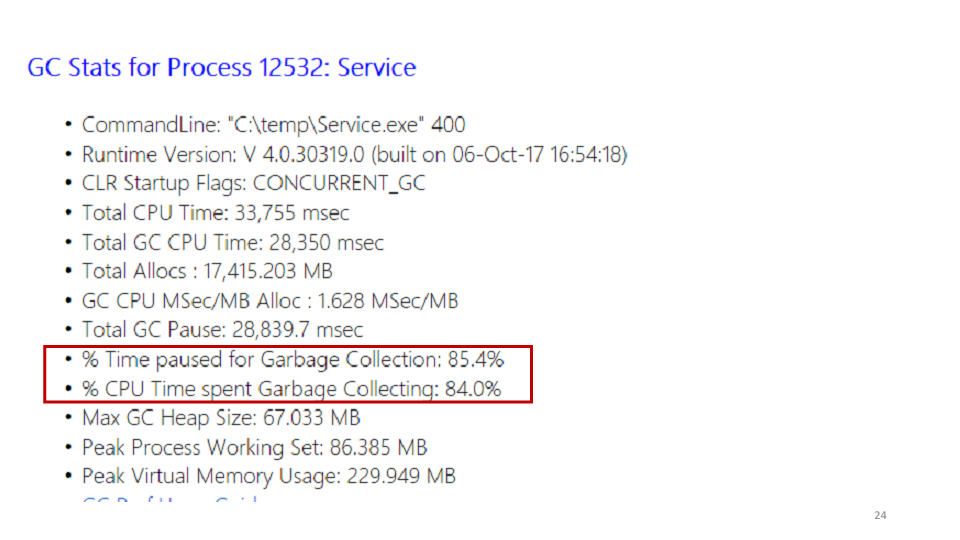
One of the statistics PerfView shows is the garbage collector.
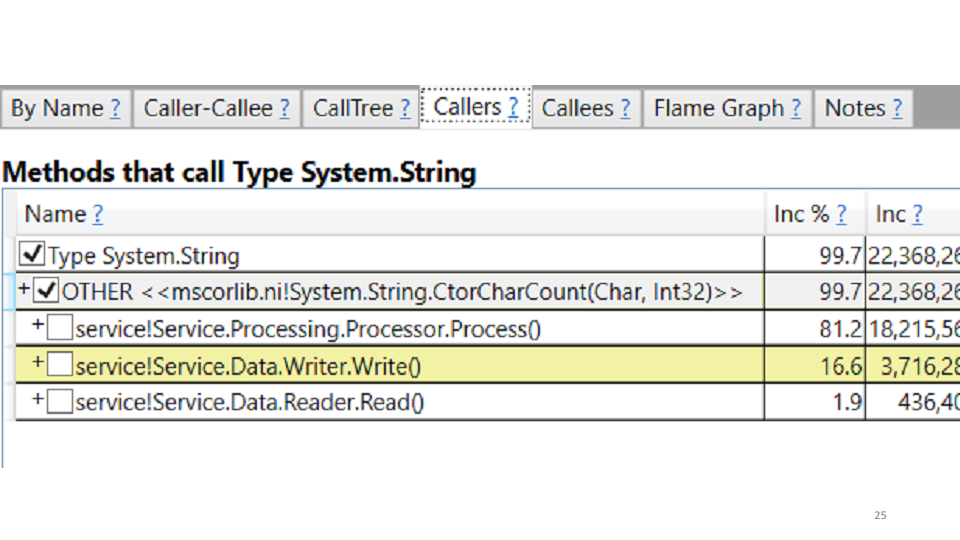
Looking at these statistics, we saw that the service spends 85% of its time on garbage collection. You can see in PerfView exactly where this time is spent.
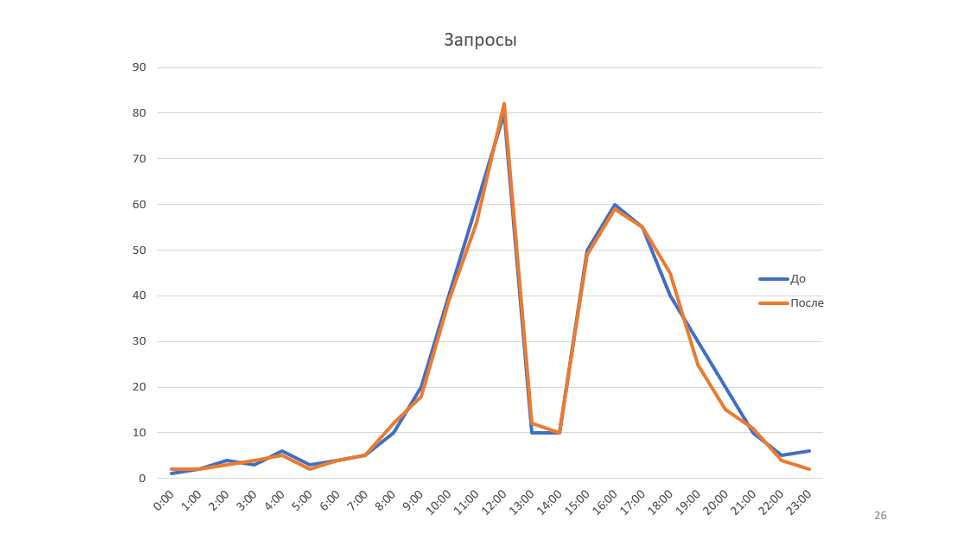
In our case, this is the creation of strings. The correction suggests itself: we replace all strings with StringBuilders. Locally we get a performance boost of 20-30%. Deploy to production, we look at the results in comparison with the old schedule:
The rule “Understand the system” is not only about understanding how interactions occur in your system, how messages go, but about trying to model your system.
In the example, the graph shows the bandwidth. But if you look at the whole system from the point of view of queuing theory, it turns out that the throughput of our system depends on only one parameter - on the rate at which new messages arrive. In fact, the system simply did not have more than 80 messages at a time, so optimizing this schedule will not work.
Check the plug. If you open the documentation of any home appliance, then it will surely be written there: if the appliance does not work, check that the plug is plugged in. After several hours in the debugger, I often find myself thinking that I just had to recompile it, or simply pick up the latest version.
The rule “check plug” is about facts and data. Debugging does not start with running WinDbg or PerfView on production machines; it starts with checking facts and data. If the service does not respond, maybe it just is not running.
Divide and rule. This is the first and probably the only rule that includes debugging as a process. It is about hypotheses, their nomination and verification.
One of our services did not want to stop.
We make a hypothesis: perhaps in the project there is a cycle that processes something endlessly.
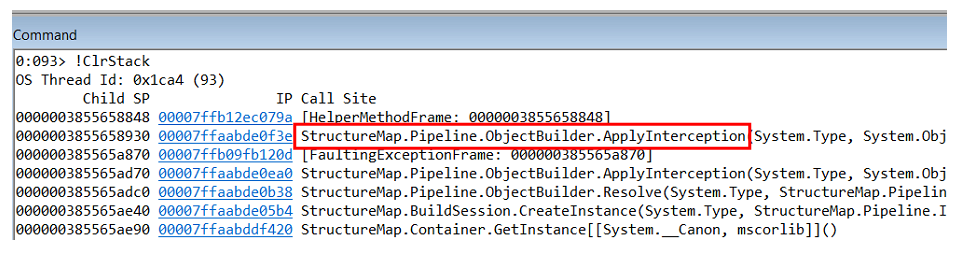
You can test the hypothesis in different ways, one of the options is to take a memory dump. From the dump, we pull out the call-stack and all threads using the command
~*e!ClrStack. We start to look and see three streams. The first thread is in the Main, the second is in the handler
OnStop(), and the third thread is waiting for some internal tasks. Thus, our hypothesis is not justified. There is no looping, all threads are waiting for something. Most likely, deadlock. Our service works as follows. There are two tasks - initialization and working. The initialization opens the connection to the database, the worker starts processing the data. The connection between them occurs through a common flag, which is implemented using
TaskCompletionSource.We make the second hypothesis: perhaps we have a deadlock of one task to the second. To check this, you can view each task separately through WinDbg.
It turns out that one of the tasks fell, and the second did not. In the project we saw the following code:
await openAsync();
_initLock.SetResult(true);
It means that the initialization task opens a connection and then sets it
TaskCompletionSourceto true. And what if Exception falls here? Then we do not have time to set it SetResultto true, so the fix to this bug was this:try {
await openAsync();
_initLock.SetResult(true);
} catch(Exception ex) {
_initLock.SetException(ex);
}
In this example, we put forward two hypotheses: about an infinite loop and about deadlock. The rule "divide and conquer" helps to localize the error. By successive approximations, such problems are solved.
The most important thing about this rule is hypotheses, because over time they turn into patterns. And depending on the hypothesis, we apply different actions.
Freshen up This rule is that you just need to get up from the table and walk, drink water, juice or coffee, do anything, but most importantly - to distract from their problems.
There is a very good method called "duck". According to the method, we must tell our duckwork about the problem . As a duckYou can use a colleague. Moreover, he does not have to answer, it is enough to listen and agree. And often, after the first problems are discussed, you yourself find a solution.
This is your bug. I will tell about this rule on an example.
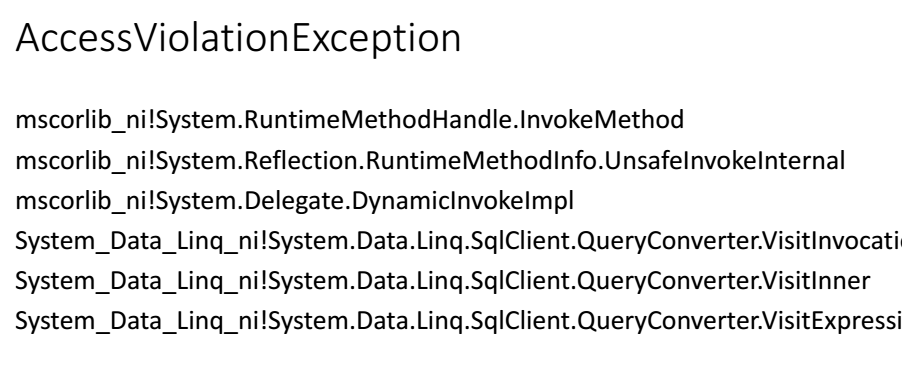
There was a problem in one
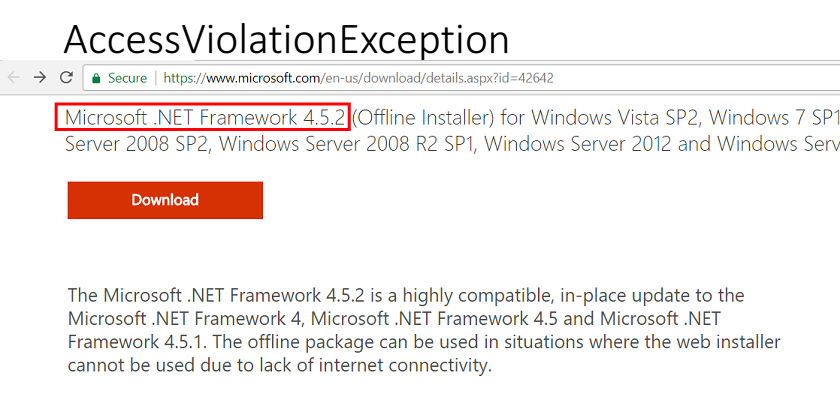
AccessViolationException. Looking in the call-stack, I saw that it arose when we generated a LinqToSql query inside the sql client. For this bug it was clear that the integrity of the memory was violated somewhere. Fortunately, at that time we already used the change management system. In the end, after a couple of hours, it became clear what happened: we put .Net 4.5.2 on our production machines.
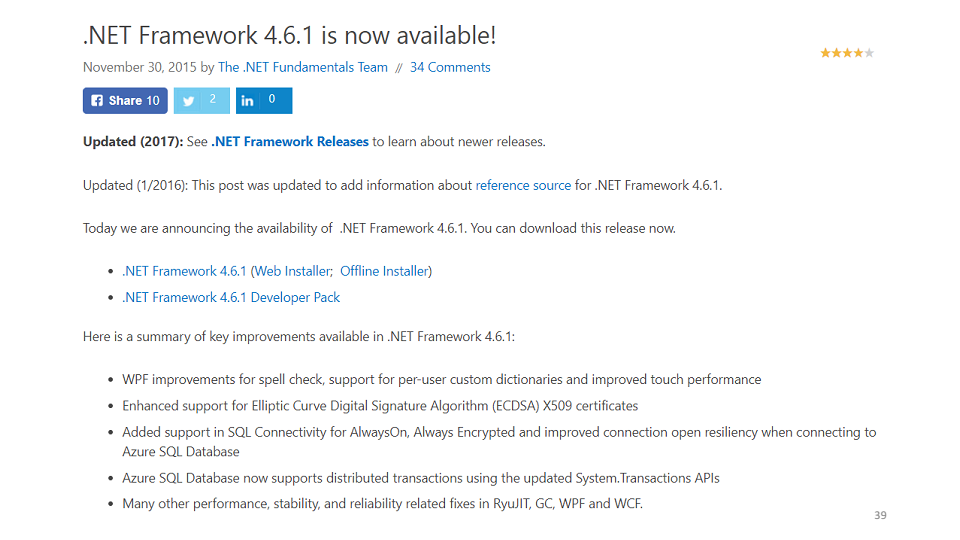
Accordingly, we send a bug to Microsoft, they review it, we communicate with them, they fix the bug in .Net 4.6.1.
For me, this resulted in 11 months of work with Microsoft support, of course, not daily, but just 11 months passed from start to fix. In addition, we sent them dozens of gigabytes of memory dumps, we put hundreds of private builds to catch this error. And all this time, we could not tell our customers that Microsoft was to blame, not us. Therefore, the bug is always yours.
Five why. We use Elastic in our company. Elastic is good for log aggregation.
You come to work in the morning, and Elastic lies.
The first question is why does Elastic lie? Almost immediately it became clear - Master Nodes fell. They coordinate the work of the entire cluster and, when they fall, the entire cluster stops responding. Why didn't they get up? Probably should be autostart? Looking for an answer, found - does not match the version of the plugin. Why did Master Nodes fall at all? OOM Killer killed them. This is such a thing on linux-machines that, in the event of a shortage of memory, closes unnecessary processes. Why is there not enough memory? Because the update process started, which follows from the system logs. Why did it work before, but not now? But because we added new nodes a week earlier, accordingly, Master Nodes took more memory to store indexes and cluster configurations.
Questions "why?" Help find the root of the problem. In the example, we could turn away from the correct path many times, but the full fix looks like this: updating the plugin, starting services, increasing memory and making a note for the future, that next time, when adding new nodes to the cluster, you need to make sure that the Master has enough memory Nodes.
Applying these rules reveals real problems, shifts your focus to solving these problems, and helps you communicate. But it would be even better if these rules formed the system. And there is such a system, it is called a debugging algorithm.
Debugging algorithm
I first read about the debugging algorithm in John Robbins’s book Debugging Applications. It describes the debugging process as follows:
This algorithm is useful for its internal cycle - working with a hypothesis.
With each turn of the cycle, we can check ourselves: do we know more about the system or not? If we put forward hypotheses, check them, they don’t work, we don’t learn anything new about the system’s work, then it’s probably time to freshen up. Two actual questions for this moment: what hypotheses have you already tested and what hypothesis are you testing now.
This algorithm agrees very well with the debugging rules that we talked about above: repeat the error - this is your bug, describe the problem - understand the system, formulate a hypothesis - divide and conquer, test the hypothesis - check the plug, make sure that it is fixed - five why.
For this algorithm, I have a good example. On one of our web services, there was an exception.
Our first thought is not our problem. But according to the rules, this is still our problem.
First, we repeat the mistake. For every thousand requests about one
StructureMapException, so we can reproduce the problem. Secondly, we try to describe the problem: if the user makes an http request to our service at the moment when StructureMap tries to make a new dependency, then an exception occurs.
Thirdly, we hypothesize that StructureMap is a wrapper and there is something inside that throws an internal exception. We test the hypothesis using procdump.exe.
procdump.exe-ma-e-fStructureMapw3wp.exeIt turns out that inside lies
NullReferenceException. Exploring the call-stack of this exception, we understand that it occurs inside the object-builder in StructureMap itself.
But
NullReferenceException- this is not the problem itself, but a consequence. You need to understand where it occurs and who generates it. We put forward the following hypothesis: for some reason, our code returns the null dependency. Considering that in .Net all objects in memory are located one by one, if we look at the objects in the heap that lie before
NullReferenceException, they may indicate to us the code that generated the exception. In WinDbg a team - a List the Objects in Near:
!lno. It shows that an object of interest to us is a lambda function, which is used in the following code.public CompoundInterceptor FindInterceptor(Type type) {
CompoundInterceptop interceptor;
if (!_analyzedInterceptors.TryGetValue(type, out interceptor)) {
lock (_locker) {
if (!_analyzedInterceptors.TryGetValue(type, out interceptor)) {
var interceptorArray = _interceptors.FindAll(i => i.MatchesType(type));
interceptor = new CompoundInterceptor(interceptorArray);
_analyzedInterceptors.Add(type, interceptor);
}
}
}
return interceptor;
}
In this code, we first check whether there is a value in
Dictionaryin _analyzedInterceptors, if we do not find it, then we lockadd a new value inside . In theory, this code can never return null. But the problem here is in
_analyzedInterceptors, which uses the usual Dictionaryin a multi-threaded environment, and not ConcurrentDictionary. The root of the problem is found, we have updated to the latest version of StructureMap, we are sure, we are convinced that everything has been fixed. The last step of our algorithm is “learn and tell”. In our case, it was a search in the code of all
Dictionarythat are used in the lock and checking that all of them are used correctly. So, the debugging algorithm is an intuitive algorithm that significantly saves time. He focuses on the hypothesis - and this is the most important thing in debugging.
Proactive debugging
At its core, proactive debugging answers the question “what happens when a bug appears”.
The importance of proactive debugging techniques can be seen in the bug life cycle diagram.
The problem is that the longer the bug lives, the more resources (time) we spend on it.
The debugging rules and the debugging algorithm focus us on the moment when the bug is found and we can think of what to do next. In fact, we want to shift our focus at the time of the creation of the bug. I believe that we should do the Minimum Debuggable Product (MDP), that is, such a product that has the minimum necessary set of infrastructure for efficient debugging in production.
MDP consists of two things: a fitness function and a USE method.
Fitness features. They were popularized by Neil Ford and co-authors in the book “Building Evolutionary Architectures”. At its core, fitness functions, according to the authors of the book, look like this: there is an application architecture that we can cut at different angles, obtaining such architectural properties as maintainability , performance , etc., and for each such cut we must write a test - fitness -function. Thus, the fitness function is a test for architecture.
In the case of MDP, the fitness function is a debuggability check. To write such tests, you can use anything: NUnit, MSTest, and so on. But, since debugging is often work with external tools, I’ll show using Powershell unit testing framework using an example. Its plus here is that it works well with the command line.
For example, inside the company we agree that we will use specific libraries for logging; when logging we will use specific patterns; pdb symbols should always be given to the symbol server. This will be the conventions that we will test in our tests.
Describe 'Debuggability’ {
It 'Contains line numbers in PDBs’ {
Get-ChildItem -Path . -Recurse -Include @("*.exe", "*. dll ") `
| ForEach-Object { &symchk.exe /v "$_" /s "\\network\" *>&1 } `
| Where-Object { $_ -like "*Line nubmers: TRUE*" } `
| Should -Not –BeNullOrEmpty
}
}
This test verifies that all pdb symbols were given to the symbol server and were given correctly, that is, those that contain line numbers inside. To do this, we take the compiled version of the production, find all the exe-and dll-files, skip all these binaries through the utility syschk.exe, which is included in the package "Debugging tools for windows". The syschk.exe utility checks the binary with the symbol server and, if it finds a pdb file, prints a report about it. In the report we are looking for the string "Line numbers: TRUE". And in the final check that the result was not "null or empty".
Such tests must be built into the continuous deployment pipeline. After having passed the integration tests and unit tests, the fitness functions are launched.
I will show another example of checking the necessary libraries in the code.
Describe 'Debuggability’ {
It 'Contains package for logging’ {
Get-ChildItem -Path . -Recurse -Name "packages.config" `
| ForEach-Object { Get-Content "$_" } `
| Where-Object { $_ -like "*nlog*" } `
| Should -Not –BeNullOrEmpty
}
}
In the test, we take all the packages.config files and try to find the nlog libraries in them. Similarly, we can verify that the correlation id field is used inside the nlog field.
USE methods. The last thing MDP consists of is the metrics that need to be collected.
I will demonstrate with the example of the USE method, which was popularized by Brendan Gregg. The idea is simple: if there is any problem in the code, it is enough to take three metrics: utilization (use), saturation (saturation), errors (errors), which will help you understand where the problem is.
Some companies, such as Circonus (they make monitoring soft), build their dashboards in the form of designated metrics.
If you look in detail, for example, in memory, then use is the amount of free memory, saturation is the number of disk accesses, errors are any errors that have appeared. Therefore, to make products that are convenient for debugging, you need to collect USE metrics for all features and all parts of the subsystem.
If you take any business feature, then, most likely, it can be divided into three metrics:
- Use - request processing time.
- Saturation - the length of the queue.
- Errors - any exceptions.
As an example, let's look at the graph of the number of processed requests that one of our systems makes. As you can see, the last three hours the service did not process requests.
The first hypothesis that we have done is that the service has dropped and we need to restart it. When checking it turns out that the service is working, it uses 4-5% CPU.
The second hypothesis is that an error falls inside the service that we do not see. Let's use the etrace utility.
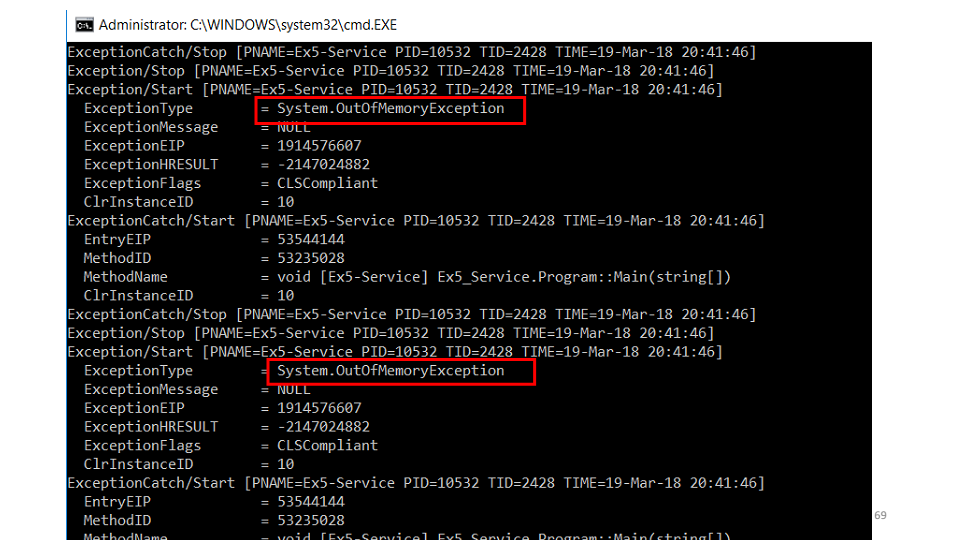
etrace --kernel Process ^--where ProcessName=Ex5-Service ^--clr ExceptionThe utility allows you to subscribe to real-time ETW-events and display them on the screen.
See that falls
OutOfMemoryException. But the second question is, why is it not in the logs? The answer is quickly - we intercept it, try to clean up the memory, wait a bit and start working again.while (ShouldContinue()) {
try {
Do();
} catch (OutOfMemoryException) {
Thread.Sleep(100);
GC.CollectionCount(2);
GC.WaitForPendingFinalizers();
}
}
The following hypothesis - someone eats all the memory. According to the memory dump, the most objects are in the cache.
publicclassCache {
privatestatic ConcurrentDictionary<int, String> _items = new ...
privatestatic DateTime _nextClearTime = DateTime.UtcNow;
public String GetFromCache(int key) {
if (_nextClearTime < DateTime.UtcNow) {
_nextClearTime = DateTime.UtcNow.AddHours(1);
_items.Clear();
}
return _items[key];
}
}
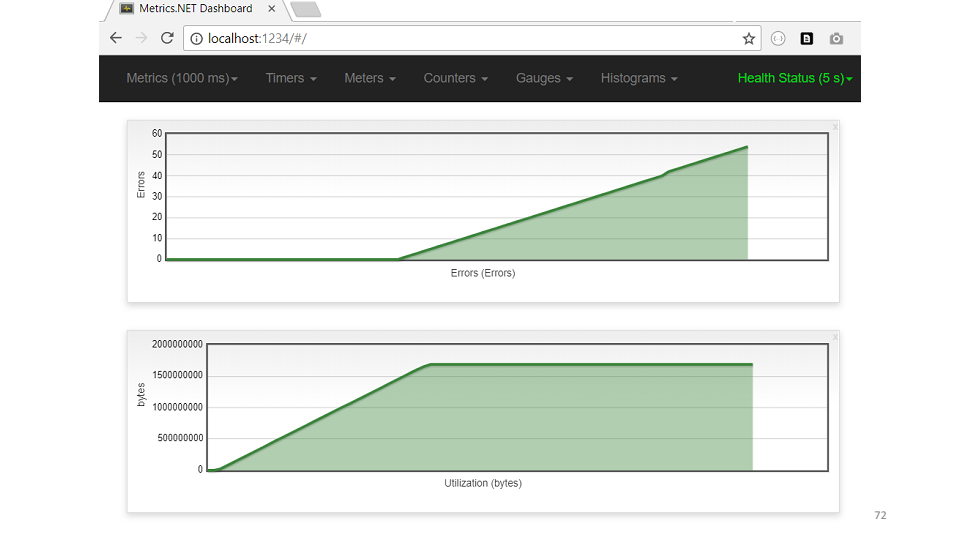
From the code it is clear that every hour the cache should be cleared. But the memory was not enough, they did not even reach the cleaning. Let's look at an example of the USE cache metric.
The graph immediately shows that the memory has increased, errors immediately began.
So, the conclusions about what proactive debugging is.
- Debugging is a requirement for architecture. In essence, what we are developing is a model of how the system works. The system itself is the bytes and bits that are in memory on production servers. Proactive debugging suggests that you need to think about your operating environment.
- Reduce the path of the bug in the system. Proactive debugging techniques include checking all public methods and their arguments; throw Exception immediately, as he appeared, and not to debug to some point, and so on.
- Minimum Debuggable Product is a good tool to communicate with each other and develop product debugging requirements.
So, how to fix bugs effectively?
- Use proactive debugging.
- Follow the algorithm.
- Test hypotheses.
This time our sponsor is Jon Skeet. Even if you are not going to Moscow for a new DotNext , the video is worth watching (John tried very hard).