Anatomy of recommendation systems. Part one
I work as a data scientist at CleverDATA . We are engaged in machine learning projects, and one of the most frequent requests for the development of machine learning-based marketing solutions is the development of recommendatory models.
In this article I will talk about recommender systems, I will try to give the most complete overview of existing approaches and explain the principles of the algorithms on my fingers. Part of the material is based on a good course on recommendation systems of the MovieLens laboratory .(which is familiar to most of them by the same dataset for testing recommendations), the rest is from personal experience. The article consists of two parts. The first describes the formulation of the problem and provides an overview of simple (but popular) recommendation algorithms. In the second article I will talk about more advanced methods and some practical aspects of implementation.
 A source
The task of the recommender system is to inform the user about the product that he may be most interested in at a given time. The client receives information, and the service earns on the provision of quality services. Services are not necessarily direct sales of the goods being offered. The service can also earn commissions or simply increase user loyalty, which then translates into advertising and other income.
Depending on the business model, recommendations may be its basis, such as at TripAdvisor, or it may simply be a convenient additional service (as, for example, in some online clothing store), designed to improve Customer Experience and make navigation through the catalog more comfortable.
Personalization of online marketing is an obvious trend of the last decade. According to McKinsey , 35% of Amazon’s revenue, or 75% of Netflix, comes from recommended products, and this percentage is likely to increase. Recommender systems are about what to offer a client to make him happy.
To illustrate all the variety of recommendation services, I will give a list of basic characteristics with which you can describe any recommendation system.
 Source
At the center of any recommendation system is the so-called preference matrix. This is the matrix, on one of the axes of which all the clients of the service (Users) are laid, and on the other - the recommendation objects (Items). At the intersection of some pairs (user, item), this matrix is filled with ratings (Ratings) - this is a known indicator of user interest in this product, expressed on a given scale (for example, from 1 to 5).

Users usually evaluate only a small part of the goods in the catalog, and the task of the recommender system is to summarize this information and predict the attitude of the client to other goods, about which nothing is known. In other words, you need to fill in all the blank cells in the picture above.
People's consumption patterns are different, and new products do not have to be recommended. You can show repeated positions, for example, to replenish stock. According to this principle, there are two groups of goods.
If the product cannot be clearly attributed to one of the classes, it makes sense to determine the admissibility of repeated purchases individually (someone goes to the store only for a certain brand of peanut butter, and it is important for someone to try everything in the catalog).
The concept of "interesting" is also subjective. Some users need things only from their favorite category (conservative recommendations), and someone, on the contrary, responds more to non-standard products or product groups (risky recommendations). For example, a video hosting service may recommend the user only new series of a favorite series, and may periodically throw new shows on it or new genres in general. Ideally, you should choose a strategy for displaying recommendations for each client separately, using modeling the client category.
User ratings can be obtained in two ways:
Of course, explicit preferences are better - the user himself says that he liked it. However, in practice, not all sites provide an opportunity to clearly express their interest, and not all users have the desire to do so. Both types of assessments are most often used at once and complement each other well.
It is also important to distinguish between the terms Prediction (prediction of the degree of interest) and the Recommendation itself (showing the recommendation). What and how to show is a separate task that uses the estimates obtained in the Prediction step, but can be implemented in different ways.
Sometimes the term “recommendation” is used in a wider sense and means any optimization, whether it is selection of clients for advertising distribution, determination of the optimal offer price, or simply selection of the best communication strategy with the client. In the article I will limit myself to the classical definition of this term, denoting the choice of the most interesting product for the client.
Let's start with non-personalized recommendations, as they are the easiest to implement. In them, the potential interest of the user is determined simply by the average product rating: “Everybody likes it - it means that you will like it too.” According to this principle, most services work when the user is not authorized in the system, for example, the same TripAdvisor.
Recommendations can be shown differently - as a banner on the side of the product description (Amazon), as a result of a request, sorted by a certain parameter (TripAdvisor), or something else.
Product rating can also be depicted in different ways. These can be asterisks next to the product, the number of likes, the difference between positive and negative votes (as is usually done on forums), the proportion of high marks, or even a histogram of marks. Histograms are the most informative method, but they have one drawback - they are difficult to compare with each other or sort when you need to display the goods in a list.

A cold start is a typical situation when a sufficient amount of data has not yet been accumulated for the correct operation of the recommender system (for example, when a product is new or just rarely is bought). If the average rating is estimated by the estimates of only three users (igor92, xyz_111 and oleg_s), such an estimate will clearly not be reliable, and users understand this. Often in such situations, ratings are artificially adjusted.
The first way is to show not the average value, but the smoothed average (Damped Mean). The point is this: with a small number of ratings, the displayed rating is more to a certain safe “average” indicator, and as soon as a sufficient number of new ratings are typed, the “averaging” adjustment ceases to operate.
Another approach is to calculate confidence intervals for each rating. Mathematically, the more estimates, the smaller the variation of the average and, therefore, more confidence in its correctness. And as a rating, you can display, for example, the lower limit of the interval (Low CI Bound). At the same time, it is clear that such a system will be quite conservative, with a tendency to underestimate estimates for new products (if, of course, this is not a hit).
Since the estimates are limited to a certain scale (for example, from 0 to 1), the usual method of calculating the confidence interval is poorly applicable here: because of the distribution tails that go to infinity and the symmetry of the interval itself. There is an alternative and more accurate way to calculate it - Wilson Confidence Interval. At the same time asymmetrical intervals of approximately this type are obtained.

The picture above shows a horizontal average of the rating, and a vertical scatter around the average. The color indicates different sample sizes (obviously, the larger the sample, the smaller the confidence interval).
The cold start problem is just as relevant for non-personalized recommendations. The general approach here is to replace what currently cannot be calculated by different heuristics (for example, replace it with an average rating, use a simpler algorithm, or not use the product at all until the data is collected).
In some cases it is also important to consider the “freshness” of the recommendation. This is especially true for articles or posts on forums. Fresh entries should often get to the top. To do this, use correction factors (damping factors). Below are a couple of formulas for calculating the rating of articles on media sites.
An example of rating calculation in the Hacker news magazine:
 where U = upvotes, D = downvotes, and P (Penalty) - an additional adjustment for the implementation of other business rules
Calculate the rating in Reddit:
 where U = number of votes "for", D = number of votes "against", T = recording time. The first item assesses the “quality of the recording”, and the second makes a correction for the time.
Obviously, there is no universal formula, and each service invents the formula that best solves its problem — it is empirically tested.
Personal recommendations suggest the maximum use of information about the user himself, primarily about his previous purchases. One of the first to emerge is content-based filtering. In the framework of this approach, the description of the product (content) is compared with the interests of the user, obtained from his previous assessments. The more the product meets these interests, the higher the potential interest of the user is estimated. The obvious requirement here is that all products in the catalog should have a description.
Historically, the subject of Content-based recommendations were more often products with unstructured descriptions: films, books, articles. Such signs may be, for example, text descriptions, reviews, cast, and so on. However, nothing prevents the use of ordinary numerical or categorical features.
Unstructured signs are described in a text-typical way - vectors in the space of words ( Vector-Space model ). Each element of such a vector is a sign that potentially characterizes the interest of the user. Similarly, a product is a vector in the same space.
As the user interacts with the system (say, he buys films), the vector descriptions of the goods he purchased merge (sum up and normalize) into a single vector and, thus, form the vector of his interests. Further, it suffices to find a product whose description is closest to the vector of interests, i.e Solve the problem of finding n closest neighbors.
Not all elements are equally significant: for example, allied words obviously do not carry any payload. Therefore, when determining the number of coinciding elements in two vectors, all dimensions must be weighted by their significance. This task is solved by the well-known TF-IDF transformation in Text Mining , which assigns more weight to more rare interests. The coincidence of such interests is more important in determining the proximity of two vectors than the coincidence of the popular ones.

The principle of TF-IDF here is equally applicable to ordinary nominal attributes, such as, for example, genre, director, language. TF is a measure of the significance of an attribute for a user; IDF is a measure of the “rarity” of an attribute.
There is a whole family of similar transformations (for example, BM25 and similar), but they all meaningfully repeat the same logic as TF-IDF: rare attributes should have more weight when comparing products. The picture below illustrates exactly how the weight of the TF-IDF depends on the TF and IDF values. The near horizontal axis is DF: the frequency of the attribute among all the goods, the far horizontal axis is TF: the logarithm of the frequency of the attribute of the user.

Some points that can be considered when implementing.
It can be seen that content-based filtering almost completely repeats the query-document matching mechanism used in search engines like Yandex and Google. The only difference is in the form of a search query - here it is a vector that describes the interests of the user, and there are keywords of the requested document. When search engines began to add personalization, the distinction was erased even more.
The cosine distance is most often used as a measure of proximity of two vectors.

When adding a new assessment, the vector of interests is updated incrementally (only for those elements that have changed). In recalculation, it makes sense to give new estimates a little more weight, since preferences may change.
This class of systems began to actively develop in the 90s. Under the approach, recommendations are generated based on the interests of other similar users. Such recommendations are the result of the “collaboration” of multiple users. Hence the name of the method.
The classic implementation of the algorithm is based on the principle of k nearest neighbors. On the fingers - for each user we look for the k most similar to him (in terms of preferences) and supplement the information about the user with known data on his neighbors. So, for example, if it is known that your neighbors in interest are delighted with the film “Blood and Concrete”, and you have not watched it for some reason, this is an excellent reason to offer you this film for Saturday viewing.

The picture above illustrates the principle of the method. In the preference matrix, the user is highlighted in yellow for which we want to determine the estimates for new products (question marks). Three closest neighbors are highlighted in blue.
“Similarity” is in this case a synonym for “correlation” of interests and can be considered in many ways (besides the Pearson correlation, there is also a cosine distance, there is a Jacquard distance, a Hamming distance, etc.).
The classical implementation of the algorithm has one obvious disadvantage - it is poorly applicable in practice because of the quadratic complexity. Indeed, like any method of the nearest neighbor, it requires the calculation of all pairwise distances between users (and there may be millions of users). It is easy to calculate that the complexity of calculating the distance matrix will beO ( n 2 m ) , where n is the number of users, and m is the number of products. With millions of users, a minimum of 4TB is required to store the matrix of distances in raw form.
This problem can be partly solved by purchasing high-performance iron. But if you approach it wisely, then it is better to introduce corrections into the algorithm:
In order for the algorithm to be effective, it is important that several assumptions be fulfilled.
The neighborhood of the user in the space of preferences (his neighbors), which we will analyze to generate new recommendations, can be chosen in different ways. We can work with all users of the system in general, we can set a certain proximity threshold, we can choose several neighbors at random or take n most similar neighbors (this is the most popular approach).
Authors from MovieLens provide the optimal number of neighbors with figures of 30-50 neighbors for films and 25-100 for arbitrary recommendations. Here it is clear that if we take too many neighbors, we will get more chance of random noise. And vice versa, if we take too little, we will get more accurate recommendations, but fewer goods can be recommended.
An important stage of data preparation is the normalization of estimates.
Since all users evaluate differently - someone puts all fives in a row, and it’s rare for someone to wait for the fours - it’s better to normalize the data before calculating, i.e. lead to a single scale, so that the algorithm can correctly compare them with each other.
Naturally, the predicted estimate will then need to be converted to the original scale by inverse transformation (and, if necessary, rounded to the nearest whole number).
There are several ways to normalize:
“Similarity” or correlation of preferences of two users can be considered in different ways. In fact, we just need to compare two vectors. We list some of the most popular.
An interesting development of the collaborative approach is the so-called Trust-based recommendations, which take into account not only the proximity of people according to their interests, but also their “social” proximity and the degree of trust between them. If, for example, we see that on Facebook a girl occasionally visits a page with her friend’s audio recordings, then she trusts her musical taste. Therefore, in the recommendation of the girl, you can completely mix in new songs from a friend's playlist.

It is important that the user trusted the recommendation system, and for this it should be simple and straightforward. If necessary, a clear explanation of the recommendation should always be available (in English terminology explanation).
As part of the explanation, it is not bad to show the evaluation of the goods by the neighbors, by which attribute (for example, an actor or director) was a coincidence, and also to deduce the confidence of the system in the evaluation (confidence). In order not to overload the interface, you can put all this information into the “Tell me more” button.
For example:
This concludes the first part of the article. We reviewed the general formulation of the problem, talked about non-personal recommendations, described two classical approaches (content-based and collaborative filtering), and also touched upon the rationale for recommendations. In general, these two approaches are quite enough to build a production-ready recommender system. In the next part, I will continue the review and talk about more modern methods, including those involving neural networks and deep learning, as well as about hybrid models.
In this article I will talk about recommender systems, I will try to give the most complete overview of existing approaches and explain the principles of the algorithms on my fingers. Part of the material is based on a good course on recommendation systems of the MovieLens laboratory .(which is familiar to most of them by the same dataset for testing recommendations), the rest is from personal experience. The article consists of two parts. The first describes the formulation of the problem and provides an overview of simple (but popular) recommendation algorithms. In the second article I will talk about more advanced methods and some practical aspects of implementation.
Review and problem statement
The task of the recommender system is to inform the user about the product that he may be most interested in at a given time. The client receives information, and the service earns on the provision of quality services. Services are not necessarily direct sales of the goods being offered. The service can also earn commissions or simply increase user loyalty, which then translates into advertising and other income.
Depending on the business model, recommendations may be its basis, such as at TripAdvisor, or it may simply be a convenient additional service (as, for example, in some online clothing store), designed to improve Customer Experience and make navigation through the catalog more comfortable.
Personalization of online marketing is an obvious trend of the last decade. According to McKinsey , 35% of Amazon’s revenue, or 75% of Netflix, comes from recommended products, and this percentage is likely to increase. Recommender systems are about what to offer a client to make him happy.
To illustrate all the variety of recommendation services, I will give a list of basic characteristics with which you can describe any recommendation system.
- The subject of the recommendation is what is recommended.
There is a big variety here - it can be products (Amazon, Ozon), articles (Arxiv.org), news (Surfingbird, Yandex.Dzen), images (500px), videos (YouTube, Netflix), people (LinkedIn, LonelyPlanet), music (Last.fm, Pandora), playlists and more. In general, you can recommend anything. - The purpose of the recommendation is why it is recommended.
For example: buying, informing, training, making contacts. - The context of the recommendation is what the user is doing at this moment.
For example: looking goods, listening to music, talking to people. - Source of recommendation - who recommends:
- audience (average rating of a restaurant on TripAdvisor),
- users of similar interests,
- expert community (this happens when it comes to a complex product, such as, for example, wine). - Degree of personalization .
Non-personal recommendations - when you recommend the same thing to everyone else. They allow targeting by region or time, but do not take into account your personal preferences.
A more advanced option is when recommendations use data from your current session. You looked at several products, and at the bottom of the page you are offered similar ones.
Personal recommendations use all available information about the client, including the history of his purchases. - Transparency .
People trust the recommendations more if they understand exactly how it was received. So less risk of running into "unscrupulous" systems that promote the paid goods or put more expensive products higher in the rating. In addition, a good recommender system itself should be able to deal with the purchased reviews and salesman’s cheats.
Manipulations by the way are unintentional. For example, when a new blockbuster comes out, the first thing to do is to go to the fans, respectively, the first couple of months the rating can be greatly overestimated. - The format of the recommendation .
This can be a pop-up window, a sorted list appearing in a specific section of the site, a ribbon at the bottom of the screen, or something else. - Algorithms .
Despite the many existing algorithms, they all boil down to a few basic approaches, which will be described later. The most classic are the algorithms Summary-based (non-personal), Content-based (models based on the product description), Collaborative Filtering (collaborative filtering), Matrix Factorization (methods based on matrix decomposition), and some others.
At the center of any recommendation system is the so-called preference matrix. This is the matrix, on one of the axes of which all the clients of the service (Users) are laid, and on the other - the recommendation objects (Items). At the intersection of some pairs (user, item), this matrix is filled with ratings (Ratings) - this is a known indicator of user interest in this product, expressed on a given scale (for example, from 1 to 5).
Users usually evaluate only a small part of the goods in the catalog, and the task of the recommender system is to summarize this information and predict the attitude of the client to other goods, about which nothing is known. In other words, you need to fill in all the blank cells in the picture above.
People's consumption patterns are different, and new products do not have to be recommended. You can show repeated positions, for example, to replenish stock. According to this principle, there are two groups of goods.
- Repeatable . For example, shampoos or razors that are always needed.
- Unrepeatable . For example, books or films that are rarely purchased repeatedly.
If the product cannot be clearly attributed to one of the classes, it makes sense to determine the admissibility of repeated purchases individually (someone goes to the store only for a certain brand of peanut butter, and it is important for someone to try everything in the catalog).
The concept of "interesting" is also subjective. Some users need things only from their favorite category (conservative recommendations), and someone, on the contrary, responds more to non-standard products or product groups (risky recommendations). For example, a video hosting service may recommend the user only new series of a favorite series, and may periodically throw new shows on it or new genres in general. Ideally, you should choose a strategy for displaying recommendations for each client separately, using modeling the client category.
User ratings can be obtained in two ways:
- clearly (explicit ratings) - the user himself puts the rating of the product, leaves a review, likes the page,
- implicitly (implicit ratings) - the user clearly does not express his attitude, but an indirect conclusion can be made from his actions: he bought a product - it means he likes it, reads the description for a long time - it means there is interest, etc.
Of course, explicit preferences are better - the user himself says that he liked it. However, in practice, not all sites provide an opportunity to clearly express their interest, and not all users have the desire to do so. Both types of assessments are most often used at once and complement each other well.
It is also important to distinguish between the terms Prediction (prediction of the degree of interest) and the Recommendation itself (showing the recommendation). What and how to show is a separate task that uses the estimates obtained in the Prediction step, but can be implemented in different ways.
Sometimes the term “recommendation” is used in a wider sense and means any optimization, whether it is selection of clients for advertising distribution, determination of the optimal offer price, or simply selection of the best communication strategy with the client. In the article I will limit myself to the classical definition of this term, denoting the choice of the most interesting product for the client.
Non-personalized recommendations
Let's start with non-personalized recommendations, as they are the easiest to implement. In them, the potential interest of the user is determined simply by the average product rating: “Everybody likes it - it means that you will like it too.” According to this principle, most services work when the user is not authorized in the system, for example, the same TripAdvisor.
Recommendations can be shown differently - as a banner on the side of the product description (Amazon), as a result of a request, sorted by a certain parameter (TripAdvisor), or something else.
Product rating can also be depicted in different ways. These can be asterisks next to the product, the number of likes, the difference between positive and negative votes (as is usually done on forums), the proportion of high marks, or even a histogram of marks. Histograms are the most informative method, but they have one drawback - they are difficult to compare with each other or sort when you need to display the goods in a list.
Cold start problem
A cold start is a typical situation when a sufficient amount of data has not yet been accumulated for the correct operation of the recommender system (for example, when a product is new or just rarely is bought). If the average rating is estimated by the estimates of only three users (igor92, xyz_111 and oleg_s), such an estimate will clearly not be reliable, and users understand this. Often in such situations, ratings are artificially adjusted.
The first way is to show not the average value, but the smoothed average (Damped Mean). The point is this: with a small number of ratings, the displayed rating is more to a certain safe “average” indicator, and as soon as a sufficient number of new ratings are typed, the “averaging” adjustment ceases to operate.
Another approach is to calculate confidence intervals for each rating. Mathematically, the more estimates, the smaller the variation of the average and, therefore, more confidence in its correctness. And as a rating, you can display, for example, the lower limit of the interval (Low CI Bound). At the same time, it is clear that such a system will be quite conservative, with a tendency to underestimate estimates for new products (if, of course, this is not a hit).
Since the estimates are limited to a certain scale (for example, from 0 to 1), the usual method of calculating the confidence interval is poorly applicable here: because of the distribution tails that go to infinity and the symmetry of the interval itself. There is an alternative and more accurate way to calculate it - Wilson Confidence Interval. At the same time asymmetrical intervals of approximately this type are obtained.
The picture above shows a horizontal average of the rating, and a vertical scatter around the average. The color indicates different sample sizes (obviously, the larger the sample, the smaller the confidence interval).
The cold start problem is just as relevant for non-personalized recommendations. The general approach here is to replace what currently cannot be calculated by different heuristics (for example, replace it with an average rating, use a simpler algorithm, or not use the product at all until the data is collected).
Relevance of recommendations
In some cases it is also important to consider the “freshness” of the recommendation. This is especially true for articles or posts on forums. Fresh entries should often get to the top. To do this, use correction factors (damping factors). Below are a couple of formulas for calculating the rating of articles on media sites.
An example of rating calculation in the Hacker news magazine:
Calculate the rating in Reddit:
Obviously, there is no universal formula, and each service invents the formula that best solves its problem — it is empirically tested.
Content-based recommendations
Personal recommendations suggest the maximum use of information about the user himself, primarily about his previous purchases. One of the first to emerge is content-based filtering. In the framework of this approach, the description of the product (content) is compared with the interests of the user, obtained from his previous assessments. The more the product meets these interests, the higher the potential interest of the user is estimated. The obvious requirement here is that all products in the catalog should have a description.
Historically, the subject of Content-based recommendations were more often products with unstructured descriptions: films, books, articles. Such signs may be, for example, text descriptions, reviews, cast, and so on. However, nothing prevents the use of ordinary numerical or categorical features.
Unstructured signs are described in a text-typical way - vectors in the space of words ( Vector-Space model ). Each element of such a vector is a sign that potentially characterizes the interest of the user. Similarly, a product is a vector in the same space.
As the user interacts with the system (say, he buys films), the vector descriptions of the goods he purchased merge (sum up and normalize) into a single vector and, thus, form the vector of his interests. Further, it suffices to find a product whose description is closest to the vector of interests, i.e Solve the problem of finding n closest neighbors.
Not all elements are equally significant: for example, allied words obviously do not carry any payload. Therefore, when determining the number of coinciding elements in two vectors, all dimensions must be weighted by their significance. This task is solved by the well-known TF-IDF transformation in Text Mining , which assigns more weight to more rare interests. The coincidence of such interests is more important in determining the proximity of two vectors than the coincidence of the popular ones.
The principle of TF-IDF here is equally applicable to ordinary nominal attributes, such as, for example, genre, director, language. TF is a measure of the significance of an attribute for a user; IDF is a measure of the “rarity” of an attribute.
There is a whole family of similar transformations (for example, BM25 and similar), but they all meaningfully repeat the same logic as TF-IDF: rare attributes should have more weight when comparing products. The picture below illustrates exactly how the weight of the TF-IDF depends on the TF and IDF values. The near horizontal axis is DF: the frequency of the attribute among all the goods, the far horizontal axis is TF: the logarithm of the frequency of the attribute of the user.
Some points that can be considered when implementing.
- When forming the vector space of product presentation, instead of individual words, you can use shingles or n-grams (successive pairs of words, triples, etc.). This will make the model more detailed, but more data will be required for training.
- In different places of the description of the product, the weight of keywords may differ (for example, the description of the film may consist of a title, a brief description and a detailed description).
- Product descriptions from different users can be weighed differently. For example, we can give more weight to active users who have a lot of ratings.
- Similarly, you can weigh by item. The greater the average rating of an object, the greater its weight (similar to PageRank ).
- If the product description allows links to external sources, then you can get confused and analyze all the third-party information related to the product.
It can be seen that content-based filtering almost completely repeats the query-document matching mechanism used in search engines like Yandex and Google. The only difference is in the form of a search query - here it is a vector that describes the interests of the user, and there are keywords of the requested document. When search engines began to add personalization, the distinction was erased even more.
The cosine distance is most often used as a measure of proximity of two vectors.
When adding a new assessment, the vector of interests is updated incrementally (only for those elements that have changed). In recalculation, it makes sense to give new estimates a little more weight, since preferences may change.
Collaborative filtering (User-based option)
This class of systems began to actively develop in the 90s. Under the approach, recommendations are generated based on the interests of other similar users. Such recommendations are the result of the “collaboration” of multiple users. Hence the name of the method.
The classic implementation of the algorithm is based on the principle of k nearest neighbors. On the fingers - for each user we look for the k most similar to him (in terms of preferences) and supplement the information about the user with known data on his neighbors. So, for example, if it is known that your neighbors in interest are delighted with the film “Blood and Concrete”, and you have not watched it for some reason, this is an excellent reason to offer you this film for Saturday viewing.
The picture above illustrates the principle of the method. In the preference matrix, the user is highlighted in yellow for which we want to determine the estimates for new products (question marks). Three closest neighbors are highlighted in blue.
“Similarity” is in this case a synonym for “correlation” of interests and can be considered in many ways (besides the Pearson correlation, there is also a cosine distance, there is a Jacquard distance, a Hamming distance, etc.).
The classical implementation of the algorithm has one obvious disadvantage - it is poorly applicable in practice because of the quadratic complexity. Indeed, like any method of the nearest neighbor, it requires the calculation of all pairwise distances between users (and there may be millions of users). It is easy to calculate that the complexity of calculating the distance matrix will beO ( n 2 m ) , where n is the number of users, and m is the number of products. With millions of users, a minimum of 4TB is required to store the matrix of distances in raw form.
This problem can be partly solved by purchasing high-performance iron. But if you approach it wisely, then it is better to introduce corrections into the algorithm:
- update the distance not with every purchase, but with batches (for example, once a day),
- do not recalculate the distance matrix completely, but update it incrementally,
- opt for iterative and approximate algorithms (for example, ALS).
In order for the algorithm to be effective, it is important that several assumptions be fulfilled.
- The tastes of people do not change over time (or they change, but they are the same for everyone).
- If people's tastes are the same, then they are the same in everything.
For example, if two clients prefer the same films, then they also like the same book. This is often the case when the recommended products are homogeneous (for example, films only). If this is not the case, then the couple of clients may well have the same eating habits, and the political views will be exactly the opposite - here the algorithm will be less efficient.
The neighborhood of the user in the space of preferences (his neighbors), which we will analyze to generate new recommendations, can be chosen in different ways. We can work with all users of the system in general, we can set a certain proximity threshold, we can choose several neighbors at random or take n most similar neighbors (this is the most popular approach).
Authors from MovieLens provide the optimal number of neighbors with figures of 30-50 neighbors for films and 25-100 for arbitrary recommendations. Here it is clear that if we take too many neighbors, we will get more chance of random noise. And vice versa, if we take too little, we will get more accurate recommendations, but fewer goods can be recommended.
An important stage of data preparation is the normalization of estimates.
Data Standardization (scaling)
Since all users evaluate differently - someone puts all fives in a row, and it’s rare for someone to wait for the fours - it’s better to normalize the data before calculating, i.e. lead to a single scale, so that the algorithm can correctly compare them with each other.
Naturally, the predicted estimate will then need to be converted to the original scale by inverse transformation (and, if necessary, rounded to the nearest whole number).
There are several ways to normalize:
- Centering (mean-centering) - from user ratings we just subtract his average rating,
* relevant only for non-binary matrices - standardization (z-score) - in addition to centering, we divide it by the standard deviation of the user,
* here, after the inverse transformation, the rating can go beyond the scale (for example, 6 on a five-point scale), but such situations are quite rare and they are solved simply by rounding off to the nearest acceptable estimate. - double standardization - for the first time we normalize with user ratings, and the second time with product ratings.
If the film “The Best Movie” has an average rating of 2.5, and the user puts it at 5, then this is a strong factor indicating that such films clearly suit their taste.
“Similarity” or correlation of preferences of two users can be considered in different ways. In fact, we just need to compare two vectors. We list some of the most popular.
- Pearson correlation is a classic coefficient, which is quite applicable when comparing vectors.

Its main disadvantage is that when the intersection is estimated to be low, the correlation can be high simply by accident.
To combat accidentally high correlation, you can multiply by a factor of 50 / min (50, Rating intersection) or any other damping factor, the effect of which decreases with an increase in the number of estimates. - Spearman Correlation
The main difference is the rank factor, i.e. It does not work with absolute values of ratings, but with their sequence numbers. In general, the result is very close to the Pearson correlation.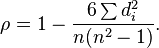
- Cosine Distance
Another classic factor. If you look closely, the cosine of the angle between the standardized vectors is the Pearson correlation, the same formula.
Why cosine - because if two vectors are co-directed (i.e. the angle between them is zero), then the cosine of the angle between them is equal to one. Conversely, the cosine of the angle between perpendicular vectors is zero.
An interesting development of the collaborative approach is the so-called Trust-based recommendations, which take into account not only the proximity of people according to their interests, but also their “social” proximity and the degree of trust between them. If, for example, we see that on Facebook a girl occasionally visits a page with her friend’s audio recordings, then she trusts her musical taste. Therefore, in the recommendation of the girl, you can completely mix in new songs from a friend's playlist.
Rationale for recommendations
It is important that the user trusted the recommendation system, and for this it should be simple and straightforward. If necessary, a clear explanation of the recommendation should always be available (in English terminology explanation).
As part of the explanation, it is not bad to show the evaluation of the goods by the neighbors, by which attribute (for example, an actor or director) was a coincidence, and also to deduce the confidence of the system in the evaluation (confidence). In order not to overload the interface, you can put all this information into the “Tell me more” button.
For example:
- "You may like the film ... because it plays there ... and ...".
- "Users with similar musical tastes have rated the album ... 4.5 out of 5".
Summary
This concludes the first part of the article. We reviewed the general formulation of the problem, talked about non-personal recommendations, described two classical approaches (content-based and collaborative filtering), and also touched upon the rationale for recommendations. In general, these two approaches are quite enough to build a production-ready recommender system. In the next part, I will continue the review and talk about more modern methods, including those involving neural networks and deep learning, as well as about hybrid models.
In the meantime, see our jobs.