“Continuous page repainting and debugging page redraws” in Chrome Dev Tools
- Tutorial

Today we’ll talk about how Chrome Dev Tools help us deal with redundant page redraws.
Past Parts:
Workspace and Snippets
Sass Support
Training
As always, put the last Chrome Canary . Optional, but very convenient to use a separate environment for testing. Everything that we need today is already activated there.
Situation
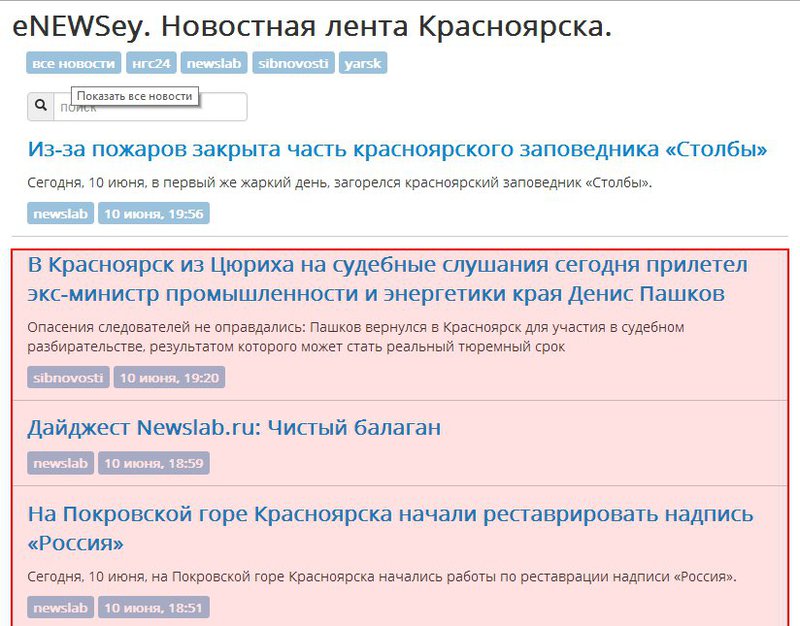
Consider the real case. There is a very simple local news aggregator page . Made on AngularJS. But today it is absolutely unimportant. When filtering news using css-animation. And now we notice that it does not work very smoothly somehow ...

Identify the problem
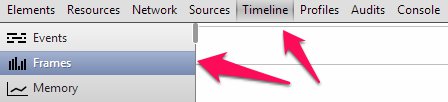
Open Chrome Dev Tools ( Cmd / Ctrl + Shift + I ). Open the Timeline tab . Under it, go to the Frames tab . Below we find the Record button , click it and start doing various news filtering on the page.

All events that occur will begin to be recorded in the Dev Tools window with rectangles of various colors. In this case, we are more interested in the upper window, which displays the number of frames per second. The smaller the height of the rectangle -> the closer it is to 60 FPS (60 frames per second) -> the better for everyone. Our application "sits" in some places. And it "sits" in Rendering (purple color) and Painting(green color). Both of these events are associated with the rendering of the page.

Now go to the settings (gear icon in the lower right corner). In Settings -> General we find the Rendering settings group . All of these settings help you debug page rendering speed. Let's go in order.

We mark the first item " Show paint rectangles ". This setting paints all areas of the page that are redrawn in red. We try to follow the links - everything is fine. We do filtering - many areas are painted over red many times, it's sad.
Next setting is " Show composited layer borders". It shows which parts of the page Chrome is trying to shift to the shoulders of the GPU . In the same way, we try to do all kinds of filtering, we see an orange outline around some elements.
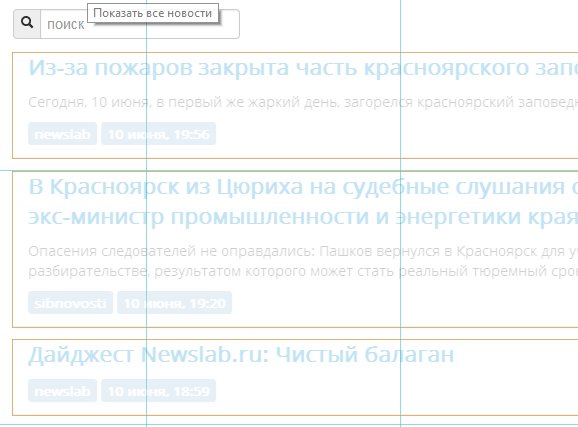
Next comes the" Show FPS meter . "Vyrviglazno-blood-red (is it just me? ...) frames per second meter. It is updated only during a redraw / draw event, for this we use the mouse or do news filtering.
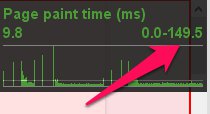
So we got to the main topic of this article - “ Enable continuous page repainting .” The tool in real time shows how many milliseconds it takes t rendering the page.We do our filtering - we get as much as 149.5 ms per page draw!
The whole charm of this tool is that we can disable various css properties and immediately see how the rendering time has changed. Hmm, what can increase the page rendering time so much when using animation?

We try to disable border-radius and text-shadow for the labels of the news source and the time of its publication. A wonderful tool shows that it reduced page rendering time to 102.4 ms !

Well, you and I initially knew that it was all about the animation itself using translateX :) Disable and watch the result:
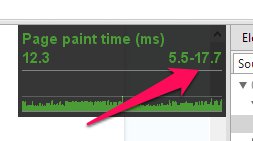
Voila, the maximum time is 17.7 ms . Not perfect, but we reduced the rendering time by 84.7 ms!
Useful advice:In the Elements panel: to disable certain DOM elements, it is not necessary to delete them. You can just hide them. Just select the item and press the H key on the keyboard .
Conclusion
This is how you can use Chrome Dev Tools to speed up rendering of pages. Continuous page repainting is a great tool to see real-time performance changes.
What conclusions can be drawn? Pay attention to the performance of your web application. This is especially true for all kinds of animations, shadows, rounding and other things. Try not to use border-radius and box-shadow together, because this can greatly reduce the page rendering speed.
Hope the post has been helpful. Have a nice coding!
Only registered users can participate in the survey. Please come in.
Did you know about this tool?
- 9.5% Knew - I use 43
- 12.9% Knew - DO NOT use 58
- 61.4% I did not know - I will use 276
- 16% I did not know - I WILL NOT use 72