On-the-knee monitoring - using Cacti to control Java applications
- From the sandbox
- Tutorial
The article describes a monitoring solution using Cacti using the example of the task of analyzing and controlling the consumption of resources of a large Java application.
My task was to propose measures to stabilize a large three-tier Java application with problems with memory consumption and performance in a short time. Time, as usual, is short: 1-2 weeks for everything. The company lacked a suitable application monitoring infrastructure, and it was not my task to create it. The option using JConsole was not suitable because of the need to analyze consumption over a long time and watch it after possible sudden reboots of applications.
In one of the companies where I worked, a solution for monitoring Java applications based on the RRD Tool was impressive in terms of convenience and simplicity . It consisted of a simple add-on perl-scripts that provide data collection and display via HTTP and a number of improvements-data collection agents in the application itself. For me, this was the idea of a solution, however, I did not have time to write a binding over RRD.
After a careful search, I found a free tool that implements the add-on I need - Cacti. Cacti is an application written in the Apache-PHP-MySql framework that allows you to configure the collection and display of monitoring data based on a web interface. Dealing with him was not difficult, a couple of days for raising the infrastructure, then setting up and adding data collection agents and all.
Further, the article describes in detail the solution that allowed me to solve my problem and, in the end, to successfully stabilize the application at the firm.
What you need to work:
(the versions on which monitoring was launched are indicated; any working Apache-PHP-MySql bundle is suitable) I will
describe the principle of monitoring on Cacti: using the "scheduled tasks" of Windows (or cron in unix), polling of data collection agents is periodically started, which in my case were: the JVM itself (memory consumption) and specialized improvements to the application. The collected information is placed in the RRD database - i.e. in circular buffers as files. Further, the accumulated data from RRD can be viewed through the Cacti web interface at various scales in terms of minutes, hours, days, months, etc.
The work plan is to raise all the necessary infrastructure, adapt the analyzed applications to collect data and configure data collection and output in Cacti .
Add the path to php.exe to the PATH variable, write the same path to the PHPRC variable.
Copy the php.ini-production file in php.ini and make the following changes to php.ini:
Uncomment the lines:
Add the following lines to conf \ httpd.conf:
Add mysql.exe path to PATH variable
Create cacti schema:
Import the cacti schema data structure
Create the cactiuser user:
Next, on the MySql command line:
For a quick test of the php-mysql-apache bundle, I used the following php script:
You need to put it in a file with a name, for example, testphp.php, copy it to the Apache directory htdocs / and load the localhost page: 8080 / testphp.php. The inscription “Success” should appear.
Unzip the cacti distribution to the Apache / htdocs directory.
Verify that the cacti /include/config.php file contains the following lines:
Go to localhost: 8080 / cacti / under the login admin / admin.
In the Settings-> Paths settings, set the paths to external utilities (it is recommended to use Unix-style paths, for example c: /php/php.exe).
Configure the php cacti / poller.php command to run every 5 minutes (via Windows Scheduled Tasks). I use a batch file for this:
Configuring Cacti Spine (optional: it is a poller written in C ++ that is used to speed up polling; Cacti is recommended)
Unzip the spine archive into the cacti directory to make sure spine.conf contains the following lines:
I tried two methods of collecting data - SNMP and polling the JMX server as part of the JVM and applications. SNMP is supported by Cacti and it is reasonable to use it if you need to watch only JVM memory usage and you need to do this very quickly. I started with SNMP, but after the first successes I switched to JMX. Cacti does not support JMX , so you have to pay for additional flexibility - it takes effort to write the receiving and responding parts in Java.
Below is the corresponding code.
Code for polling the JVM for memory status (similarly, code is written for an arbitrary JMX server):
Java code to run JMX. All these difficulties are needed to fix the port and host name, which is required with a firewall. Each service requires 2 ports, as can be seen from the code - one for http access, the other for RMI. Port allocation can obviously be done differently (in this case, RMI port = http port + 1), including explicitly specifying both ports. The following words will need to be added to the application launch line (jmxagent - jar file with agent code):
Next are screenshots of the most important Cacti settings.
Polling setup is an important point in Cacti general settings. I use Spine, polling starts every 5 minutes, data is taken every 10 seconds. See further RRD settings in Cacti - they need to be thought out in advance, because Further change without overwriting the RRD database is problematic. Here's a good selection of tips on these settings:
My RRD settings.
An example of the contents of one setting: To
Device settings , this is a server with an IP address from which data will be collected. We have several servers, each of them runs several Java services.
Set up Data Input Method - setting the method of data collection. In my case, this is a batch file that launches the Java JMX polling program (its source codes were given above.) The input parameters for it are the server address and port, i.e. Java applications.
An example of an input parameter description is in this case the server address. The predefined keyword is used - hostname, which is automatically populated by Cacti. The second parameter will be populated for each Data Source data collection setup, as will be seen later.
The output parameters that the batch file returns. Cacti understands them in the format:
My program returns 4 output values, here is an example of setting one of them (commited):

Next, create a Data Template - a template for setting data sources. The most important setting in Cacti, in my opinion. The template is associated with the configuration of the RRD database, it indicates the parameters for storage in the database (Data Source Item) and additional settings, in this case jmx host and jmx port, the first, as already mentioned, is automatically filled, the second will be filled at each data source , i.e. the data source will correspond to a single Java application.

Based on the template, a Data Source is created - a data source that can then be displayed on Graph charts. The source indicates the Device to which you want to connect to collect data, the source template, the name and location of the RRD database. In my case, you also need to specify an additional parameter - the JMX port. The important point is that with significant updates to the data collection settings in the Data Source or Data Template (for example, deleting and adding Data Source Item parameters), you need to recreate the RRD database. You can do this with your hands outside of Cacti (I haven’t gotten to this yet) or recreate the Data Source with the loss of all previous data. This is probably the most unpleasant feature of the Cacti-RRD bundle that I have encountered.

We begin to display the data by defining the Graph Template. Settings mainly determine how data is visualized. It is required to specify the parameters from the Data Template that you want to display on the chart and in what form. As far as I understand all these settings are a direct shell over the RRD command interface.
An example of setting the Data Source parameter. I use 5 elements on the diagram to display the memory consumption: Max, min, and the current consumption in the form of a solid fill (the output order is important!), Then two parameters - the maximum allocated and reserved consumption in the form of lines. Example, see below.

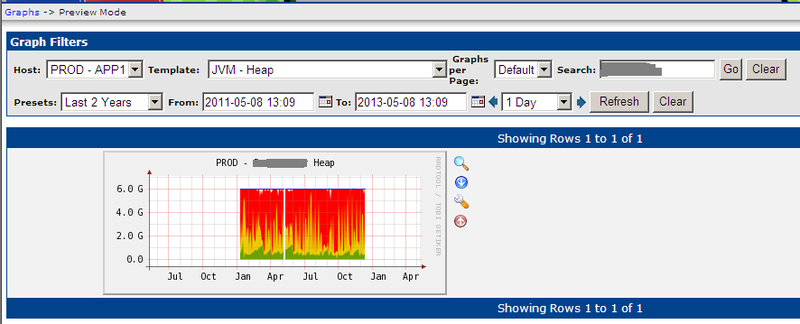
Graph chart - sets the template, server and correspondence between a specific Data Source and the chart template parameters:
An example of the final diagram using all the given settings: It can be seen that the average consumption is at 3 GB, but quite often it reaches the maximum allocated border of 6 GB (-Xmx). Data can be viewed with arbitrary detail (from 1 tick of collection to 2 years, as in the example and more). It all depends on the settings of the RRD database. With my settings, I had enough information to solve problems with consumption.
This is where the description of my solution ends. I emphasize that the main idea of the solution is the speed of implementation with high quality of the result. Questions and ideas for improvement are welcome.
That part of the settings, which concerns my specific performance parameters, I did not give, because they are completely similar to those already described.
Thanks for attention!
Cacti allowed me to successfully solve the problem of quickly setting up monitoring of Java applications. If you need to quickly do monitoring from scratch, I recommend this as one of the working options. If your plans include building long-term monitoring, then, in my opinion, it makes sense to look at the following options: implement powerful systems like Nagios, or write your own specialized add-on for RRD. Pros and Cons of Cacti:
Cons of the solution:
Advantages of the solution:
My task was to propose measures to stabilize a large three-tier Java application with problems with memory consumption and performance in a short time. Time, as usual, is short: 1-2 weeks for everything. The company lacked a suitable application monitoring infrastructure, and it was not my task to create it. The option using JConsole was not suitable because of the need to analyze consumption over a long time and watch it after possible sudden reboots of applications.
In one of the companies where I worked, a solution for monitoring Java applications based on the RRD Tool was impressive in terms of convenience and simplicity . It consisted of a simple add-on perl-scripts that provide data collection and display via HTTP and a number of improvements-data collection agents in the application itself. For me, this was the idea of a solution, however, I did not have time to write a binding over RRD.
After a careful search, I found a free tool that implements the add-on I need - Cacti. Cacti is an application written in the Apache-PHP-MySql framework that allows you to configure the collection and display of monitoring data based on a web interface. Dealing with him was not difficult, a couple of days for raising the infrastructure, then setting up and adding data collection agents and all.
Further, the article describes in detail the solution that allowed me to solve my problem and, in the end, to successfully stabilize the application at the firm.
What you need to work:
- Cacti 0.8.7i (the latest version at the time of implementation)
- Apache 2.2.21 (engine for Cacti)
- PHP 5.3.8 (the platform on which Cacti is written)
- MySQL 5.5 (storing Cacti settings)
- RRDTool 1.2.30 (drawing diagrams and storing monitoring data)
(the versions on which monitoring was launched are indicated; any working Apache-PHP-MySql bundle is suitable) I will
describe the principle of monitoring on Cacti: using the "scheduled tasks" of Windows (or cron in unix), polling of data collection agents is periodically started, which in my case were: the JVM itself (memory consumption) and specialized improvements to the application. The collected information is placed in the RRD database - i.e. in circular buffers as files. Further, the accumulated data from RRD can be viewed through the Cacti web interface at various scales in terms of minutes, hours, days, months, etc.
The work plan is to raise all the necessary infrastructure, adapt the analyzed applications to collect data and configure data collection and output in Cacti .
Infrastructure setup
Php
Add the path to php.exe to the PATH variable, write the same path to the PHPRC variable.
Copy the php.ini-production file in php.ini and make the following changes to php.ini:
Uncomment the lines:
extension_dir = c: \ php \ ext
extension = php_mysql.dll
extension = php_snmp.dll
extension = php_sockets.dll
cgi.force_redirect = 0
date.timezone = "Europe / Moscow"
Apache
Add the following lines to conf \ httpd.conf:
LoadModule php5_module c: \ php \ php5apache2_2.dll
AddType application / x-httpd-php .php
DirectoryIndex index.html index.htm index.php
Mysql
Add mysql.exe path to PATH variable
Create cacti schema:
mysql --user = root --password create cacti
Import the cacti schema data structure
mysql --user = root --password cacti <c: \ apache2 \ htdocs \ cacti \ cacti.sql
Create the cactiuser user:
mysql --user = root --password
Next, on the MySql command line:
mysql> create user cactiuser @ localhost IDENTIFIED BY 'cactiuser'
mysql> GRANT ALL ON cacti. * TO cactiuser @ localhost;
mysql> flush privileges;
For a quick test of the php-mysql-apache bundle, I used the following php script:
You need to put it in a file with a name, for example, testphp.php, copy it to the Apache directory htdocs / and load the localhost page: 8080 / testphp.php. The inscription “Success” should appear.
Configure Cacti
Unzip the cacti distribution to the Apache / htdocs directory.
Verify that the cacti /include/config.php file contains the following lines:
$ database_default = "cacti";
$ database_hostname = "localhost";
$ database_username = "cactiuser";
$ database_password = "cactiuser";
$ database_port = "3306";
Go to localhost: 8080 / cacti / under the login admin / admin.
In the Settings-> Paths settings, set the paths to external utilities (it is recommended to use Unix-style paths, for example c: /php/php.exe).
Configure the php cacti / poller.php command to run every 5 minutes (via Windows Scheduled Tasks). I use a batch file for this:
start / MIN php.exe cacti \ poller.php
Configuring Cacti Spine (optional: it is a poller written in C ++ that is used to speed up polling; Cacti is recommended)
Unzip the spine archive into the cacti directory to make sure spine.conf contains the following lines:
DB_Host 127.0.0.1 # is strictly not localhost !!!
DB_Database cacti
DB_User cactiuser
DB_Password cactiuser
DB_Port 3306
Select and configure data collection
I tried two methods of collecting data - SNMP and polling the JMX server as part of the JVM and applications. SNMP is supported by Cacti and it is reasonable to use it if you need to watch only JVM memory usage and you need to do this very quickly. I started with SNMP, but after the first successes I switched to JMX. Cacti does not support JMX , so you have to pay for additional flexibility - it takes effort to write the receiving and responding parts in Java.
Below is the corresponding code.
Code for polling the JVM for memory status (similarly, code is written for an arbitrary JMX server):
import java.io.Closeable;
import java.io.IOException;
import java.lang.management.MemoryMXBean;
import java.lang.management.MemoryUsage;
import javax.management.JMX;
import javax.management.MBeanServerConnection;
import javax.management.ObjectName;
import javax.management.remote.JMXConnector;
import javax.management.remote.JMXConnectorFactory;
import javax.management.remote.JMXServiceURL;
public class JvmHeapJmxClient {
    public static void main(String[] args) {
        JMXConnector jmxc = null;
        try {
            String jmxHost = args[0];
            String jmxPort = args[1];
            String jmxConnectionString = "service:jmx:rmi:///jndi/rmi://" + jmxHost + ":" + jmxPort + "/jmxrmi";
            JMXServiceURL url = new JMXServiceURL(jmxConnectionString);
            jmxc = JMXConnectorFactory.connect(url, null);
            MBeanServerConnection mbsc = jmxc.getMBeanServerConnection();
            ObjectName memoryMBeanName = new ObjectName("java.lang:type=Memory");
            MemoryMXBean memoryMBeanProxy = JMX.newMXBeanProxy(mbsc, memoryMBeanName, MemoryMXBean.class, true);
            MemoryUsage memoryUsage = memoryMBeanProxy.getHeapMemoryUsage();
            echo(
                "used:" + memoryUsage.getUsed() + " " +
                "committed:" + memoryUsage.getCommitted() + " " +
                "init:" + memoryUsage.getInit() + " " +
                "max:" + memoryUsage.getMax());
        } catch(Exception e) {
            e.printStackTrace();
        } finally {
            closeStream(jmxc);
        }
    }
    private static void echo(String msg) {
        System.out.println(msg);
    }
    private static void closeStream(Closeable stream) {
        try {
            if (stream != null) {
                stream.close();
            }
        } catch (IOException e) {
            e.printStackTrace();
        }
    }
}
Java code to run JMX. All these difficulties are needed to fix the port and host name, which is required with a firewall. Each service requires 2 ports, as can be seen from the code - one for http access, the other for RMI. Port allocation can obviously be done differently (in this case, RMI port = http port + 1), including explicitly specifying both ports. The following words will need to be added to the application launch line (jmxagent - jar file with agent code):
-Djmxagent.port =-Djmxagent.host = -javaagent: jmxagent.jar
import java.io.IOException;
import java.lang.management.ManagementFactory;
import java.rmi.registry.LocateRegistry;
import java.util.HashMap;
import javax.management.MBeanServer;
import javax.management.remote.JMXConnectorServer;
import javax.management.remote.JMXConnectorServerFactory;
import javax.management.remote.JMXServiceURL;
public class JmxFirewallAgent {
    private JmxFirewallAgent() { }
    public static void premain(String agentArgs) throws IOException {
        try {
            final int rmiRegistryPort = Integer.parseInt(System.getProperty("jmxagent.port"));
            LocateRegistry.createRegistry(rmiRegistryPort);
            final int rmiServerPort = rmiRegistryPort + 1;
            MBeanServer mbs = ManagementFactory.getPlatformMBeanServer();
            HashMap env = new HashMap();
            final String hostname = System.getProperty("jmxagent.host");
            JMXServiceURL url = new JMXServiceURL("service:jmx:rmi://" + hostname + ":" + rmiServerPort + "/jndi/rmi://" + hostname + ":" + rmiRegistryPort    + "/jmxrmi");
            JMXConnectorServer cs = JMXConnectorServerFactory.newJMXConnectorServer(url, env, mbs);
            cs.start();
        } catch (Exception e) {
            e.printStackTrace();
        }
    }
}
Next are screenshots of the most important Cacti settings.
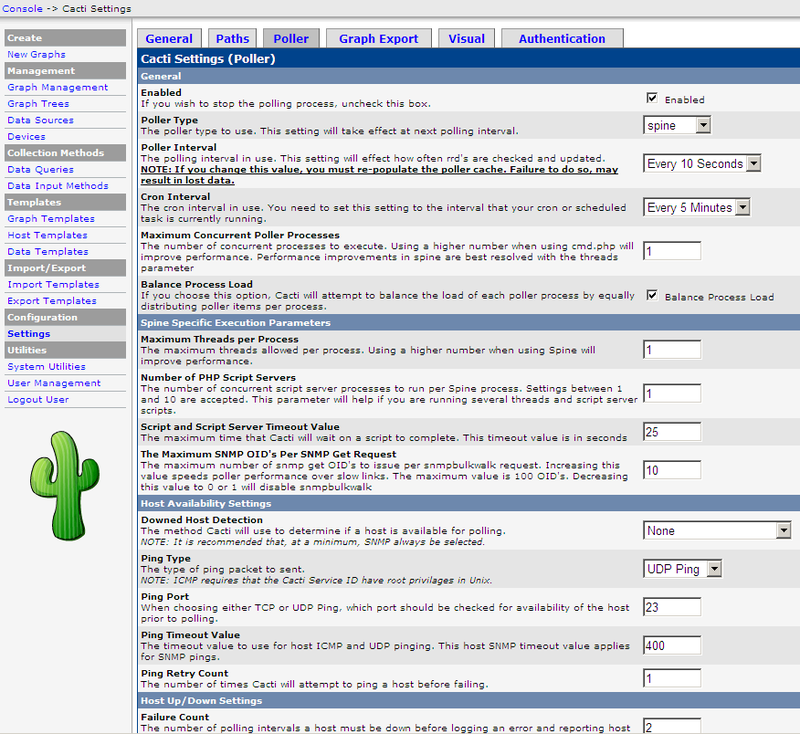
Polling setup is an important point in Cacti general settings. I use Spine, polling starts every 5 minutes, data is taken every 10 seconds. See further RRD settings in Cacti - they need to be thought out in advance, because Further change without overwriting the RRD database is problematic. Here's a good selection of tips on these settings:
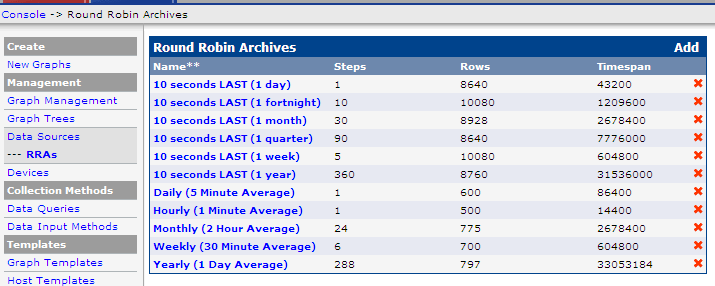
My RRD settings.
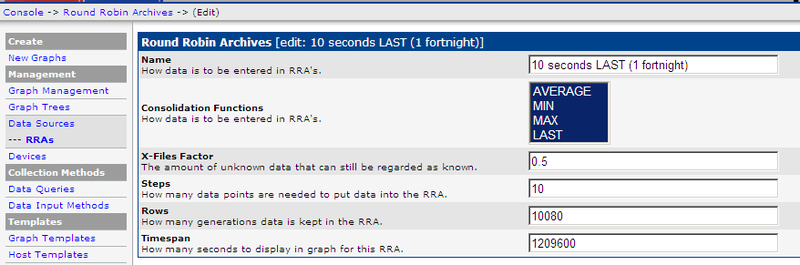
An example of the contents of one setting: To
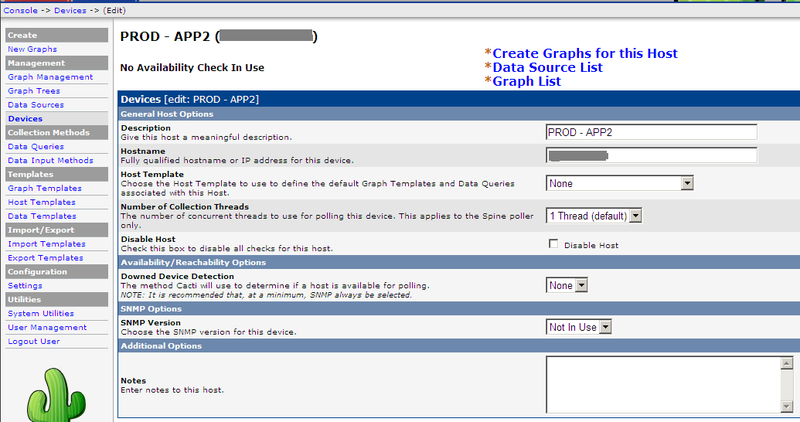
Device settings , this is a server with an IP address from which data will be collected. We have several servers, each of them runs several Java services.
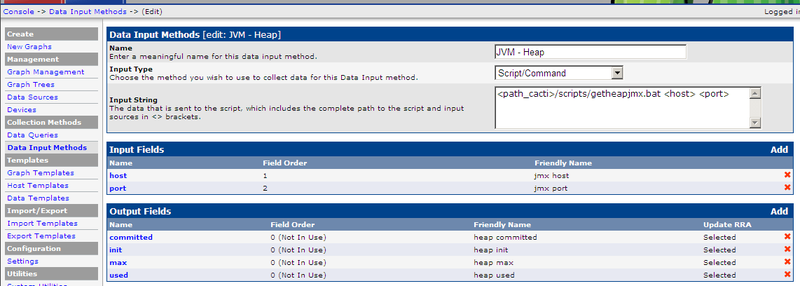
Set up Data Input Method - setting the method of data collection. In my case, this is a batch file that launches the Java JMX polling program (its source codes were given above.) The input parameters for it are the server address and port, i.e. Java applications.
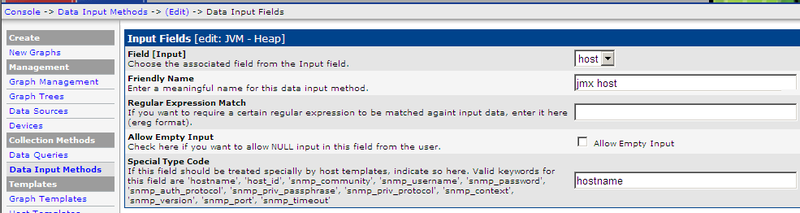
An example of an input parameter description is in this case the server address. The predefined keyword is used - hostname, which is automatically populated by Cacti. The second parameter will be populated for each Data Source data collection setup, as will be seen later.
The output parameters that the batch file returns. Cacti understands them in the format:
key1: value1 key2: value2
My program returns 4 output values, here is an example of setting one of them (commited):
Next, create a Data Template - a template for setting data sources. The most important setting in Cacti, in my opinion. The template is associated with the configuration of the RRD database, it indicates the parameters for storage in the database (Data Source Item) and additional settings, in this case jmx host and jmx port, the first, as already mentioned, is automatically filled, the second will be filled at each data source , i.e. the data source will correspond to a single Java application.
Based on the template, a Data Source is created - a data source that can then be displayed on Graph charts. The source indicates the Device to which you want to connect to collect data, the source template, the name and location of the RRD database. In my case, you also need to specify an additional parameter - the JMX port. The important point is that with significant updates to the data collection settings in the Data Source or Data Template (for example, deleting and adding Data Source Item parameters), you need to recreate the RRD database. You can do this with your hands outside of Cacti (I haven’t gotten to this yet) or recreate the Data Source with the loss of all previous data. This is probably the most unpleasant feature of the Cacti-RRD bundle that I have encountered.
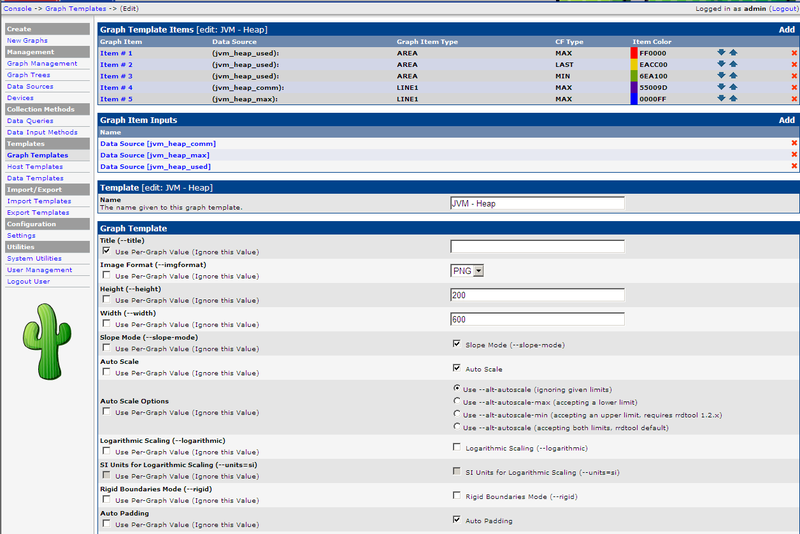
We begin to display the data by defining the Graph Template. Settings mainly determine how data is visualized. It is required to specify the parameters from the Data Template that you want to display on the chart and in what form. As far as I understand all these settings are a direct shell over the RRD command interface.
An example of setting the Data Source parameter. I use 5 elements on the diagram to display the memory consumption: Max, min, and the current consumption in the form of a solid fill (the output order is important!), Then two parameters - the maximum allocated and reserved consumption in the form of lines. Example, see below.
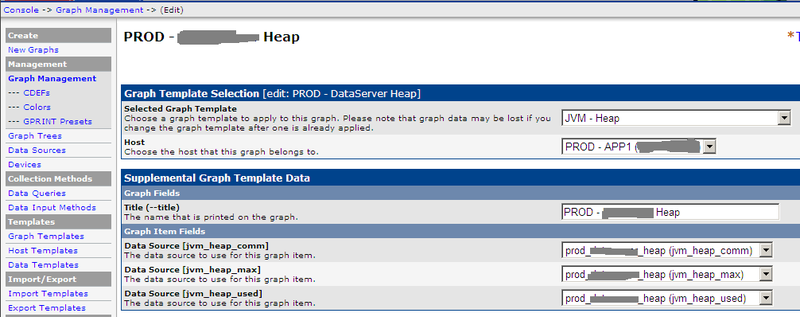
Graph chart - sets the template, server and correspondence between a specific Data Source and the chart template parameters:
An example of the final diagram using all the given settings: It can be seen that the average consumption is at 3 GB, but quite often it reaches the maximum allocated border of 6 GB (-Xmx). Data can be viewed with arbitrary detail (from 1 tick of collection to 2 years, as in the example and more). It all depends on the settings of the RRD database. With my settings, I had enough information to solve problems with consumption.
This is where the description of my solution ends. I emphasize that the main idea of the solution is the speed of implementation with high quality of the result. Questions and ideas for improvement are welcome.
That part of the settings, which concerns my specific performance parameters, I did not give, because they are completely similar to those already described.
Thanks for attention!
Conclusions:
Cacti allowed me to successfully solve the problem of quickly setting up monitoring of Java applications. If you need to quickly do monitoring from scratch, I recommend this as one of the working options. If your plans include building long-term monitoring, then, in my opinion, it makes sense to look at the following options: implement powerful systems like Nagios, or write your own specialized add-on for RRD. Pros and Cons of Cacti:
Cons of the solution:
- A fairly rapid increase in the number of similar settings in the case of a large number of environments and Java application servers.
- Limited performance of non-native JMX solutions for Cacti.
Advantages of the solution:
- High deployment speed with minimal extra coding
- Simplicity and convenience of the interface for viewing diagrams and their settings (you do not need to learn something complicated right away)